 |

Financial
Management MGT201
VU
Lesson
25
STOCK
BETAS &RISK, SML& RETURN AND
STOCK PRICES IN EFFICIENT
MARKS
Learning
Objectives:
After
going through this lecture,
you would be able to have an
understanding of the following
topics.
·
Stock
Betas and Risk
·
SML
& Required Returns (CAPM)
·
Stock
Prices in Efficient
Markets
In
the previous lecture, we have mentioned
that the risk that is
relevant in efficient markets
where
the
investors are sensible and
rational is the market risk.
This is because rational investors
maintain
many
stocks and they maintain
diversified portfolio which
contain stocks from
different sectors and
they
manage
to eliminate their diversifiable
risk and the only risk
they faced is the market component of
the
risk.
However, this market component
can not be eliminated and it
will remain because markets
do
fluctuate.
Fluctuation in the Market Index
(KSE 100 index) is a measure
of Market Risk. This
fluctuation
is caused by macro economic and socio
political factors. Rational Investors in
Efficient
Markets
eliminate the Random Company-Specific
Risk through Portfolio
Diversification. So, in
Efficient
Market the only Risk that
remains is Market Risk. And
so, the Price of Efficient Stocks
is
based
on Market Risk only. But the
CAPM based on the fundamental
principal that the rate of return
for
the
stock is directly proportional to the
risk premium and the risk
premium dependent on market
risk
alone
and not the total risk.
Before going into details of
SML we first go through the remaining
topics
related
to beta and its theoretical
calculation based on standard
deviation and covariance. We have
mentioned
that beta of the stocks have tendency of
stock to move with the market. It is
experimentally
possible
to calculate beta of the stock by monitoring the
price or rate of return of the stock and at
the
same
time monitoring the market
index in the same period of
time & comparing that
how the changes in
the
stock market price relate to the
changes in the stock market
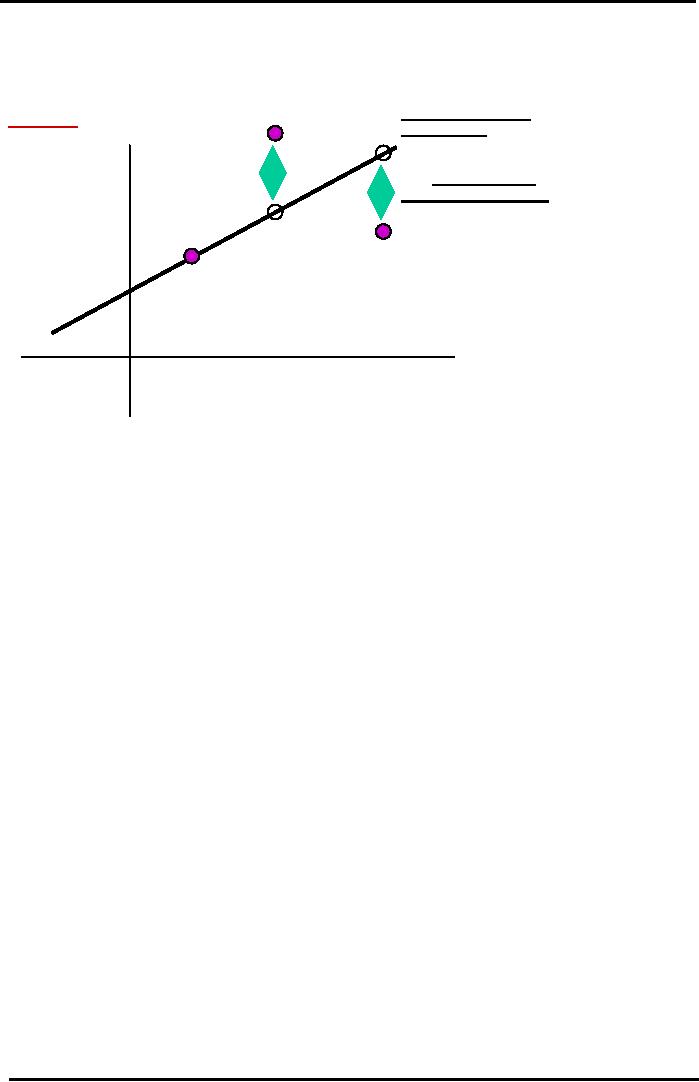
index. If you plot them on the
graph
where
you have expected return for stock on Y-
axis and expected return from the stock
market index
slope
of the line from these
points represent the
beta
Stock
Beta measures the Risk of a Stock
Relative to the market.
Beta
Stock A
=
%
Δ
rA* / %
Δ
rM* =
Slope of Regression Line.
Regression Line uses
Experimental
Data.
The
formula that relates beta of
the stock to the standard deviation is as
follows
Beta
Stock A = Covariance of Stock A
with Market / Variance of
Market
=
σ
A
σ
M
ρ
AM
/ σ 2
M
(Covariance
Formula based on Probability &
Statistical Portfolio Theory)
Links Stock Beta
(Market
Portion of Risk) to Stock Standard
Deviation (Total Single
Stock Risk).
Simplified
formula:
=
σ
A
ρ
AM
/ σ M
= market
risk
Theoretical
Beta Example:
Suppose
you have Analyzed the Historical
Time Data for (1) Movements
of the Price (or Return) of
a
Stock A and (2) Movements in the
Value of the Stock
Index.
You
then Apply Simple
Probability Formulas to compute the following Standard
Deviations:
σ
A
= 30%
(Stock A's Total Risk or
Standard Deviation)
σ
M
= 20%
(Stock Market Index Standard
Deviation or Risk)
ρ
AM
= + 0.8
(Correlation between Stock A and the
Market Index)
Compute
the Theoretical Beta of Stock A:
Stock
A Beta = 30% (0.8) / 20% =
24% / 20% = 1.2
108

Financial
Management MGT201
VU
Calculating
Stock Beta
Graphically
Linear
Regression through Annual
Data Points for 3
Years.
CALCULATION
OF BETA
Year
2
BASED
ON EXPERIMENTAL
Expected
DATA
OR OBSERVATION
Return
on
Slope
= Beta =
Y / X
Stock
A
=
% rA* /
% rM*
=
(Historical)
%
A
=Risk
Relative to Market =
rA* - rRF
(rA* - rRF)
/ (rM* - rRF)
Y-Intercept
=
Year
1
Alpha
=
Company
Specific Risk
rM* - rRF
Expected
Return on KSE
100 Market Index
Year
3
(Historical)
%
The
beta of 1.2 shows that stock
is relatively more risky then the
market and if the market
moves
up by 10% this stock will
move up by 12%.
If
all the points of the stock lie on the
straight line then stock
does not have any
diversifiable risk.
The
difference
between the actual data point and the
point which vertically lies
above or below the point is
representative
of the error which is representative of the
company's risk attached to
any stock.
Now
we can put together the two
concepts which we studied up
till now that is
company's
specific
risk and the second concept of
regression line and the distance between
data line and actual
point
of the company's risk. Now, we
can come up with the total
definition of total risk
variances.
Total
variance risk formula:
Total
Risk of Stock A in terms of
Variance (= Std Dev 2)
Total
Risk = Market
Risk + Random
Specific Unique Risk
σ2A
β2A
σ2
M
+
σ
2
A-Error
=
Visualizing
the Variance Risk Formula on
the Regression
Line
If
a Stock is Part of a Totally
Diversified Portfolio then
its Company Risk = 0.
Therefore Total Risk
=
Market Risk. And the Stock
points will lie exactly on
the Regression line.
If
a Stock is a Single Investment
then it carries Company
Specific or Diversifiable or Random
Risk.
This
means that its points
will not lie on the
Regression line. The extent
to which the points
are
scattered
away is a measure of the Variance
Error Term (last term in the
formula)
109
Financial
Management MGT201
VU
How
Efficiently Priced is Stock A?
A
Regression
(Beta) Line for
Stock
IF
STOCK A WERE
Expected
Return
EFFICIENT,
ALL
on
Stock
A
Error
=
POINTS
WOULD LIE
(Historical)
%
Measure
of
ON
A STRAIGHT LINE
Company
-
AND
TOTAL RISK =
rA* - rRF
Specific
Risk
MARKET
RISK ONLY
Error
=
of
Stock A
Measure
of
Company
-
Specific
Risk
of
Stock A
rM* - rRF
Expected
Return on KSE
100 Market Index (Historical)
%
Variance
Risks Example:
If
the Market Risk = 20% and
Stock A's Beta = 1.5 then
what is the Relevant Market
Risk
Component
of Stock A?
Stock
A's Market Variance = Beta
A2 x
Market Variance = 1.52 x
(20%) 2 = 2.25 x 400%
=
900%
(Variance)
So
the Stock A's Market Risk
(in Standard Deviation terms) =
Square Root of Variance =
30%
=
Beta A σ
M
Note
that Total Risk of Stock A
can be calculated directly by calculating
the Standard Deviation of
the
Possible Future Returns. That
was the first Risk Formula
we studied in Risk
Theory.
Suppose
Total Risk = 35%. Then
Company Specific or Diversifiable or
Random Risk of Stock A =
Total
Risk - Market Risk = 35% -
30% = 5%.
So
86% (= 30/35 x 100) of Stock
A's Total Risk is Market
Risk - quite likely that
Stock A is Part of
a
well Diversified Portfolio or
Mutual Fund.
Security
Market Line (SML)
:
Straight
Line Model is for Beta Risk
and Required Return. Similar to the
Relationship for the 2-
Stock
Portfolio with Ro>0 Beta
Risk is Directly Proportional to
Required Return. The
Investors require
an
extra Return which exactly
compensates them for the extra
Risk of the Stock relative to the
Market.
SML
Linear Equation for the
Required Return of any Stock
A:
rA =
rRF + (rM
- rRF )
β A
In
the above formula
rA
=
Return that Investors
Require from Investment in
Stock A.
rRF
=
Risk Free Rate of Return
(i.e. T-Bill ROR).
rM
=
Return that Investors
Require from Investment in an
Average Stock (or the
Market
Portfolio
of All Stocks where β
M = +
1.0 always).
β
A =
Beta for Stock A. (rM
- rRF
) β
A =
Risk Premium or Additional Return
Required in
Excess
of Risk Free ROR to compensate the
Investor for the Additional
Market Risk of the
Stock
Required
Rate of Return,
Risk
Premium & Market
Risk:
SML
Model for Efficient Markets
establishes a Straight Line
relationship (or Direct
Proportionality)
between
a Stock's Required ROR and its
Risk Premium.
rA
= rRF
+ (rM
- rRF
)
A
A
Stock's Risk Premium depends on
its Market Risk Portion (and
not the Total Risk)
110
Financial
Management MGT201
VU
In
Efficient Markets, Market Price of a
Stock is based on Required
Return which depends
on
Risk
Premium which depends on Stock's
Market Risk Component (and
not the Total Risk).
Stock
Prices in Efficient
Markets:
A
Single Stock Investor who
owns No Stocks and wants to buy a
Share A will have to
face
more
Risk (Market Risk + Specific
Risk) than a Rational Fully
Diversified Investor. The
Single
Stock
Investor will want to buy
the Stock at a lower price to
compensate him for the
higher risk.
However,
Efficient Markets do not
price stocks based on Single
Stock Investors who
want
compensation
for taking on Unnecessary
Company-Specific Risk which
they should have
diversified
away.
Efficient
Markets price the Stocks
based on their Market Risk
Component only. So,
Efficient Stock
Prices
are based on Rational
Investors holding Diversified
Portfolios of many
stocks.
SML
- Numerical Example:
Calculate
the Required Rate of Return
for Stock A given the
following data:
β
A =
2.0 (i.e. Stock A is Twice
as Risky as the Market)
rM
= 20%
pa (i.e. Market ROR or ROR on a Portfolio
consisting of All Stocks or ROR on
the
"Average Stock")
rRF
= 10%
pa (i.e. T-Bill ROR)
SML
Equation (assumes Efficient
Stock Pricing, Risk, and
Return)
rA =
rRF + (rM
- rRF )
β
A
.
=
10% +
(20% - 10%) (2.0) =
30%
Interpretation
of Result:
Investors
require a 30% pa Return from
Investment in Stock A. This is
higher than the
Market
ROR because the Stock (Beta =
2.0) is Riskier than the
Market (Beta = 1.0
always).
If
Required Return (30%) is
higher than Expected Return
(20%) it means that Stock A
is
Unlikely
to Achieve the Investors' Requirement and
Investors will NOT invest in
Stock A.
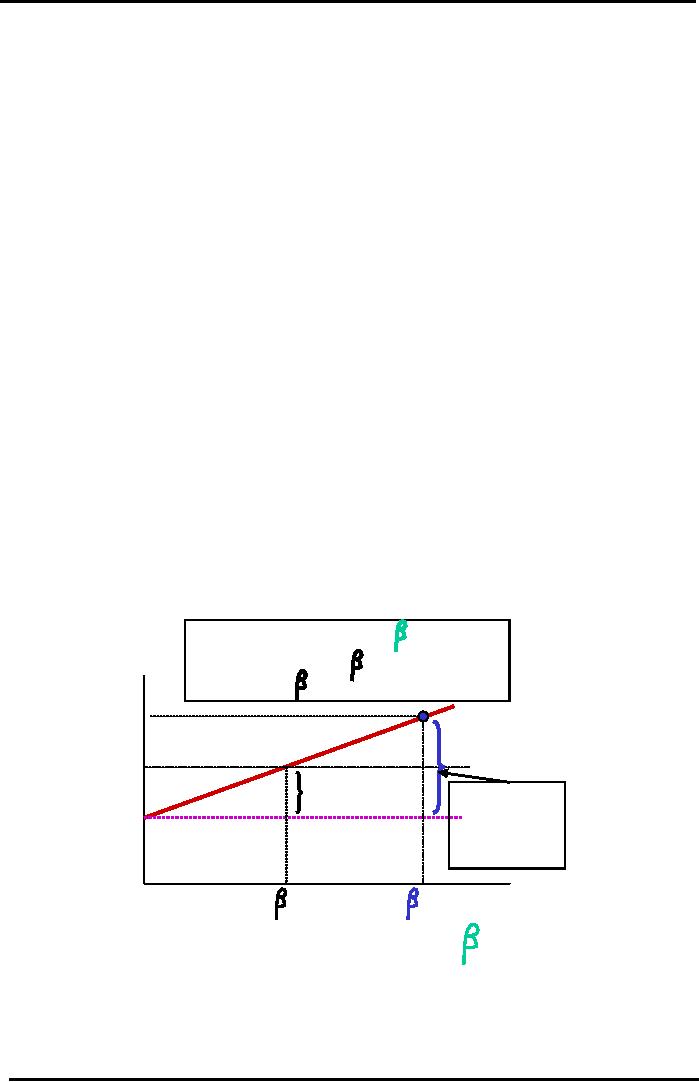
Security
Market Line (SML)
For
Market of Efficient
Stocks
rA = rRF +
(rM -
rRF )
x
A
Required
y
= c + mx where x = and m = Slope
=
(rM -
rRF) / ( M
- 0) =
(rM -
rRF) /1
Return
(r*)
rA= 30%
Security
Market Line
rM=
20%
Market
Risk
Premium
for
Risky
Stock A's
Avg
Stock =
rRF= 10%
Total
Risk
10%
Premium
=
30-10
= 20%
A
=+ 2.0
M
=+ 1.0
Beta
Risk (
)
111
Table of Contents:
- INTRODUCTION TO FINANCIAL MANAGEMENT:Corporate Financing & Capital Structure,
- OBJECTIVES OF FINANCIAL MANAGEMENT, FINANCIAL ASSETS AND FINANCIAL MARKETS:Real Assets, Bond
- ANALYSIS OF FINANCIAL STATEMENTS:Basic Financial Statements, Profit & Loss account or Income Statement
- TIME VALUE OF MONEY:Discounting & Net Present Value (NPV), Interest Theory
- FINANCIAL FORECASTING AND FINANCIAL PLANNING:Planning Documents, Drawback of Percent of Sales Method
- PRESENT VALUE AND DISCOUNTING:Interest Rates for Discounting Calculations
- DISCOUNTING CASH FLOW ANALYSIS, ANNUITIES AND PERPETUITIES:Multiple Compounding
- CAPITAL BUDGETING AND CAPITAL BUDGETING TECHNIQUES:Techniques of capital budgeting, Pay back period
- NET PRESENT VALUE (NPV) AND INTERNAL RATE OF RETURN (IRR):RANKING TWO DIFFERENT INVESTMENTS
- PROJECT CASH FLOWS, PROJECT TIMING, COMPARING PROJECTS, AND MODIFIED INTERNAL RATE OF RETURN (MIRR)
- SOME SPECIAL AREAS OF CAPITAL BUDGETING:SOME SPECIAL AREAS OF CAPITAL BUDGETING, SOME SPECIAL AREAS OF CAPITAL BUDGETING
- CAPITAL RATIONING AND INTERPRETATION OF IRR AND NPV WITH LIMITED CAPITAL.:Types of Problems in Capital Rationing
- BONDS AND CLASSIFICATION OF BONDS:Textile Weaving Factory Case Study, Characteristics of bonds, Convertible Bonds
- BONDS VALUATION:Long Bond - Risk Theory, Bond Portfolio Theory, Interest Rate Tradeoff
- BONDS VALUATION AND YIELD ON BONDS:Present Value formula for the bond
- INTRODUCTION TO STOCKS AND STOCK VALUATION:Share Concept, Finite Investment
- COMMON STOCK PRICING AND DIVIDEND GROWTH MODELS:Preferred Stock, Perpetual Investment
- COMMON STOCKS RATE OF RETURN AND EPS PRICING MODEL:Earnings per Share (EPS) Pricing Model
- INTRODUCTION TO RISK, RISK AND RETURN FOR A SINGLE STOCK INVESTMENT:Diversifiable Risk, Diversification
- RISK FOR A SINGLE STOCK INVESTMENT, PROBABILITY GRAPHS AND COEFFICIENT OF VARIATION
- 2- STOCK PORTFOLIO THEORY, RISK AND EXPECTED RETURN:Diversification, Definition of Terms
- PORTFOLIO RISK ANALYSIS AND EFFICIENT PORTFOLIO MAPS
- EFFICIENT PORTFOLIOS, MARKET RISK AND CAPITAL MARKET LINE (CML):Market Risk & Portfolio Theory
- STOCK BETA, PORTFOLIO BETA AND INTRODUCTION TO SECURITY MARKET LINE:MARKET, Calculating Portfolio Beta
- STOCK BETAS &RISK, SML& RETURN AND STOCK PRICES IN EFFICIENT MARKS:Interpretation of Result
- SML GRAPH AND CAPITAL ASSET PRICING MODEL:NPV Calculations & Capital Budgeting
- RISK AND PORTFOLIO THEORY, CAPM, CRITICISM OF CAPM AND APPLICATION OF RISK THEORY:Think Out of the Box
- INTRODUCTION TO DEBT, EFFICIENT MARKETS AND COST OF CAPITAL:Real Assets Markets, Debt vs. Equity
- WEIGHTED AVERAGE COST OF CAPITAL (WACC):Summary of Formulas
- BUSINESS RISK FACED BY FIRM, OPERATING LEVERAGE, BREAK EVEN POINT& RETURN ON EQUITY
- OPERATING LEVERAGE, FINANCIAL LEVERAGE, ROE, BREAK EVEN POINT AND BUSINESS RISK
- FINANCIAL LEVERAGE AND CAPITAL STRUCTURE:Capital Structure Theory
- MODIFICATIONS IN MILLAR MODIGLIANI CAPITAL STRUCTURE THEORY:Modified MM - With Bankruptcy Cost
- APPLICATION OF MILLER MODIGLIANI AND OTHER CAPITAL STRUCTURE THEORIES:Problem of the theory
- NET INCOME AND TAX SHIELD APPROACHES TO WACC:Traditionalists -Real Markets Example
- MANAGEMENT OF CAPITAL STRUCTURE:Practical Capital Structure Management
- DIVIDEND PAYOUT:Other Factors Affecting Dividend Policy, Residual Dividend Model
- APPLICATION OF RESIDUAL DIVIDEND MODEL:Dividend Payout Procedure, Dividend Schemes for Optimizing Share Price
- WORKING CAPITAL MANAGEMENT:Impact of working capital on Firm Value, Monthly Cash Budget
- CASH MANAGEMENT AND WORKING CAPITAL FINANCING:Inventory Management, Accounts Receivables Management:
- SHORT TERM FINANCING, LONG TERM FINANCING AND LEASE FINANCING:
- LEASE FINANCING AND TYPES OF LEASE FINANCING:Sale & Lease-Back, Lease Analyses & Calculations
- MERGERS AND ACQUISITIONS:Leveraged Buy-Outs (LBOs), Mergers - Good or Bad?
- INTERNATIONAL FINANCE (MULTINATIONAL FINANCE):Major Issues Faced by Multinationals
- FINAL REVIEW OF ENTIRE COURSE ON FINANCIAL MANAGEMENT:Financial Statements and Ratios