 |

Financial
Management MGT201
VU
Lesson
24
STOCK
BETA, PORTFOLIO BETA AND
INTRODUCTION TO SECURITY MARKET
LINE
(SML)
Learning
Objectives:
After
going through this lecture,
you would be able to have an
understanding of the following
topics.
·
Stock
Beta
·
Portfolio
Beta
·
Introduction
to SML (CAPM)
First,
we would recap some of the
concepts which we have studied in the
previous lectures.
It
is mentioned in the efficient capital
markets the investors would take on
extra risk only if they
are
compensated
in the form of extra return.
The market only compensates
the investor to the extent that
he
will
receive extra return for
extra market risk he takes
on by investing in a new stock. However,
the
market
will not pay the investor
any extra return for
taking on unnecessary risk in the
form of
company's
own risk. Therefore, it is
best for investors to act
rationally and to maintain
diversified
portfolios
of many stocks and in this
manner they can eliminate
the company's own risk
and they can
make
investments in stocks at a lower required
rate of return. Market portion of
risk can be
represented
through
the `Beta' coefficient and it is the
corner stone for Capital Asset
Pricing Model (CAMP).
Beta:
It
is a tendency of a Stock to move with the
Market (or Portfolio of all
Stocks in the Stock
Market).it
is the building block of
CAPM.
Total
Risk = Diversifiable Risk +
Market Risk
Total
Stock Return = Dividend
Yield + Capital Gain
Yield
Stock
Risk Vs Stock Beta:
Stock
Risk:
It
is a statistical spread of possible returns
(or Volatility) for that
Stock
Stock
Beta:
It
is a statistical spread of possible returns
(or Volatility) for that
Stock relative to the
market
spread i.e. spread (or
Volatility) of the fully diversified
market portfolio or
index.
Beta
Coefficients of Individual Stocks
are published in "Beta
Books" by Stock Brokerages &
Rating
Agencies
MARKET:
It
is the overall Stock Market.
For Example, Karachi Stock
Exchange. KSE 100 Index
represents Value
of
"Portfolio" of Highest Volume
Stocks but NOT ALL stocks.
Therefore it is not fully
perfect
diversified
portfolio.
Market
carries Risk. It moves up
and down because of macroeconomic factors
(inflation,
general
interest rates) and political
changes. Therefore the market
has some expected rate of
return
which
changes with time because of
this there is possibility of different
outcomes. There are no
fully
diversified
portfolios in reality. The
CAMP based on the promise market Beta to
be Equal to + 1.0. We
can
then look at the different
beta and compare them with
the markets.
Meaning
of Beta for Share ABC in
Karachi Stock Exchange
(KSE):
·
If Share A's Beta = +2.0
then that Share is Twice as
risky (or volatile) as the
KSE Market i.e. If
the
KSE 100 Index moved up
10% in 1 year, then based on
historical data, the Price of Share
B
would
move up 20% in 1
year.
·
If Share B's Beta = +1.0
then that Share is Exactly
as risky (or volatile) as the
KSE Market
·
If Share C's Beta = +0.5
then that Share is only
Half as risky (or volatile)
as the KSE Market
·
If you could find a
Share D with Beta = -1.0
then that share would be
exactly as volatile as
the
KSE
Market BUT in the opposite
way i.e. If the KSE 100
Index moved UP 10% then the
price
of
the Share D would move DOWN
by 10%!
·
The Beta of most Stocks
ranges between + 0.5 and +
1.5
·
The Average Beta for All
Stocks = Beta of Market = + 1.0
Always.
Our
approach for calculating the beta
will be straight forward.
Let us assume that we analyze
he
movements
in KSE index for period of
three years and we also analyze the
price movements for
the
Stock
A in KSE for the same period
of time of three years. We look at the
change in the price of the
103
Financial
Management MGT201
VU
stock
and compare it to the change in
price in the market for each
one of the three years
separately.
And
then we plot those points on
a graph where the expected return on the stock on the
y- axis and
the
expected return on the market on x-axis.
We are using the price of the stock and
value of the
index
as representative measures for the expected
return.
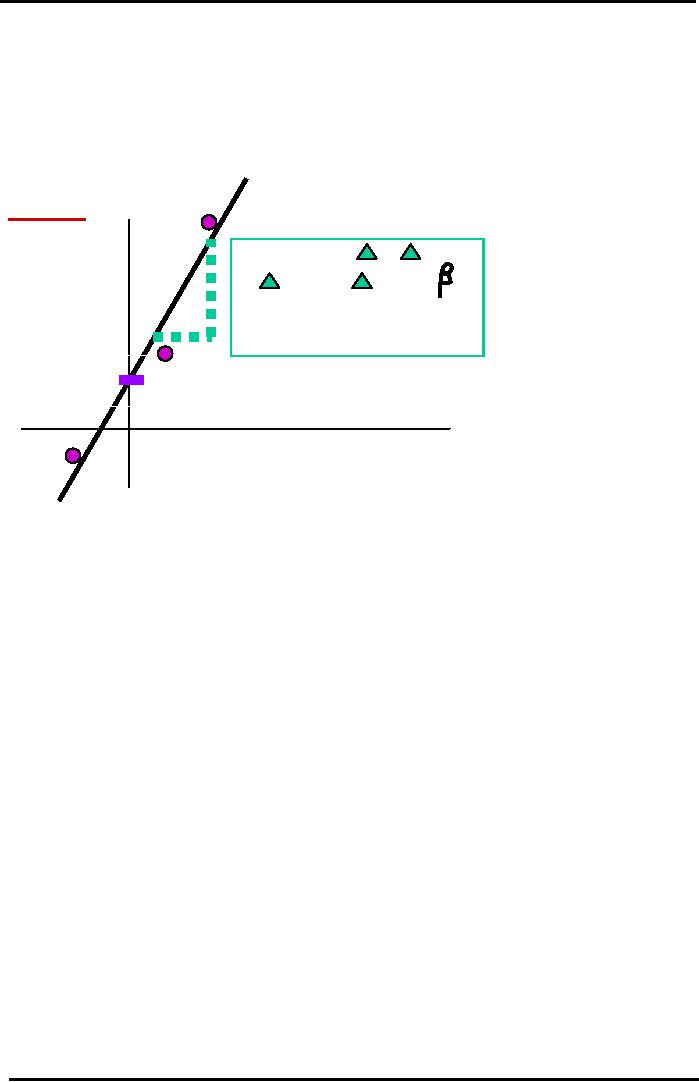
Calculating
Stock Beta
Graphically
Linear
Regression or Least Squares
Fit through
Experimental
Data
Collected for 3 Years
Year
2
Expected
Return
on
Slope
= Beta =
Y / X =
Stock
A
(Historical)
%
%
rA* /
% rM =
A=Risk
Relative to Market =
rA* - rRF
(rA* - rRF)
/ (rM* - rRF)
Y-Intercept
=
Year
1
Alpha
=
Company
Specific Risk
rM* - rRF
Expected
Return on KSE
100 Market Index
Year
3
(Historical)
%
If
you look at the graph, we have
plotted three years of data
for the changes in the
Karachi stock
exchange
100 market index and the expected
return on the stock A. The expected
return on A is on y-
axis
and it is represented by rA*
and the expected
return on stock in KSE 100
market index is
represented
by rM* the
`*'
represented
the expected part of the rate of
return. In both cases the
expected
returns
have been benched marked against the risk
free rate of return. That is
because we pick the
risk
free
rate of return as the starting point
for the changes in the expected return.
Three points are shown
on
the
graph on for each year in
the analysis and after plotting these
points on the graph we can
then do
what
is known as the linear regression of
straight line which best
fit through points. You have
studied
this
concept in the course of "Statistics and
Probability" .The slope of the line
represents the beta
coefficient.
Slope
= Beta = Δ
Y /
Δ
X = %
Δ
rA*
/ % Δ
rM*
=
A
=Risk
Relative to Market =
(rA* -
rRF)
/ (rM* -
rRF)
Beta
represents the risk of stock relative to
the return of the market and in
terms of risk free
rate
of
return we can define the Beta as the
expected rate of return for stock A minus
risk free rate of
return
divided
by the expected rate of return for the
market minus risk free rate of
return. We use
historical
data
of expected rate of return and we graphed it against
changes in the overall market
index
Calculating
Portfolio Beta
(CAPM):
There
are two ways of calculating
portfolio beta
·
Analyze Historical Data for
Portfolio Returns and Market
Index Returns like in the
case of
Stock
Beta, plot Least Squares Fit
Line, and compute Portfolio Line
Slope or Beta directly.
·
Use the Published Data for
Individual
Stock Betas from the "Beta
Book"
Portfolio
beta can be calculated as the
sample weighted average of the stock
beta's in that portfolio.
Portfolio
Beta = β P
=
XA
β A+
XB
β B
+ XC
β C
+.....
In
the formula
βA
represents the Beta (or Market
Risk) of Stock A.
XA represents the Weight of
Stock (fractional value of
investment in A to total
portfolio
value).The simple formula
for calculating the portfolio
beta is as follows.
Portfolio
Beta (or Market Risk)
Formula is a Simple Weighted
Average unlike the portfolio
risk formula
104

Financial
Management MGT201
VU
σP
=
XA2 σ
A
+XB2 σ
+
2 (XA XB σ Aσ
B
ρ
AB
)
2
2
B
Example:
·
Complete 2-Stock Investment
Portfolio Data:
Value
Exp
Return
(r*)
Tot
Risk
Beta
Stock
A
Rs.30
20%
20%
2.0
Stock
B
Rs.70
10%
5%
0.5
Total
Value =Rs 100
Correlation
Coefficient
=
+ 0.6
Portfolio
Mean
Expected Return =
13%
=
rP*
Portfolio
Risk
(Total)
= 8.57%
=
P
(relative to rP*)
Now
we can calculate the portfolio beta
which is measure of the market
portion of portfolio
risk.
Portfolio
Beta
=
XaBa + XbBb = (30/100) (2.0)
+ (70/100) (0.5) = 0.6 +
0.35
=
+0.95
=
β
P
(relative to Market Risk or
Volatility)
It
means that the Portfolio of A & B is
slightly less risky than the
totally diversified KSE
100
Market
Portfolio whose Beta =
+1.0
Effect
of New Stock Investment on
Portfolio:
Now
we will see the case that
what will happen to portfolio
beta if we add another stock to
it.
Suppose,
you add a 3rd Investment
Stock C, to your Old 2-Stock
Portfolio.
Value
Exp
Return (r*)
Beta
Stock
A
Rs.30
20%
2.0
Stock
B
Rs.30
10%
0.5
Stock
C
Rs.40
30%
1.5
Total
Value
Rs.100
3-Stock
Portfolio Beta = β P =
XaBa + XbBb + XcBc
=
(30/100) (2.0) + (30/100)
(0.5) + (40/100)
(1.5)
=
0.6+0.15+0.6 = 1.35
The
effect of adding a stock with a Beta
higher than the Portfolio's is
that it increases the
Portfolio's
Beta
or Risk. In this case we
also increase the beta by
adding new stock but the expected rate of
return
also
increases for the portfolio.
So, the increase rate of
return would compensate the
increase in risk.
Required
Rate of Return (CAPM)
Required
ROR vs. Expected
ROR
Expected
ROR (r*):
The
Most Likely (or Mean) ROR
expected in the future. It is calculated
using Weighted
Average
Formula and
Probabilities (what we have been
calculating so far).It is basically the
weighted
average
or mean of the expected return of the
individual investments in the
portfolio.
Required
ROR (r):
It
is the minimum return that investors
require from the stock to invest in
it. It
varies
from individual to individual. It is
based on
1)
Perceived Risk relative to the Market and
Psychological Risk Profile of
each Investor and
2)
His personal Opportunity Cost of
Capital preference.
We
have mentioned earlier that ROR or
opportunity cost varies from
person to person
because
every
individual have a different preference
for risk taking. Some
people have tendency to be gamblers
whereas
other people put their
money at national saving
schemes.
However,
the ROR can be linked
to
the Beta risk because based on the
portfolio theory and CAPM
where we mentioned there is direct
relationship
between risk and return.
Average
Required ROR for all
rational investors in an Efficient Market
can be estimated using
the
CAPM Theory: Beta and Risk
Free Rate of Return.
Total
Rate of Return (ROR) for
Single Stock = Dividend
Yield + Capital Gain.
GORDON'S
FORMULA
FOR COMMON STOCK PRICING OR VALUATION
USES REQUIRED RETURN r
=
DIV/Po
+ g. In Efficient Markets, Price of
Stocks is based on Market
Risk (or Beta).
We
can formulate the required rate of
return in terms of Beta risk so
how can we use beta
coefficient to
calculate
the required rate of return for the
average investor in the market.
The answer to it is the
105
Financial
Management MGT201
VU
Security
Market line SML. It is the
part of CAPM and it is the most
critical part of CAPM. SML
is
straight
line relationship that contains
all possible combinations of efficient
stocks in the market. If the
combination
of risk and return for any
stock does not lie on the SML
then that stock is not
efficiently
priced.
In other words, it means that
for most of the investors in the market
there ROR for investment in
stock
A is directly proportional to Beta risk
for that stock A. You will
recall that we are not
unfamiliar
with
straight line relationship between
risk and return when we are
talking about the portfolio
when we
calculate
the portfolio risk with a
+ve correlation coefficient we
came up with a continuously
increasing
relationship
between portfolio risk and return. So
that model is similar to
SML.
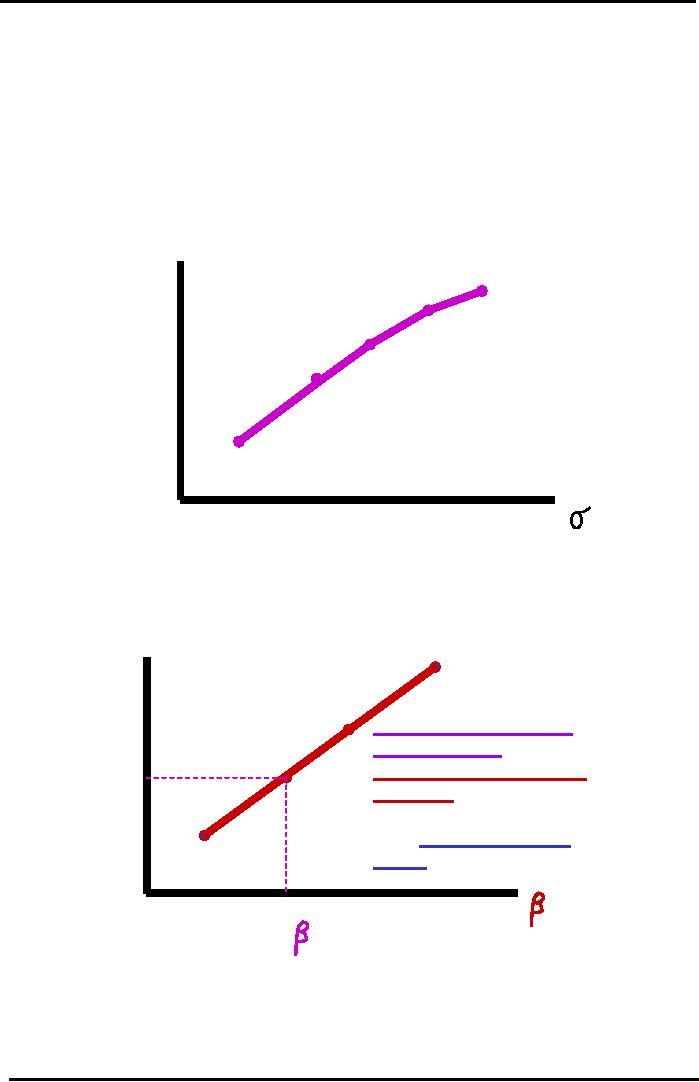
Risk
vs. Return Graph (Risk
Theory)
2-Stock
Portfolio with Positive Correlation
Coefficient
rP*
Non-Efficient
Portfolio
25%
Portfolio
23%
Return
20%
15%
10%
P
5%
9%
12%
15% 20%
Risk
Risk
vs. Return Graph (SML-
CAPM)
EFFICIENT
MARKETS WITH FULLY
DIVERSIFIED
PORTFOLIOS
AND EFFICIENTLY PRICED
STOCKS
r
25%
Required
Return
20%
FULLY
DIVERSIFIED
PORTFOLIOS
AND
EFFICIENTLY
PRICED
15%
STOCKS
IN
EFFICIENT
MARKETS
WILL LIE
ON
10%
THE
STRAIGHT SML
LINE.
P
1.0
0.5
1.5
2.0
Market
Risk
= M
Security
Market Line
(SML):
It
is a Straight Line Model for
Beta Risk and Required Return. It is
Similar to the Relationship
for
the
2-Stock Portfolio with
ρ
>0.
Beta Risk is Directly Proportional to
Required Return. The
Investors
require an extra Return
which exactly compensates them
for the extra Risk of the
Stock
relative
to the Market.
106

Financial
Management MGT201
VU
SML
Linear Equation for the
Required Return of any Stock
A:
rA =
rRF
+ (rM
- rRF
) β A .
In
the above equation
rA =
Return
that Investors Require from
Investment in Stock A.
rRF =
Risk
Free Rate of Return (ie.
T-Bill ROR).
rM =
Return
that Investors Require from
Investment in an Average Stock
(or the Market Portfolio of
All
Stocks
where β M = +
1.0 always). β
A =
Beta for Stock A. (rM
- rRF
)
β
A =
Risk Premium or Additional Return in
Excess of Risk Free ROR to
compensate the Investor
for
the
additional Risk.
107
Table of Contents:
- INTRODUCTION TO FINANCIAL MANAGEMENT:Corporate Financing & Capital Structure,
- OBJECTIVES OF FINANCIAL MANAGEMENT, FINANCIAL ASSETS AND FINANCIAL MARKETS:Real Assets, Bond
- ANALYSIS OF FINANCIAL STATEMENTS:Basic Financial Statements, Profit & Loss account or Income Statement
- TIME VALUE OF MONEY:Discounting & Net Present Value (NPV), Interest Theory
- FINANCIAL FORECASTING AND FINANCIAL PLANNING:Planning Documents, Drawback of Percent of Sales Method
- PRESENT VALUE AND DISCOUNTING:Interest Rates for Discounting Calculations
- DISCOUNTING CASH FLOW ANALYSIS, ANNUITIES AND PERPETUITIES:Multiple Compounding
- CAPITAL BUDGETING AND CAPITAL BUDGETING TECHNIQUES:Techniques of capital budgeting, Pay back period
- NET PRESENT VALUE (NPV) AND INTERNAL RATE OF RETURN (IRR):RANKING TWO DIFFERENT INVESTMENTS
- PROJECT CASH FLOWS, PROJECT TIMING, COMPARING PROJECTS, AND MODIFIED INTERNAL RATE OF RETURN (MIRR)
- SOME SPECIAL AREAS OF CAPITAL BUDGETING:SOME SPECIAL AREAS OF CAPITAL BUDGETING, SOME SPECIAL AREAS OF CAPITAL BUDGETING
- CAPITAL RATIONING AND INTERPRETATION OF IRR AND NPV WITH LIMITED CAPITAL.:Types of Problems in Capital Rationing
- BONDS AND CLASSIFICATION OF BONDS:Textile Weaving Factory Case Study, Characteristics of bonds, Convertible Bonds
- BONDS VALUATION:Long Bond - Risk Theory, Bond Portfolio Theory, Interest Rate Tradeoff
- BONDS VALUATION AND YIELD ON BONDS:Present Value formula for the bond
- INTRODUCTION TO STOCKS AND STOCK VALUATION:Share Concept, Finite Investment
- COMMON STOCK PRICING AND DIVIDEND GROWTH MODELS:Preferred Stock, Perpetual Investment
- COMMON STOCKS RATE OF RETURN AND EPS PRICING MODEL:Earnings per Share (EPS) Pricing Model
- INTRODUCTION TO RISK, RISK AND RETURN FOR A SINGLE STOCK INVESTMENT:Diversifiable Risk, Diversification
- RISK FOR A SINGLE STOCK INVESTMENT, PROBABILITY GRAPHS AND COEFFICIENT OF VARIATION
- 2- STOCK PORTFOLIO THEORY, RISK AND EXPECTED RETURN:Diversification, Definition of Terms
- PORTFOLIO RISK ANALYSIS AND EFFICIENT PORTFOLIO MAPS
- EFFICIENT PORTFOLIOS, MARKET RISK AND CAPITAL MARKET LINE (CML):Market Risk & Portfolio Theory
- STOCK BETA, PORTFOLIO BETA AND INTRODUCTION TO SECURITY MARKET LINE:MARKET, Calculating Portfolio Beta
- STOCK BETAS &RISK, SML& RETURN AND STOCK PRICES IN EFFICIENT MARKS:Interpretation of Result
- SML GRAPH AND CAPITAL ASSET PRICING MODEL:NPV Calculations & Capital Budgeting
- RISK AND PORTFOLIO THEORY, CAPM, CRITICISM OF CAPM AND APPLICATION OF RISK THEORY:Think Out of the Box
- INTRODUCTION TO DEBT, EFFICIENT MARKETS AND COST OF CAPITAL:Real Assets Markets, Debt vs. Equity
- WEIGHTED AVERAGE COST OF CAPITAL (WACC):Summary of Formulas
- BUSINESS RISK FACED BY FIRM, OPERATING LEVERAGE, BREAK EVEN POINT& RETURN ON EQUITY
- OPERATING LEVERAGE, FINANCIAL LEVERAGE, ROE, BREAK EVEN POINT AND BUSINESS RISK
- FINANCIAL LEVERAGE AND CAPITAL STRUCTURE:Capital Structure Theory
- MODIFICATIONS IN MILLAR MODIGLIANI CAPITAL STRUCTURE THEORY:Modified MM - With Bankruptcy Cost
- APPLICATION OF MILLER MODIGLIANI AND OTHER CAPITAL STRUCTURE THEORIES:Problem of the theory
- NET INCOME AND TAX SHIELD APPROACHES TO WACC:Traditionalists -Real Markets Example
- MANAGEMENT OF CAPITAL STRUCTURE:Practical Capital Structure Management
- DIVIDEND PAYOUT:Other Factors Affecting Dividend Policy, Residual Dividend Model
- APPLICATION OF RESIDUAL DIVIDEND MODEL:Dividend Payout Procedure, Dividend Schemes for Optimizing Share Price
- WORKING CAPITAL MANAGEMENT:Impact of working capital on Firm Value, Monthly Cash Budget
- CASH MANAGEMENT AND WORKING CAPITAL FINANCING:Inventory Management, Accounts Receivables Management:
- SHORT TERM FINANCING, LONG TERM FINANCING AND LEASE FINANCING:
- LEASE FINANCING AND TYPES OF LEASE FINANCING:Sale & Lease-Back, Lease Analyses & Calculations
- MERGERS AND ACQUISITIONS:Leveraged Buy-Outs (LBOs), Mergers - Good or Bad?
- INTERNATIONAL FINANCE (MULTINATIONAL FINANCE):Major Issues Faced by Multinationals
- FINAL REVIEW OF ENTIRE COURSE ON FINANCIAL MANAGEMENT:Financial Statements and Ratios