 |

Financial
Management MGT201
VU
Lesson
20
RISK
FOR A SINGLE STOCK
INVESTMENT, PROBABILITY GRAPHS AND
CO-
EFFICIENT
OF VARIATION
Learning
Objectives:
After
going through this lecture,
you would be able to have an
understanding of the following
topics
·
Risk
for Single Stock
Investment
·
Probability
Graphs and Coefficient of
variation
In
this lecture, we will
continue our discussion on
risk and return. This is
very important area
of
financial
management.
In
previous lecture, we have mentioned an
example for the investment in
share and after
one
year
the share price has 3 possible
outcomes. This uncertainty in
future price of the share
that leads to
the
certain distribution in forecasted
share price and this
distribution is source of the uncertainty
which
allow
us to calculate risk.
3
Possible Outcomes Example
Continued:
Measuring
Stand Alone Risk for
Single Stock
Investment
Std
Dev =
δ
=
√
∑ (r
i - < r i >) 2 p i.
=
(∑(r
i
- < r
i
>) 2
p
i.))
0.5.
=
{[(40-10)2
(0.3)]
+ [(10-10)2
(0.4)]
+ [(-20-10)2
(0.3)]
} 0.5
.
=
{270 + 0 + 270} 0.5
=
{Var}
0.5.
=
{540} 0.5
=
23.24
How
do we interpret this Result for
Risk?
Standard
Deviation Interpretation
What
are the units of Standard
Deviation?
For
our example where Return is
being estimated in % terms, the
units of
Standard
Deviation will also be
%.
It
tells us that if we assume a
Normal Probability Distribution and
symmetric about expected rate of
return,
then we conclude that 68.26% of the
time, the Actual Return will
lie within -1 Standard
Deviation
and +1 Standard Deviation of the Expected (or
Mean) Return.
Expected
(or Mean) Return =
10%
+/-
1 Standard Deviation = 10% +/-
23.24% which means from
(10%
- 23.24%)
to
(10%
+
23.24%) i.e.
from
-13.24% to 33.24%.
There
is a 68.26% chance that the
Actual Return on our Stock
Investment after 1 year will
be
somewhere
between -13.24% and 33.24%. It is
important thing to remember
that in normal
distribution
the
area under the curve from -1
standard deviation to +1 standard
deviation is 68.28%. So, we
can be
sure
that two thirds of the time
the actual value for the return
will be in between -13.68% and +33.24
%.
-13.24%
is not a good sign as it indicates
that we are making loss
but remember that required
rate of
return
is 10%.
Graphical
Standard Deviation
Expected
(or Mean)
Return
= <r> = 10%
+/-
1 Std Dev covers
68.26%
of the Area
Prob
under
the Normal
abili
Curve
always
ty
(p)
Return
(r) %
-2
-1
+1
+2
-13.24%
+33.24%
Our
Example
87
Financial
Management MGT201
VU
In
the figure the probability is written on
y-axis and the rate of return is
mentioned on the x-axis.
It
shows that higher the
standard deviation the higher the
risk.
Now,
lets take a look another example in
which we raw comparing three
different investments
which
we want to compare in terms of
risk and return.
Example:
Comparison
of 3 Investments in terms of Risk &
Return. Which is the best
Investment?
Risk
(Std Dev)
Expected
Return
Stock
A
23.24%
10%
T-Bill/Bond
B
5%
10%
Project
C
30%
30%
T-Bill
is Least Risky (lowest Std Dev
=5%) and Project C has
Highest Return
(=30%).
Given
2 Investments with Identical Expected
Return, choose the Investment
with the Lower
Risk
(or Spread
or
Volatility
or Standard
Deviation)
Given
2 Investments with Identical Risk,
choose the Investment with the
Higher Expected Return
If
you compare first two
investments, both have the same rate of
return but the T-bills have
less
risk.
Clearly, T-Bill B is a better
investment than Stock A
because their Returns are
identical (10%) but
the
T-Bill is less risky (10%)
than the Stock
(23.24%).
But,
which is better? T-Bill B or Project C?
T-Bill B is Less Risky but
Project C promises
Higher
Return.
Now,
we conceptually visualize these
two types of investment
Combined
Risk & Return
Graphical
Comparison of Investments
T-Bill
B:
Low
Risk
& Low
Proba
Return
bility
(p)
Project
C:
High
Risk
B
Risk
& High Return
Risk
C
Exp
Return C
Exp
Return B
Rate
of Return (r) %
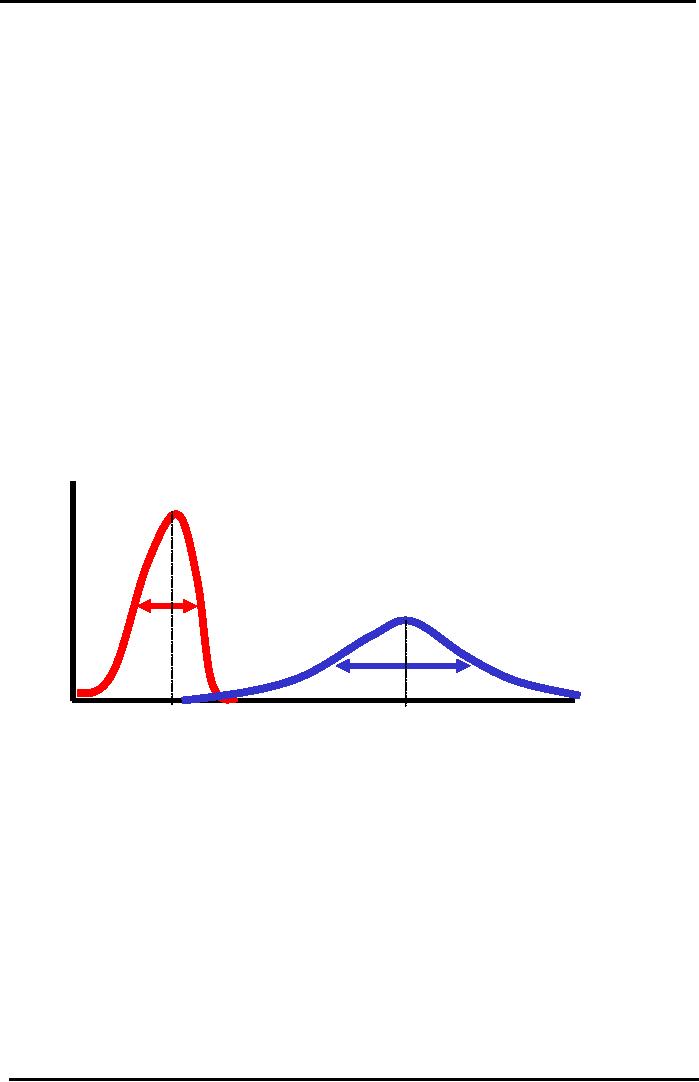
In
the figure, we are showing
both investments on the same graph.
Left hand shows the
probability
distribution for the T- bills and on
the right hand side shows
the broader and shorter
probability
graph for project C. How to
visualize which project have
higher expected rate of return.
Project
C is on right hand side and therefore it
has higher return as to
project B.The other thing is
that
project
B form a probability distribution
which have a sharp hill or
spread of the curve is much
narrower
as
to project C. The standard
deviation for project B is
much narrower then the
standard deviation
for
project
C .In project B has less
risk whereas Project C has a
higher expected rate return. We have
to
look
at risk and return
simultaneously to answer that
which option is better. We
can derive the answer
with
the help of the coefficient of
variation
Comparison
of Different Investments
Coefficient
of Variation:
Coefficient
of Variation (Risk per unit
Return)
88

Financial
Management MGT201
VU
It
is defined as the CV = Standard Deviation
/ Expected Return. Coefficient
of Variation tells us
about
the Risk per unit Return.
The project which offers
lowest per unit risk is the
best investment. Now
we
calculate the CV for both the
projects.
Compare
the CV's of the Projects:
CV
T-bill = 5% / 10% =
0.5
CV
Project C = 30% / 30% =
1.0
Choose
the Project with the Lowest
CV.
Choose the T-Bill because it
carries the lowest Risk per
unit
Return
Risk
Aversion Assumption
Most
Investors are psychologically Risk
Averse. If
two investments offer the same
Expected
Return,
most Investors would choose
the one with the lower Risk
(or Standard Deviation or
Spread
or
Volatility). In other words, most
Investors are not major
gamblers. Note that gamblers
would
choose
Project C which appeals to
investor greed by offering an upside
return of 30%+10% = 40%
!
Consequences
on Share Price: The
Higher the Risk of a Share, the
Higher its Rate of Return
and the
Lower
its Market Price.
89
Table of Contents:
- INTRODUCTION TO FINANCIAL MANAGEMENT:Corporate Financing & Capital Structure,
- OBJECTIVES OF FINANCIAL MANAGEMENT, FINANCIAL ASSETS AND FINANCIAL MARKETS:Real Assets, Bond
- ANALYSIS OF FINANCIAL STATEMENTS:Basic Financial Statements, Profit & Loss account or Income Statement
- TIME VALUE OF MONEY:Discounting & Net Present Value (NPV), Interest Theory
- FINANCIAL FORECASTING AND FINANCIAL PLANNING:Planning Documents, Drawback of Percent of Sales Method
- PRESENT VALUE AND DISCOUNTING:Interest Rates for Discounting Calculations
- DISCOUNTING CASH FLOW ANALYSIS, ANNUITIES AND PERPETUITIES:Multiple Compounding
- CAPITAL BUDGETING AND CAPITAL BUDGETING TECHNIQUES:Techniques of capital budgeting, Pay back period
- NET PRESENT VALUE (NPV) AND INTERNAL RATE OF RETURN (IRR):RANKING TWO DIFFERENT INVESTMENTS
- PROJECT CASH FLOWS, PROJECT TIMING, COMPARING PROJECTS, AND MODIFIED INTERNAL RATE OF RETURN (MIRR)
- SOME SPECIAL AREAS OF CAPITAL BUDGETING:SOME SPECIAL AREAS OF CAPITAL BUDGETING, SOME SPECIAL AREAS OF CAPITAL BUDGETING
- CAPITAL RATIONING AND INTERPRETATION OF IRR AND NPV WITH LIMITED CAPITAL.:Types of Problems in Capital Rationing
- BONDS AND CLASSIFICATION OF BONDS:Textile Weaving Factory Case Study, Characteristics of bonds, Convertible Bonds
- BONDS VALUATION:Long Bond - Risk Theory, Bond Portfolio Theory, Interest Rate Tradeoff
- BONDS VALUATION AND YIELD ON BONDS:Present Value formula for the bond
- INTRODUCTION TO STOCKS AND STOCK VALUATION:Share Concept, Finite Investment
- COMMON STOCK PRICING AND DIVIDEND GROWTH MODELS:Preferred Stock, Perpetual Investment
- COMMON STOCKS RATE OF RETURN AND EPS PRICING MODEL:Earnings per Share (EPS) Pricing Model
- INTRODUCTION TO RISK, RISK AND RETURN FOR A SINGLE STOCK INVESTMENT:Diversifiable Risk, Diversification
- RISK FOR A SINGLE STOCK INVESTMENT, PROBABILITY GRAPHS AND COEFFICIENT OF VARIATION
- 2- STOCK PORTFOLIO THEORY, RISK AND EXPECTED RETURN:Diversification, Definition of Terms
- PORTFOLIO RISK ANALYSIS AND EFFICIENT PORTFOLIO MAPS
- EFFICIENT PORTFOLIOS, MARKET RISK AND CAPITAL MARKET LINE (CML):Market Risk & Portfolio Theory
- STOCK BETA, PORTFOLIO BETA AND INTRODUCTION TO SECURITY MARKET LINE:MARKET, Calculating Portfolio Beta
- STOCK BETAS &RISK, SML& RETURN AND STOCK PRICES IN EFFICIENT MARKS:Interpretation of Result
- SML GRAPH AND CAPITAL ASSET PRICING MODEL:NPV Calculations & Capital Budgeting
- RISK AND PORTFOLIO THEORY, CAPM, CRITICISM OF CAPM AND APPLICATION OF RISK THEORY:Think Out of the Box
- INTRODUCTION TO DEBT, EFFICIENT MARKETS AND COST OF CAPITAL:Real Assets Markets, Debt vs. Equity
- WEIGHTED AVERAGE COST OF CAPITAL (WACC):Summary of Formulas
- BUSINESS RISK FACED BY FIRM, OPERATING LEVERAGE, BREAK EVEN POINT& RETURN ON EQUITY
- OPERATING LEVERAGE, FINANCIAL LEVERAGE, ROE, BREAK EVEN POINT AND BUSINESS RISK
- FINANCIAL LEVERAGE AND CAPITAL STRUCTURE:Capital Structure Theory
- MODIFICATIONS IN MILLAR MODIGLIANI CAPITAL STRUCTURE THEORY:Modified MM - With Bankruptcy Cost
- APPLICATION OF MILLER MODIGLIANI AND OTHER CAPITAL STRUCTURE THEORIES:Problem of the theory
- NET INCOME AND TAX SHIELD APPROACHES TO WACC:Traditionalists -Real Markets Example
- MANAGEMENT OF CAPITAL STRUCTURE:Practical Capital Structure Management
- DIVIDEND PAYOUT:Other Factors Affecting Dividend Policy, Residual Dividend Model
- APPLICATION OF RESIDUAL DIVIDEND MODEL:Dividend Payout Procedure, Dividend Schemes for Optimizing Share Price
- WORKING CAPITAL MANAGEMENT:Impact of working capital on Firm Value, Monthly Cash Budget
- CASH MANAGEMENT AND WORKING CAPITAL FINANCING:Inventory Management, Accounts Receivables Management:
- SHORT TERM FINANCING, LONG TERM FINANCING AND LEASE FINANCING:
- LEASE FINANCING AND TYPES OF LEASE FINANCING:Sale & Lease-Back, Lease Analyses & Calculations
- MERGERS AND ACQUISITIONS:Leveraged Buy-Outs (LBOs), Mergers - Good or Bad?
- INTERNATIONAL FINANCE (MULTINATIONAL FINANCE):Major Issues Faced by Multinationals
- FINAL REVIEW OF ENTIRE COURSE ON FINANCIAL MANAGEMENT:Financial Statements and Ratios