 |

Financial
Management MGT201
VU
Lesson
06
PRESENT
VALUE AND DISCOUNTING
Learning
objectives:
After
studying this lecture, you
would be able to have a better
understanding of the following.
·
Present
Value and Discounting
The
Topics of this lecture are
covered in the chapter 6 of our text
book called Financial
Management
theory and practice by Eugene F. Brigham
& Louis C. Gapenski.
Objectives
of present value:
The
objective of calculating the present
value is to translate the future cash
flows in to present
terms.
The basic principle is to
compare apples with apples.
For instance, if you have Rs.10 in
your
pocket
today and then you have may
as many rupees ten years
after, how can you
compare the two. You
can
do it only by comparing both
amounts at the Present
time.
We
choose the present (today) as the
most convenient point in
time where we could compare
all
the
cash flows taking place at
various points in time in
future. We must compare
everything at the
SAME
point in time otherwise; we
would be neglecting the Time
Value of money concept.
For
example, Rs 105 is more than Rs
100 BUT; Rs105 after 1 year
may not necessarily be
more
than Rs100 today! We first
have to first bring all cash
flows to the Present, or Discount them,
and
then
compare them. The concept of
present value says that we
can compare both the amounts
in the date
of
today we will bring back
future cash flows to the
present
Discounting:
"Discounting
is defined as bringing the future
cash flow to the present
time".
Before
answering which amount is greater in the
aforementioned example, we need to
have
some
concept of interest rates or the cost of
money. An interest rate can also be
understood as an
opportunity
cost.
One
of the simple ways of estimating what
opportunity cost or interest rate should
be for our
discounting
calculations, we can use interest rate
given on the PLS accounts by the banks.
For example,
if
money is deposited in a bank and getting
10% per annum then it is interest or
opportunity cost for
you.
This
interest on PLS account becomes
minimum rate of return which
any investment should be
able to
generate.
Therefore, the investment project
should offer higher rate of
return than the returns on the
PLS
account.
Now
let's see the answer of the
question that Rs.105 will be
more one year later or Rs.100
today,
and
for this, we need interest or
opportunity cost. It is important to
understand why interest rate is
called
opportunity
cost? Because, opportunity
cost essentially means the
cost of taking up one option
while
sacrificing
the other. For instance,
when you deposit your
money in the bank and get interest,
you are
sacrificing
by
(1)
Not consuming the money to buy something
for yourself and
(2)
Not investing your money
elsewhere at a higher return
than the bank interest.
Usually
when an investment option is
taken up, investors forgo the
option of depositing the
money
in a bank account and earn interest on
that. The opportunity lost
in this case is the
opportunity
cost.
Now the question is that
what kind of interest rate should we
use? There are many interest
rates
quoted
in the schedules of the bank but
for discounting, the most
commonly used rate is the
nominal
interest
rate, or APR.
Interest
Rates for Discounting
Calculations
·
Nominal
(or APR) Interest Rate = i
nom
·
It is usually published in
newspapers .Annual Nominal
Interest Rate is quoted for
1
year
by Credit Card Companies and
Leasing Companies because it
understates the
actual
(or Effective) interest you have to
pay, these companies want to
create an
impression
that the interest charged by them is the
minimum in the market.
·
Periodic
Interest Rate = i per
Periodic
interest rate is used in FM for
Discounting and Present Value
(PV) calculations.
It
is defined as
iper =
( i nominal Interest rate) / m
Where
m
= no. of times compounding takes place in
1 year i.e.
If
semi-annual compounding then m = 2
29

Financial
Management MGT201
VU
·
Effective
Interest Rate = i eff
It
is very useful to compare securities
and investments with different
life or
compounding
cycles but not used
for Discounting and
PV.
i
eff = [1 + ( i nom / m )]m
1
Where
m = no. of times compounding takes place
in 1 year, the compounding cycle. The
shorter the
compounding
cycle more frequently money
compounded & faster the
money grows.
Coming
back to our earlier example
where we were trying to
figure out whether or not Rs
100 of
today
are worth more than Rs 105 a
year after, while the
periodic interest rate is 10
percent per annum.
The
interest
rate used here would be
the nominal interest rate,
i.e., 10 percent. When we are going to
solve for
the
present value we are
discounting from the future to the
present
PV=FV/(1+i)n
Where,
i=interest rate
N=no.
of years if we plug in the values
PV=105/(1+0.10)1=Rs.95.45
Now
we can see that if we
discount Rs.105 from future
to the present that is only the
worth of
Rs.95.45
which is less than Rs.100.
The amount offered in the future is
seemingly more but
when
converted
to present value, the worth it
has today, it come out to be
less than Rs 100. Thus, it is
clear
that
Rs100 today worth more to
Rs. 105 one year later.
This conclusion is drawn on the
assumption that
interest
rate is 10%, but if we change the
interest rate, the answer might be
different.
With
the help of the following diagram, we
can observe the effect of
discounting the cash
flows.
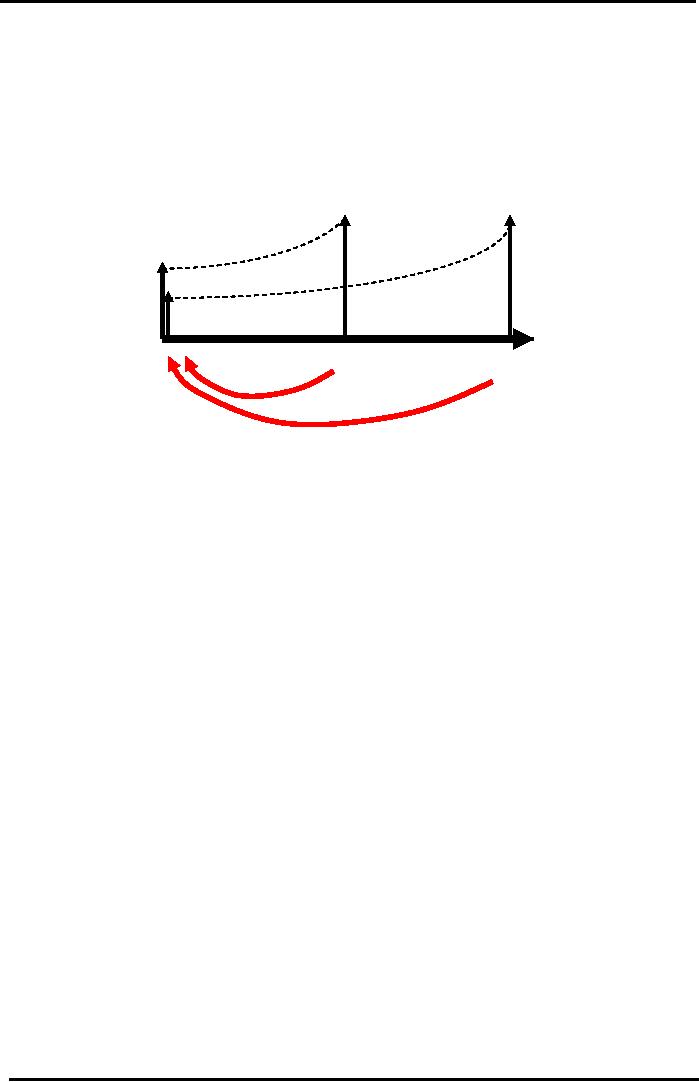
Now
the point to understand is that if we
discount back this money
from 2 years back we would
have
only
approximate Rs.87 in other words if Rs
105 are to be received after
two years, the present value
of
would
be even lesser
If
you discount Rs 105 two
years from now, you
will have lesser amount than
you have one
year
from today. It is clear from the
slide that as more future
cash flow occurs distant in
time, the more
its
present value
decreases.
Time
& Arrow Diagram
1
Year Discounting of Future
Value
Time
& Arrow Diagrams are important in
visualizing the concept of
Discounting
FV
= Rs. 105
PV
= Rs 95.45
Interest:
10% pa
Time
(Years)
Yr
1
Yr
0
Today
Present
Discounting
30
Financial
Management MGT201
VU
Time
& Arrow Diagram
2
Year Discounting of Future
Value
Notice
how Discounting Rs 105 (FV2)
from Year 2 gives a smaller
Present
Value
(PV2 = Rs 87) than
Discounting Rs 105 from Year
1
FV1
= Rs. 105
FV2
= Rs. 105
PV1=
Rs 95.45
PV2=
Rs 87
Interest:
10% pa
Interest:
10% pa
Time
(Years)
Yr
1
Yr
2
Yr
0
Today
Present
Discounting
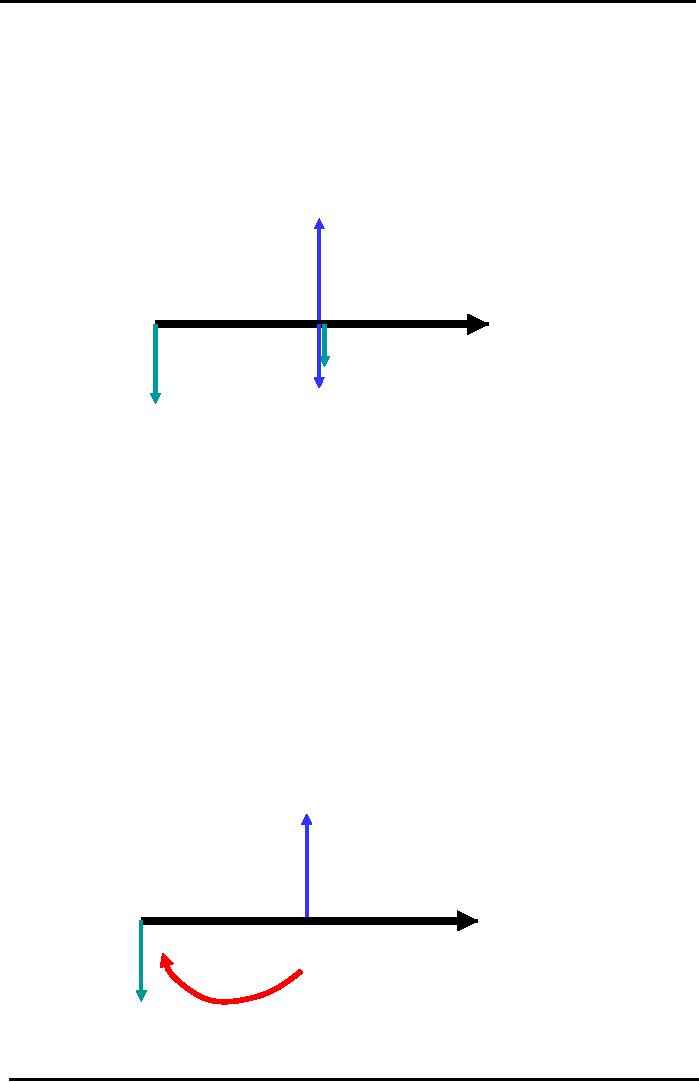
Cash
inflows (Income, other income &
cash profits) shown with
upward pointing arrow
Cash
outflows (expense) shown with
downward pointing
arrow
Discounting
Cash Flows of a Business, Investment, or
Project:
Let's
talk about the discounting
cash flow of the business as to
how we would estimate the
cash
flow
business can generate? How
can we calculate the market
value and intrinsic value of
a business or
working
asset? There are two
steps involved
1)
Forecast future cash flows
of any business, investment, or
project by using percent of
sales
method.
2)
Discount the net cash flows back to the
present time.
The
two-step process here can be
elaborated by the following hypothetical
example.
Cafe
Case Study:
Suppose
you are thinking about
starting a small café or
canteen inside a university
campus. You
make
a simple feasibility report
showing the estimated initial investment
and the forecasted cash
flows
for
the first Year (based on expected
cash receipts from sales
and cash payments for
expenses).
The
Key Financial Data is as
follows:
·
Initial Investment = Rs
100,000
·
Forecasted Cash Receipts (end
Year 1) = Rs 200,000
·
Forecasted Cash Payments
(end Year 1) = Rs
50,000
·
Forecasted Future Investment (end
Year 1)=Rs30,000
·
Periodic Interest Rate
(Opportunity Cost) = 10% p.a.
First
step is to represent the phenomenon
through a diagram in the form of
cash out flows.
31
Financial
Management MGT201
VU
Cash
Flow Diagram
Café
Example
Use
Downward
Pointing Arrows to
show Cash
Outflows (Cash
Payments
or Investments). Use Upward
Pointing Arrows to
show
Cash
Inflows (Cash
Receipts)
Receipts
= Rs. 200,000
Interest:
10% pa
Yr
0
Yr
1
Future
Investment = Rs 30,000
Payments
= Rs 50,000
Initial
Investment = Rs 100,000
First
of all, we can see the
initial investment represented by the
downward arrow. We have
also
forecasted
the sales one year from
now that is Rs.200, 000.
This is a cash inflow for
the business and is
represented
by an upward arrow; similarly, the
expenses and investments (cash
outflows) that we expect
in
future, will be shown by the downward
arrows. In the diagram there are three arrows, the
upward one
is
showing forecasted sales
(cash inflow) and two arrows
downward show expenses of Rs.50,
000 and
invest
outlay of Rs.30, 000
respectively. Now the combined
effect of the three arrows can be
represented
by a single arrow. We can
see that cash inflow of
Rs.200,000 is having a +ve sign
and
expenses
of Rs.50,000 and investment out
lay of Rs.30,000 have ve signs
and finally, by deducting
the
negative
signed figures from the positive
one we can arrive at the net
effect of the cash inflows
and
outflows,
which is given as
under
200,000-50,000-30,000
=Rs 120,000.
These
different arrows can be added or
subtracted because they are
occurring at the same
point
of
time and Rs.120, 000 can be shown by one
arrow sign. In order to calculate the
present value of
Rs.120,
000, rate of interest as discount factor
should be 10% per
year.
Simplified
Cash Flow Diagram
Café
Example
Net
Cash Receipts = CF1 =
FV1
=200,00050,00030,000
= Rs 120,000
Interest:
10% pa
Yr
1
Yr
0
After
combining all Cash
Flows
for
Year 2 into one Net
Cash
Flow
Figure (CF1), you
are
ready
to now Discount it to
the
Initial
Investment = Rs 100,000
Present...
32

Financial
Management MGT201
VU
Calculating
the NPV
of
the Café Business for 1st
Year:
NPV
= Net Present Value (taking
Investment outflows into
account)
NPV
= -Initial
Investment + Sum of Net Cash
Flows from Each Future
Year.
NPV
= -
Io
+PV
(CF1) + PV
(CF2) + PV
(CF3) + PV
(CF4) +
...+ ∞
Note
that PV (CF1)
means the Present Value of
Future Net Cash Flow
(CF) taking place at the
end
of Year 1. CF is like the FV in our
interest formulas. Our compounding
cycle is 1 year so the
Periodic
Interest Rate is 10%.
Present
Value of Net Cash Flow
from Year 1 =
PV
(CF1) =
CF1 / (1+ i) n
=
120,000 / (1+0.1)1 = Rs
109,000
The
value of money has shrink
from Rs.120, 000 to 109,000 as the
concept of time value of
the
money
suggests and now we are in
position to calculate the net present
value of the money:
NPV
= - Io
+ PV
(CF1) = -100,000
+ 109,000 = + Rs 9,000
The
NPV of our Business after 1
Year is Positive Rs 9,000
which is a good sign. We
will
discuss
this topic in more detail in
capital budgeting.
33
Table of Contents:
- INTRODUCTION TO FINANCIAL MANAGEMENT:Corporate Financing & Capital Structure,
- OBJECTIVES OF FINANCIAL MANAGEMENT, FINANCIAL ASSETS AND FINANCIAL MARKETS:Real Assets, Bond
- ANALYSIS OF FINANCIAL STATEMENTS:Basic Financial Statements, Profit & Loss account or Income Statement
- TIME VALUE OF MONEY:Discounting & Net Present Value (NPV), Interest Theory
- FINANCIAL FORECASTING AND FINANCIAL PLANNING:Planning Documents, Drawback of Percent of Sales Method
- PRESENT VALUE AND DISCOUNTING:Interest Rates for Discounting Calculations
- DISCOUNTING CASH FLOW ANALYSIS, ANNUITIES AND PERPETUITIES:Multiple Compounding
- CAPITAL BUDGETING AND CAPITAL BUDGETING TECHNIQUES:Techniques of capital budgeting, Pay back period
- NET PRESENT VALUE (NPV) AND INTERNAL RATE OF RETURN (IRR):RANKING TWO DIFFERENT INVESTMENTS
- PROJECT CASH FLOWS, PROJECT TIMING, COMPARING PROJECTS, AND MODIFIED INTERNAL RATE OF RETURN (MIRR)
- SOME SPECIAL AREAS OF CAPITAL BUDGETING:SOME SPECIAL AREAS OF CAPITAL BUDGETING, SOME SPECIAL AREAS OF CAPITAL BUDGETING
- CAPITAL RATIONING AND INTERPRETATION OF IRR AND NPV WITH LIMITED CAPITAL.:Types of Problems in Capital Rationing
- BONDS AND CLASSIFICATION OF BONDS:Textile Weaving Factory Case Study, Characteristics of bonds, Convertible Bonds
- BONDS VALUATION:Long Bond - Risk Theory, Bond Portfolio Theory, Interest Rate Tradeoff
- BONDS VALUATION AND YIELD ON BONDS:Present Value formula for the bond
- INTRODUCTION TO STOCKS AND STOCK VALUATION:Share Concept, Finite Investment
- COMMON STOCK PRICING AND DIVIDEND GROWTH MODELS:Preferred Stock, Perpetual Investment
- COMMON STOCKS RATE OF RETURN AND EPS PRICING MODEL:Earnings per Share (EPS) Pricing Model
- INTRODUCTION TO RISK, RISK AND RETURN FOR A SINGLE STOCK INVESTMENT:Diversifiable Risk, Diversification
- RISK FOR A SINGLE STOCK INVESTMENT, PROBABILITY GRAPHS AND COEFFICIENT OF VARIATION
- 2- STOCK PORTFOLIO THEORY, RISK AND EXPECTED RETURN:Diversification, Definition of Terms
- PORTFOLIO RISK ANALYSIS AND EFFICIENT PORTFOLIO MAPS
- EFFICIENT PORTFOLIOS, MARKET RISK AND CAPITAL MARKET LINE (CML):Market Risk & Portfolio Theory
- STOCK BETA, PORTFOLIO BETA AND INTRODUCTION TO SECURITY MARKET LINE:MARKET, Calculating Portfolio Beta
- STOCK BETAS &RISK, SML& RETURN AND STOCK PRICES IN EFFICIENT MARKS:Interpretation of Result
- SML GRAPH AND CAPITAL ASSET PRICING MODEL:NPV Calculations & Capital Budgeting
- RISK AND PORTFOLIO THEORY, CAPM, CRITICISM OF CAPM AND APPLICATION OF RISK THEORY:Think Out of the Box
- INTRODUCTION TO DEBT, EFFICIENT MARKETS AND COST OF CAPITAL:Real Assets Markets, Debt vs. Equity
- WEIGHTED AVERAGE COST OF CAPITAL (WACC):Summary of Formulas
- BUSINESS RISK FACED BY FIRM, OPERATING LEVERAGE, BREAK EVEN POINT& RETURN ON EQUITY
- OPERATING LEVERAGE, FINANCIAL LEVERAGE, ROE, BREAK EVEN POINT AND BUSINESS RISK
- FINANCIAL LEVERAGE AND CAPITAL STRUCTURE:Capital Structure Theory
- MODIFICATIONS IN MILLAR MODIGLIANI CAPITAL STRUCTURE THEORY:Modified MM - With Bankruptcy Cost
- APPLICATION OF MILLER MODIGLIANI AND OTHER CAPITAL STRUCTURE THEORIES:Problem of the theory
- NET INCOME AND TAX SHIELD APPROACHES TO WACC:Traditionalists -Real Markets Example
- MANAGEMENT OF CAPITAL STRUCTURE:Practical Capital Structure Management
- DIVIDEND PAYOUT:Other Factors Affecting Dividend Policy, Residual Dividend Model
- APPLICATION OF RESIDUAL DIVIDEND MODEL:Dividend Payout Procedure, Dividend Schemes for Optimizing Share Price
- WORKING CAPITAL MANAGEMENT:Impact of working capital on Firm Value, Monthly Cash Budget
- CASH MANAGEMENT AND WORKING CAPITAL FINANCING:Inventory Management, Accounts Receivables Management:
- SHORT TERM FINANCING, LONG TERM FINANCING AND LEASE FINANCING:
- LEASE FINANCING AND TYPES OF LEASE FINANCING:Sale & Lease-Back, Lease Analyses & Calculations
- MERGERS AND ACQUISITIONS:Leveraged Buy-Outs (LBOs), Mergers - Good or Bad?
- INTERNATIONAL FINANCE (MULTINATIONAL FINANCE):Major Issues Faced by Multinationals
- FINAL REVIEW OF ENTIRE COURSE ON FINANCIAL MANAGEMENT:Financial Statements and Ratios