 |

Financial
Management MGT201
VU
Lesson
31
OPERATING
LEVERAGE, FINANCIAL LEVERAGE,
ROE, BREAK EVEN POINT
AND
BUSINESS
RISK
Learning
Objectives:
After
going through this lecture,
you would be able to have an
understanding of the following
topics:
·
Operating
Leverage
·
Financial
Leverage
·
Concepts
of Return on Equity, Break-Even Point
and Business
Risks
In
this lecture we will
continue our discussion of
capital structure and specifically we
will discuss
Operating
Leverage, Financial Leverage and the
concepts related to Return on
Equity, Break-Even
Points
and Business Risks. In the last lecture we
mentioned that
total
stand alone
risk
faced by a firm
=
Business Risk + Financial
Risk
Now,
first we focus business risk
then later we shall discuss
financial risk.
Business
Risk (from Operations except
Debt):
Business
risk stems from the
operation and the assets of the firm.
These may be caused
by:
Uncertainty & fluctuations in
prices & costs.
Specific business & Market
Causes.
Higher operating leverage
(OL = Fixed Cost / Total
Cost) that results
in:
·
Higher breakeven
point
·
Higher but riskier expected
return on equity
(ROE)
Application
of Operating Leverage to Capital
Budgeting:
Operating
Leverage is the impact of a small
change in the sales on the returns on
equity. In
other
words small decline in sales
can cause large decline in
ROE (when sales are below
breakeven
point).
Its formula is
Operating
Leverage = Fixed Costs /
Total Costs
High
operating leverage increases
risk due to higher percentage of
fixed costs. There are
many
industries
which are prone to high
operating leverage. These
are Capital Intensive
Industries (i.e. Power
Plant,
Cement, Steel, and Textile Spinning),
New Product Development, and Research
& Development
High
Cost Industries (i.e.
Pharma, Auto) and industries
that need Highly Specialized
& Skilled Workers
(i.e.
Information Technology, Software House,
Semiconductor and Microprocessor,
Manufacturers).
Now
let us have a look at the sensitivity of
Return on Equity to changes in
sales. Recall from
the
previous lectures, ROE is a measure of
overall return of a firm. In
case of 100% equity firm the
ROE
is
the measure of the overall return
and any changes or variation
in ROE is a measure of risk for
that
firm.
First
concept that comes within
Operating Leverage is Break-even.
Break-even represents the
quantity
of sales at which operating
revenues exactly cover
operating costs. In other words
the
Breakeven
Point is the point or quantity of
sales at which Earnings before
Interest and Taxes (EBIT) =
0.
Now
EBIT
= Operating Revenue - Operating
Costs
Recall
accounting concepts. Operating
costs consists of fixed
costs and variable costs.
So
EBIT
= Operating Revenue - Variable Costs -
Fixed Costs
=
(PQ) (VQ) F,
where
P=
Product Price (Rs.),
Q=
Quantity or Number of Units
Sold of product,
V=
Variable Cost of product per
unit (Rs.),
Operating
Revenue= Product Price multiplied by Number of
Units Sold of product
Variable
Costs= Variable Cost of
product per unit multiplied by
Number of Units Sold of
product
F=
Fixed Cost (Rs).
As
at breakeven point
EBIT
= 0
and
we have just seen
EBIT
= (PQ)-(VQ)-F
so
EBIT=
(PQ) (VQ) F = 0.
From
this by solving equation we
can derive
133
Financial
Management MGT201
VU
Q
= F / (P - V).
This
equation represents the
minimum number of units the company must
sell in order to cover
its
operating
costs. We are discussing breakeven as
changes in operating leverage
will have an impact and
change
in breakeven quantity and also will have
impact on the likelihood of the company
making great
losses.
To understand the sensitivity and impact
of small changes in sales on ROE,
let us have look at a
diagram:
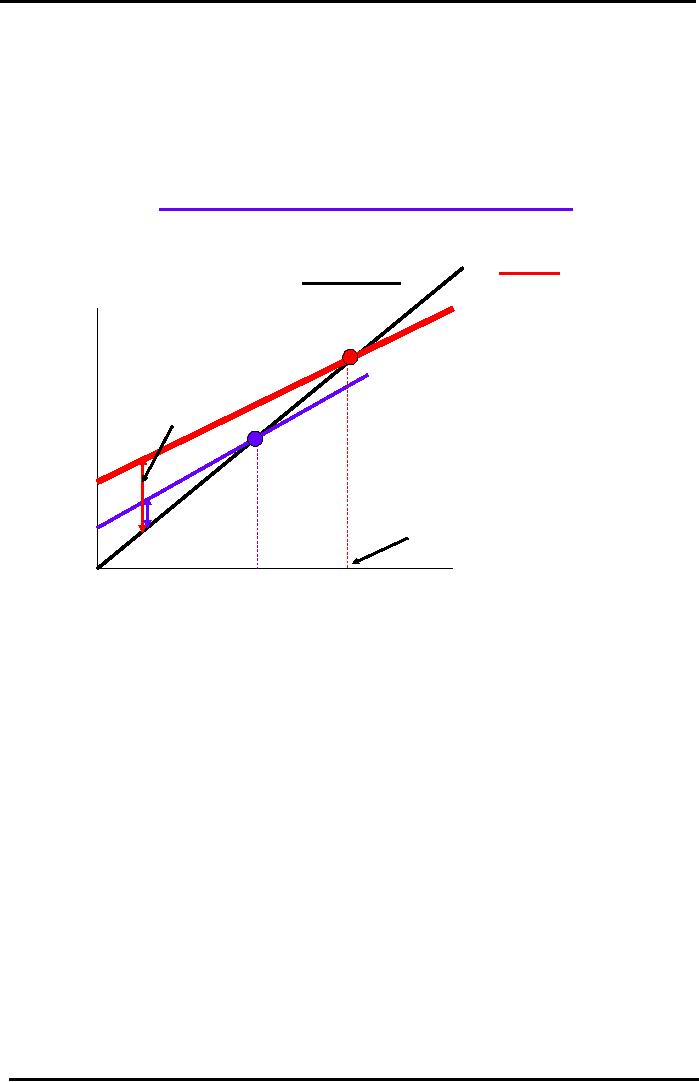
Visualizing
Operating Leverage
(OL)
Impact
on Breakeven Point & Capital
Budgeting
Sales
REVENUE Line Total
COST Line
Revenues
&
Technology
A:
Costs
(Rupees)
Higher
OL
Technology
A: Larger
OPERATING
LOSS
(Cost
> Revenue).
Total
COST Line
More
Risky
Technology
B
Fixed
Costs A
Fixed
Costs B
Breakeven
A: Higher.
More
Risky
Sales
Quantity
(#
of Units)
QB*
QA*
Here
operating leverage has been
graphed. On the Y-axis we have the revenues
and costs in
rupees
and on X-axis the sales quantity in
number of units. Line passing
through the origin
represents
sales
revenue (PQ). Total cost line
for two different
technologies have also been
drawn. Technology A
total
cost is represented by a line
which is higher up showing
higher operating leverage and
the
Technology
B total cost line is lower
with a high slope. Two
important consequences to note
from this
graph
are:
1-
For
Technology A fixed costs are
high so it has higher
operating leverage assuming
lines shown on
the
graph are representatives of total
costs of technologies. Impact of
technology A with high
operating
leverage
on EBIT is that technology A
has larger operating loss as
shown by the left hand side of
the
graph.
This loss is due to higher
total cost than the sales
revenue. A company with higher
operational
leverage
means it has higher % of
fixed costs. Whether the company
has high or low sales due
to
higher
% of fixed costs it has high
risks of operational losses. That's
why companies,
businesses,
projects
and technologies with higher
operating leverages are perceived as more
risky as they have more
chances
to incur operating losses
due to their unavoidable
high fixed costs. Higher
operating leverage
means
greater reduction in EBIT as shown in
graph.
2-
As
operating leverage increases
breakeven point also
increases i.e. breakeven shifts to the
right. In
other
words, companies with high
operating leverage require more
units to be sold to cover
their
operating
costs.
These
are the two ways operating
leverage affects the level of risk
for a company. The
above
discussion
of impact of operating leverage on
capital budgeting indicate
operating leverage affects
EBIT.
So,
higher operating leverage
means chances of falling ROE
drastically are higher. Hence,
companies
134

Financial
Management MGT201
VU
with
higher operating leverage
are more risky, their
required rate of return is higher,
discount rate in
NPV
formula is higher and NPV
for these companies will be
lower calculated for investment
decision.
Operating
Leverage Application to Capital
Structure:
Operating
leverage also affects Capital Structure.
Companies and technologies with high
operating
leverage
have higher risks that means
they have
·
Higher Betas (CAPM
Approach to Cost of Equity
Capital)
·
Higher Weighted Average
Cost of Capital
·
Also higher average
overall rate of return
measured in terms of return on
equity. This is possible
in
case of sales of companies
are higher than breakeven
point. In this case
companies with higher
operating
leverages earn higher
EBIT.
Therefore,
overall impact of operating
leverage must consider higher
risk and higher return
both
provided
by companies with high
operating leverage. Have a
look on the following graph to
visualize
the
effect of Operating Leverage on
risk and return of a particular
technology:
Visualizing
Operating Leverage
(OL)
Impact
on ROE & Capital
Structure
Technology
B: Lower
OL:
Low
Risk & Low ROE
Technology
A: High
OL,
High
Risk & High
ROE.
Risk
B
Higher
WACC
Risk
A
Expected
ROE
Expected
ROE
=
<ROE>B
=
<ROE>A
Return
on Equity ( ROE)%
On
the Y-axis we have the probability and on
X-axis the ROE. There are
two probability
distributions.
One on the left side is tall
sharp peak probability distribution
that represents technology
B
with
lower Operating Leverage. It
has lower risk and lower
average ROE. Other on the right
side is
short
and flatter that represents
technology A with higher OL.
It has high risk and higher
average ROE.
It
also has higher WACC as it
has higher required rate of
return. Recall probability
distribution and risk
theory
discussion that risks can be
visualized as width or range of
probability distributions
curves.
Shorter
and flatter curve of A shows
higher risk. Its average or
mean ROE to that of right of B,
shows
higher
ROE of A.
Now
we come to the other component of a firm
risk i.e. financial
risk.
Financial
Risk:
·
Created when Firm
takes Loan or Debt or issues
Bonds this is Financial
Leverage
FL
= Debt / Total Assets
·
Increase in Risk faced by Common
Stock Holders (or Equity
Holders or Owners) when a
Firm
takes
on more Debt or Financial
Leverage.
·
Increase in debt shifts more
risk on common stock holders and risk per
share increases.
·
Example:
Suppose
a Firm ABC has Total
Assets of Rs.1000 and is 100%
Equity based (i.e.
Un-levered).
There were 10 equal Owners and 5 of them
want to leave. So the Firm
takes a
Bank
Loan of Rs.500 (at 10%pa
Mark-up) and pays back the Equity
Capital to the 5 Owners
135

Financial
Management MGT201
VU
who
are leaving. Now, half of
the Equity Capital has been
replaced with a Loan from a
Bank
(i.e.
Debt). What impact does
this have on ROE?
·
Assuming Business Risk is
unchanged, and then risk per share
rises because Equity is
halved.
So,
more Risk is transferred to Common
Shareholders.
·
Debt
Investors (i.e.
Lenders and Bond Holders) face
minimal risk because
(1)
Guaranteed Regular Interest Income
and
(2)
1st Claim on Assets in event
of Bankruptcy
Financial
Leverage (Debt) Increases
ROE Risk:
FL
is the degree or extent to which a
company's total capital is
composed of debt. So a company
with
80%
debt is highly leveraged.
Let us take an example of a company
moving from 100% equity to
50%
equity
and 50% debt to see Impact
of Financial Leverage (Loan) on Balance
Sheet.
Impact
of Financial Leverage (Loan) on
Balance Sheet
Un-Levered
Firm
Levered
Firm
(100%
Equity)
(50%
Equity - 50%
Debt)
Liabilities
Assets
Liabilities
Assets
Debt:
500
Equity:
1000
Equity:
500
Total:
1000
Total:
1000
Total:
100
Total:
1000
Note:
Total Assets = Total
Liabilities = Debt + Equity
This
table shows the capital structure of the
firm under the conditions of
leverage and no leverage.
Under
no leverage its Assets=Equity=1000.
But after leverage it has
500 as debt and 500 as
equity. It
has
converted 500 of equity into
debt by taking loan.
·
Increase in Debt increases
chances of net loss if seasonal
dip causes EBIT to fall
below interest
payment.
·
Increase in Debt increases
uncertainty in ROE. Range or Spread of
Possible future values of
ROE
increases. Risk faced by Common Stock
Holders Increases.
This
can be illustrated by the following
example:
Impact
of Financial Leverage (Loan) on
Income Statement & ROE
Un-Levered
Levered
(100%
Equity)
(50%
Equity)
Expected
EBIT
300
300
Interest
(10% of 500)
0
50
EBT
300
250
Tax
(30% of EBIT)
90
75
Net
Income (NI)
210
175
Expected
ROE (=NI/Equity)
210/1000=
21%
175/500=35%
Total
Return
210
175+50=225
·
Increase
in Debt Improved or Leveraged Up the ROE
to 35%
·
Increase
in Debt also Increased the Total
Return to Investors = NI + Interest.
Increased from
Rs.210
to 225 (175+50)
·
So,
why not keep adding more Debt?
Because, Debt has increased
the risk i.e. The
Standard
Deviation
or Uncertainty of ROE.
·
Total
Stand Alone Risk of Firm =
Business Risk + Financial
Risk
Total Stand Alone Risk
= Standard Deviation of ROE of Levered
Firm
Business Risk = Standard Deviation
of ROE for Un-levered
Firm
Financial
Leverage (FL) & Operating
Leverage (OL):
Effect
of Financial Leverage & Operating
Leverage on ROE is Similar:
136
Financial
Management MGT201
VU
High
Operating Leverage: High
Fixed Costs so small changes
in Quantity Sold cause
larger
changes
in Net Income & ROE
·
Risky
if Firm's Sales < Breakeven
Point BUT
·
Multiplies
Increase in Mean ROE when
Sales > Breakeven
High Financial Leverage:
High Debt & Interest
Payments so small changes in
EBIT cause large
changes
in Net Income & ROE
·
Risky
if Firm's Overall Return is
low and can not
pay Interest on time
but
·
Multiplies
Increase in Mean ROE and Total
Return (to Equity & Debt
Holders) when
Firm's
Overall Return is Higher
than Cost of Debt
The
impact of leverage debt on ROE
can be visualized in a graph.
For this purpose we need
to
consider
the following table:
EBIT
Interest
EBT
Tax
Net
Income ROE
(Rs.50)
(30%)
(=NI/Equity)
Un-Levered
600
0
600
180
420
42%
Firm
with
300
0
300
90
210
21%
no
debt or 100%
50
0
50
15
35
3.5%
equity
Levered
firm
600
50
550
165
385
77%
with
debt
300
50
250
75
175
35%
50
50
0
0
0
0%
You
see for a levered firm range
of ROE is high from 0 to 77%
for level of earnings from 50
to
600.
For un levered firm this
range is very short from 3.5% to
42% for same level of
earnings. So for a
company
whose sales are low un
levered capital structure is safer
than a levered one while for
a
company
with healthy sales growth,
levered capital structure provides an
opportunity of high ROE.
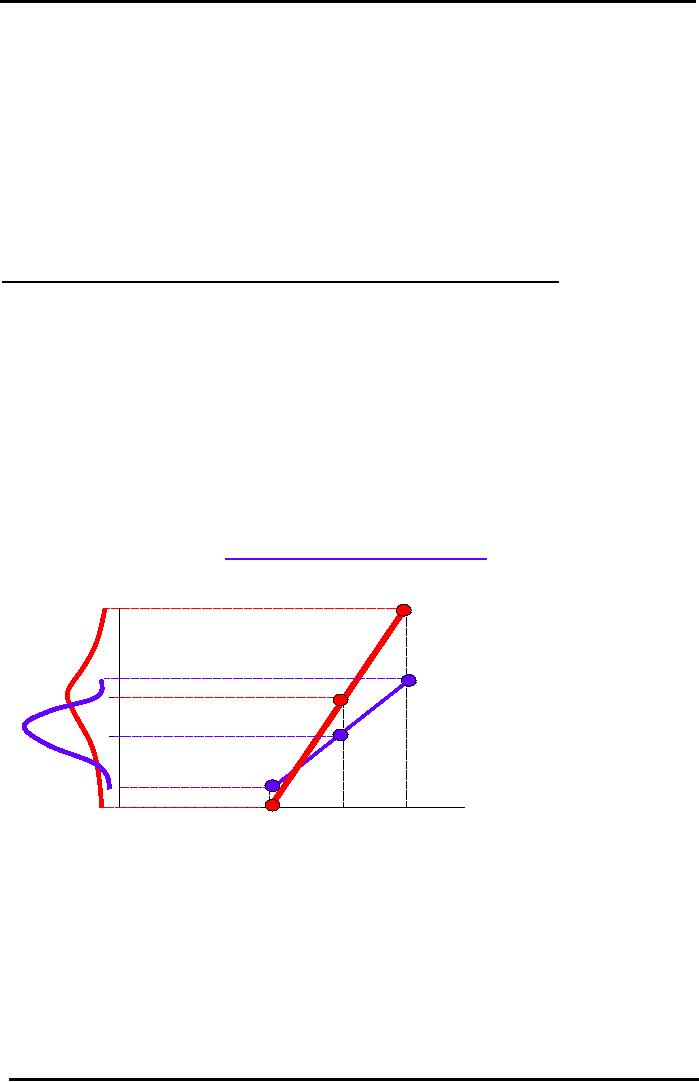
Visualizing
Financial Leverage (FL)
Impact
on ROE & Capital Structure
LEVERED
(Debt
ROE
(%)
&
Equity) Firm:
77%
Higher
Slope.
ROE
more
sensitive
to
changes
in EBIT
42%
35%
= <ROE>L
UN-LEVERED
(100%
Equity)
21%
= <ROE>UL
Firm.
Safer
Capital
Structure
3.5%
at
Low EBIT's
0%
EBIT
(Rs)
50
300
600
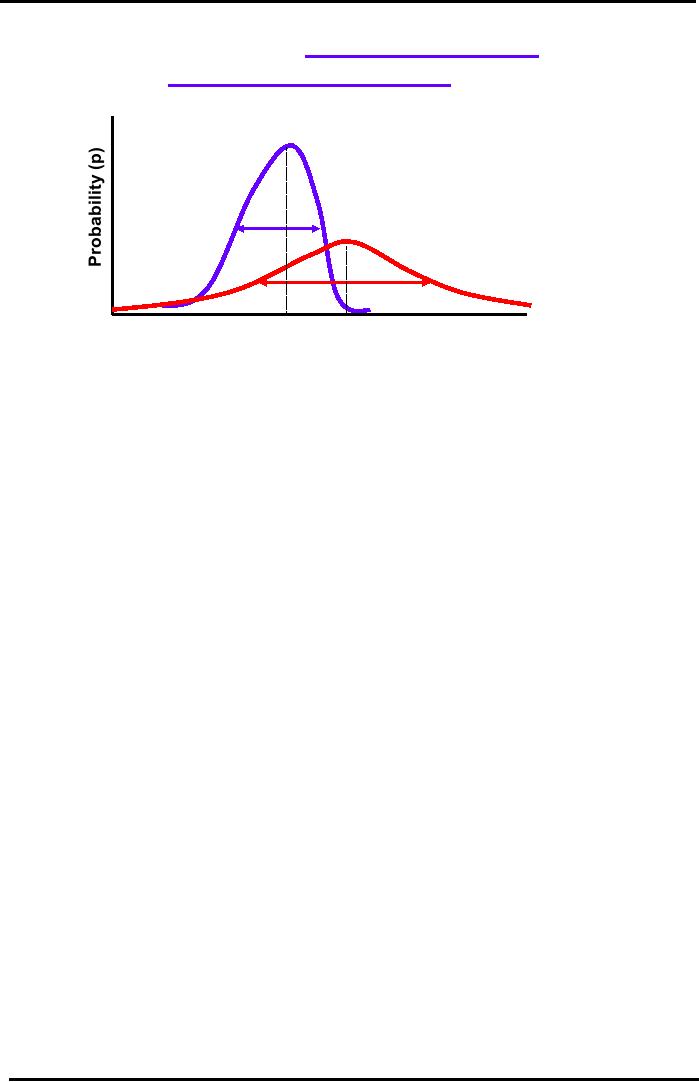
The
impact of leverage debt on ROE
can also be shown in a graph
based on probability
distributions:
137
Financial
Management MGT201
VU
Visualizing
Impact of Financial Leverage
on
ROE & Capital Structure
Un-Levered
(100% Equity):
Lower
ROE and Lower Risk.
Levered
(Debt & Equity):
Higher
ROE but Higher
Risk
Risk
also.
Risk
Expected
ROE
Expected
ROE
<ROE>Un-Levered
<ROE>Levered =
35%
=
21%
Return
on Equity ( ROE)%
On
the Y-axis we have the probability and on
X-axis the ROE. There are
two probability
distributions.
One on the left side is tall
sharp peak probability distribution
that represents un
levered
firm.
It has lower risk and
lower average ROE. Other on the
right side is short and flatter
that represents
levered
firm with higher OL. It
has high risk and
higher average ROE. Recall
probability distribution
and
risk theory discussion that
risks can be visualized as width or range
of probability distributions
curves.
We shall discuss these
graphs and financial leverage in
detail in next
lecture.
138
Table of Contents:
- INTRODUCTION TO FINANCIAL MANAGEMENT:Corporate Financing & Capital Structure,
- OBJECTIVES OF FINANCIAL MANAGEMENT, FINANCIAL ASSETS AND FINANCIAL MARKETS:Real Assets, Bond
- ANALYSIS OF FINANCIAL STATEMENTS:Basic Financial Statements, Profit & Loss account or Income Statement
- TIME VALUE OF MONEY:Discounting & Net Present Value (NPV), Interest Theory
- FINANCIAL FORECASTING AND FINANCIAL PLANNING:Planning Documents, Drawback of Percent of Sales Method
- PRESENT VALUE AND DISCOUNTING:Interest Rates for Discounting Calculations
- DISCOUNTING CASH FLOW ANALYSIS, ANNUITIES AND PERPETUITIES:Multiple Compounding
- CAPITAL BUDGETING AND CAPITAL BUDGETING TECHNIQUES:Techniques of capital budgeting, Pay back period
- NET PRESENT VALUE (NPV) AND INTERNAL RATE OF RETURN (IRR):RANKING TWO DIFFERENT INVESTMENTS
- PROJECT CASH FLOWS, PROJECT TIMING, COMPARING PROJECTS, AND MODIFIED INTERNAL RATE OF RETURN (MIRR)
- SOME SPECIAL AREAS OF CAPITAL BUDGETING:SOME SPECIAL AREAS OF CAPITAL BUDGETING, SOME SPECIAL AREAS OF CAPITAL BUDGETING
- CAPITAL RATIONING AND INTERPRETATION OF IRR AND NPV WITH LIMITED CAPITAL.:Types of Problems in Capital Rationing
- BONDS AND CLASSIFICATION OF BONDS:Textile Weaving Factory Case Study, Characteristics of bonds, Convertible Bonds
- BONDS VALUATION:Long Bond - Risk Theory, Bond Portfolio Theory, Interest Rate Tradeoff
- BONDS VALUATION AND YIELD ON BONDS:Present Value formula for the bond
- INTRODUCTION TO STOCKS AND STOCK VALUATION:Share Concept, Finite Investment
- COMMON STOCK PRICING AND DIVIDEND GROWTH MODELS:Preferred Stock, Perpetual Investment
- COMMON STOCKS RATE OF RETURN AND EPS PRICING MODEL:Earnings per Share (EPS) Pricing Model
- INTRODUCTION TO RISK, RISK AND RETURN FOR A SINGLE STOCK INVESTMENT:Diversifiable Risk, Diversification
- RISK FOR A SINGLE STOCK INVESTMENT, PROBABILITY GRAPHS AND COEFFICIENT OF VARIATION
- 2- STOCK PORTFOLIO THEORY, RISK AND EXPECTED RETURN:Diversification, Definition of Terms
- PORTFOLIO RISK ANALYSIS AND EFFICIENT PORTFOLIO MAPS
- EFFICIENT PORTFOLIOS, MARKET RISK AND CAPITAL MARKET LINE (CML):Market Risk & Portfolio Theory
- STOCK BETA, PORTFOLIO BETA AND INTRODUCTION TO SECURITY MARKET LINE:MARKET, Calculating Portfolio Beta
- STOCK BETAS &RISK, SML& RETURN AND STOCK PRICES IN EFFICIENT MARKS:Interpretation of Result
- SML GRAPH AND CAPITAL ASSET PRICING MODEL:NPV Calculations & Capital Budgeting
- RISK AND PORTFOLIO THEORY, CAPM, CRITICISM OF CAPM AND APPLICATION OF RISK THEORY:Think Out of the Box
- INTRODUCTION TO DEBT, EFFICIENT MARKETS AND COST OF CAPITAL:Real Assets Markets, Debt vs. Equity
- WEIGHTED AVERAGE COST OF CAPITAL (WACC):Summary of Formulas
- BUSINESS RISK FACED BY FIRM, OPERATING LEVERAGE, BREAK EVEN POINT& RETURN ON EQUITY
- OPERATING LEVERAGE, FINANCIAL LEVERAGE, ROE, BREAK EVEN POINT AND BUSINESS RISK
- FINANCIAL LEVERAGE AND CAPITAL STRUCTURE:Capital Structure Theory
- MODIFICATIONS IN MILLAR MODIGLIANI CAPITAL STRUCTURE THEORY:Modified MM - With Bankruptcy Cost
- APPLICATION OF MILLER MODIGLIANI AND OTHER CAPITAL STRUCTURE THEORIES:Problem of the theory
- NET INCOME AND TAX SHIELD APPROACHES TO WACC:Traditionalists -Real Markets Example
- MANAGEMENT OF CAPITAL STRUCTURE:Practical Capital Structure Management
- DIVIDEND PAYOUT:Other Factors Affecting Dividend Policy, Residual Dividend Model
- APPLICATION OF RESIDUAL DIVIDEND MODEL:Dividend Payout Procedure, Dividend Schemes for Optimizing Share Price
- WORKING CAPITAL MANAGEMENT:Impact of working capital on Firm Value, Monthly Cash Budget
- CASH MANAGEMENT AND WORKING CAPITAL FINANCING:Inventory Management, Accounts Receivables Management:
- SHORT TERM FINANCING, LONG TERM FINANCING AND LEASE FINANCING:
- LEASE FINANCING AND TYPES OF LEASE FINANCING:Sale & Lease-Back, Lease Analyses & Calculations
- MERGERS AND ACQUISITIONS:Leveraged Buy-Outs (LBOs), Mergers - Good or Bad?
- INTERNATIONAL FINANCE (MULTINATIONAL FINANCE):Major Issues Faced by Multinationals
- FINAL REVIEW OF ENTIRE COURSE ON FINANCIAL MANAGEMENT:Financial Statements and Ratios