 |

Financial
Management MGT201
VU
Lesson
09
NET
PRESENT VALUE (NPV) AND INTERNAL RATE OF
RETURN (IRR)
Learning
Objective:
In
this lecture, we will
discuss in detail the previous
lecture topics that
are
·
Net
Present value
(NPV)
·
Internal
Rate of Return (IRR)
Net
Present value
(NPV):
The
most important skill in this
course is to understand the NPV equation
and to calculate NPV
as
reliably as possible. It is also the most
important criteria in capital
budgeting. It is very difficult
to
calculate
because different inputs
used in Net present value
equation are based upon a
forecast, which
may
or may not be accurate e.g.
future cash flows and
sales. Similarly, when we
talk about the life
of
the
project, again we are
estimating the duration of the project.
We also have to choose subjectively
the
discount
rates to be used, including
cost of capital, opportunity
cost & required rate of return in
the
calculation
of Net present value. We
will discuss how to choose
the interest rate when we would
talk
about
risk. In NPV the idea is to
bring back each cash flow to
the present and then to add
or subtract
them
on present time. The project
or investment, which is offering the
highest NPV, gets the
highest
rank.
Formula:
NPV
= -Io + CFt /
(1+i)t
= -Io +
CF1/(1+i) + CF2/(1+i) 2 +
CF` /(1+i) 3
+..
Importance
of NPV in terms of objectives of
Financial Management:
The
objective of FM is to maximize the
shareholders wealth. Now, there is a
direct link between
shareholder
wealth maximization & NPV. It is
mentioned earlier that the
value of an asset is
determined
by
the future cash flows it
generates. We used these
future cash flows &
discount them to present
and
we
call that the NPV. Hence,
there is a direct link between NPV and
future cash flows.
When
the management of the company invest in the
+ve NPV projects, they
increase the economic
value
added (E.V.A) and they
also increase market value
added (M.V.A). It should be clear by
now that
when
company invest in +ve NPV projects
they brings in value to the
company. Increase in the value
of
the
company implies increase in shareholders'
wealth.
Example:
Let
us suppose that you invest
Rs 100,000 in a Savings Certificate.
After 1 Year you
will
receive
a coupon payment (or profit)
of Rs 12,000 and you also
reclaim your initial
investment
(principal).
Solution:
Step
1: Identify the Variables: Io = Rs
100,000 CF1=Rs 12,000 Life =
n=1year Required Rate
of
Return = i =10% (assumed),
Annual compounding. CF I1 = Rs
100,000
Here,
we assume that i=10 because
which is the opportunity cost as
you can place that money
in
a
bank and can earn 10%. Do
not forget that you get back
your principal investment
after 1 Year. This
is
a positive cash flow and
must be discounted back to the present
just like any other
future cash flow).
Step
2: Solve the NPV
Equation
NPV
=
-Io
+
CF1 /
(1+ i) +
CF
I1 / (1+ i)
=
-100,000 + 12,000/ (1+0.10) +
100,000/ (1+0.10)
=
-100,000 +
10,909
+
90,909
=
+ Rs 1,818 NPV positive so
investment acceptable
NOTE:
PV = NPV + Io =
1,818 + 100,000 = Rs
101,818
45

Financial
Management MGT201
VU
NPV
Cash Flow Diagram
Savings
Certificate Example
CFI1
= Rs
100,000
Rs
90,909
Rs
10,909
CF1=
Rs
NPV
=
12,000
i
= 10%
Rs.1,818
Yr
0 (Today)
Yr
1
Io
= Rs 100,000
In
diagram initial downward
sloping arrow shows the cash
out flow and after
one year two
upward
pointing arrows (1. profit
2.return of initial investment) show the
cash inflows.
Now
let us talk about the
Internal Rate of Return or
IRR.
Internal
Rate of Return or IRR:
IRR
is a very commonly used
criterion for capital
budgeting. It is popular with the
managers
because
it gives a very simple
answer in the form of annual
percentage and you can
compare it to the
inflation
rate, cost of capital or financing or to
the certain financial accounting
ratios. The formula
uses
trial
& error method. We talk
about the interpretation of IRR in the
coming lectures.
The
formula is similar to
NPV
CFt /
(1+IRR)t
= -Io +
CF1/(1+IRR) + CF2/(1+IRR) 2 +
..
NPV
= 0 = -Io +
The
value of i where NPV is zero is the
value of IRR.
IRR
represents the Break-even Return on
Investment, but the important
thing to remember is the
difference
between IRR & NPV. When
you are ranking different
projects the ranking you get from
NPV
may
be different from the ranking
you get from IRR, because,
there is a major difference of
interpretation
of i between NPV and IRR.
The
difference is that in the case of
NPV; we are externally
specifying the discount rate
based
on
required rate of return. In NPV
calculations, you have an idea of
your opportunity cost for
the capital
&
you use it as `i'. As
mentioned earlier that rate
given by the banks on account is
considered as
opportunity
cost of your capital &
you will invest in any
project, which earns more
than the rate offered
by
a bank. However, in IRR
i
is
derived from the cash flow
pattern of the project. Remember
that in
IRR
project, we do not externally
specify the interest rate but we calculated it
from the cash flows.
Therefore,
in the IRR it is what you
called forecasted rate of return or an
intrinsic rate of return. This
is
an
important difference to keep in mind
between NPV & IRR.
Example:
Consider
the Same Savings Certificate example
for IRR calculation. The
only difference is
that
this
time, we will not assume
any value for "i" as we had
done in the NPV calculation.
We
set the NPV = 0 and solve the
equation for "i"
(or IRR).
NPV
= 0 = -Io
+
[CF1 / (1+IRR)] + [CFI1 /
(1+IRR)]
We
add Rs 12,000 & Rs 10,000 as both
appearing at the same
time.
0
= -100,000 +
[(CF1 +
CFI1) /
(1+IRR)]
0
= -100,000 +
[(12,000+100,000)
/ (1+IRR)]
IRR=
(112,000 / 100,000) - 1
(No
need for trial & error
because you have one variable & one
unknown)
=
1.12 - 1.00 = 0.12 = 12 % per
annum
Is
that a good IRR, a high
IRR or low IRR? These
things we will discuss in
this & in the next
lecture.
Now, one very important
thing, which you need to
consider when you are
evaluating an
investment
proposal, is to look at NPV & to
see how it changes as you
change the discount rate
.This is
known
as NPV Profile (See Fig.).
Logically, when you increase
the discount rate, the denominator
46
Financial
Management MGT201
VU
becomes
larger & you net present
value becomes smaller. What
you find as a result is a
downward
sloping
line. The point where the
NPV is zero would be the IRR
for the project.
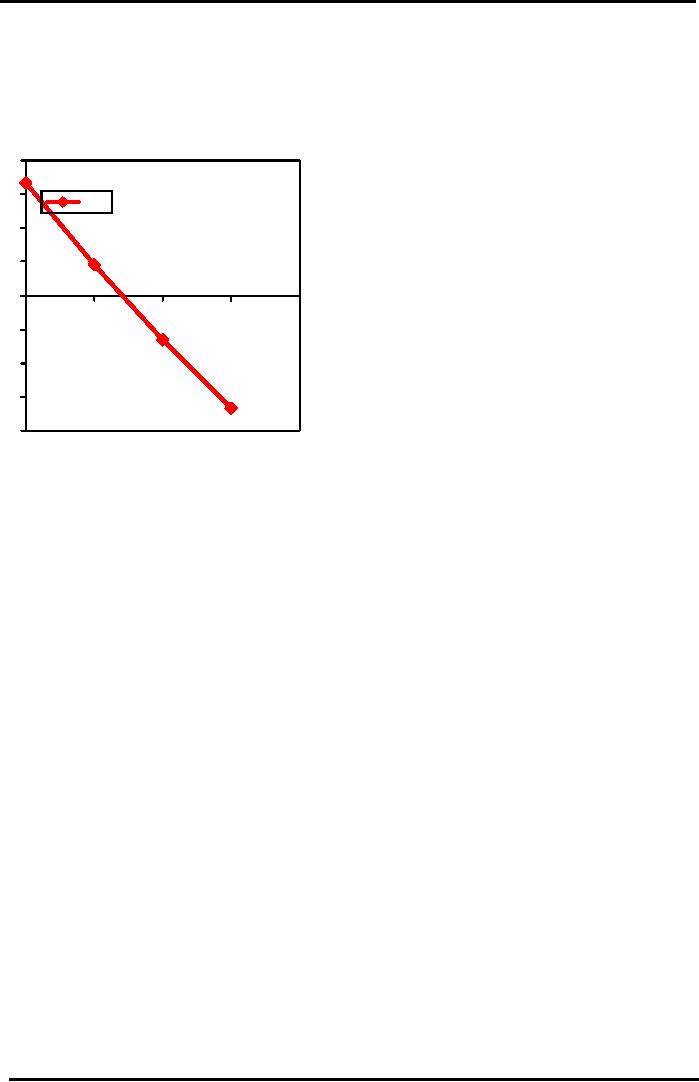
Graphical
IRR
Estimation
Using
"NPV PROFILE"
8000
6000
NPV
4000
2000
IRR=12%
0
i=10%
i=15%
i=20%
-2000=5%
i
-4000
-6000
-8000
Using
a low and a high value for
"i", plot two points on the
graph and extend the NPV
line. Where the
line
cuts the horizontal x-axis
would be reflect the value of the
IRR.
Use
this Graphical Technique
when:
1.
The investment or project
life is longer than 2
years.
2.
Graphical technique very
useful in IRR calculations as there
are polynomial equations that
are
time
consuming to solve algebraically in terms
of "i".
3.
Comparing the NPV's of 2 or more investments, to
study how sensitive the NPV's of
the
different
investments are to the discount rate
"i"
The
next issue is the ranking of
different projects, which means
given a choice of more than one
investment,
which project is the best to
invest in.
RANKING TWO DIFFERENT
INVESTMENTS:
Which
Investment is better?
Let
us rank two Mutually
Exclusive & Independent Investments
using NPV and IRR
criteria
Mutually
Exclusive: means
that you can invest in
ONE of the investment choices and
having chosen
one
you cannot choose
another.
Independent:
implies
that the cash flows of the
two investments are not
linked to each other
Example:
Let
us consider two investment opportunities.
One Investment is the Savings Certificate
(which
we
described earlier) and the
second investment is a Bank
Deposit of Rs 100,000 at 10%
interest
compounded
annually for two
years.
NPV
& IRR Numerical
Comparing
the 2 Investments
Since
we have calculated the NPV and IRR
for the Savings Certificate, we would
calculate the
NPV
and IRR only for the Bank
deposit rate.
Bank
Deposit Example
FV
= PV (1+i) n
=
100,000 x (1.10)2 =
121,000
47
Financial
Management MGT201
VU
NPV
= -100,000 + 10,000/ (1.1) +
11,000/ (1.1)2
+
100,000/(1.1)2
=
100,000 + 9,090 + 91,736 = +
Rs
826
IRR:
NPV = 0 = -100,000 + 10,000/
(1+IRR) + 111,000/
(1+IRR)2
... by
trial & error IRR =
10.5%
Compare
the Investment 1 (Savings Certificate) to
Investment 2 (Bank
Deposit):
Bank
Deposit
Savings
Certificate
NPV
(i=10% pa)
+
Rs 1,818
+
Rs 826
IRR
12%
pa
10.5%
pa
Savings
Certificate appears to be a better
investment because it offers
both a higher NPV and a
higher
IRR.
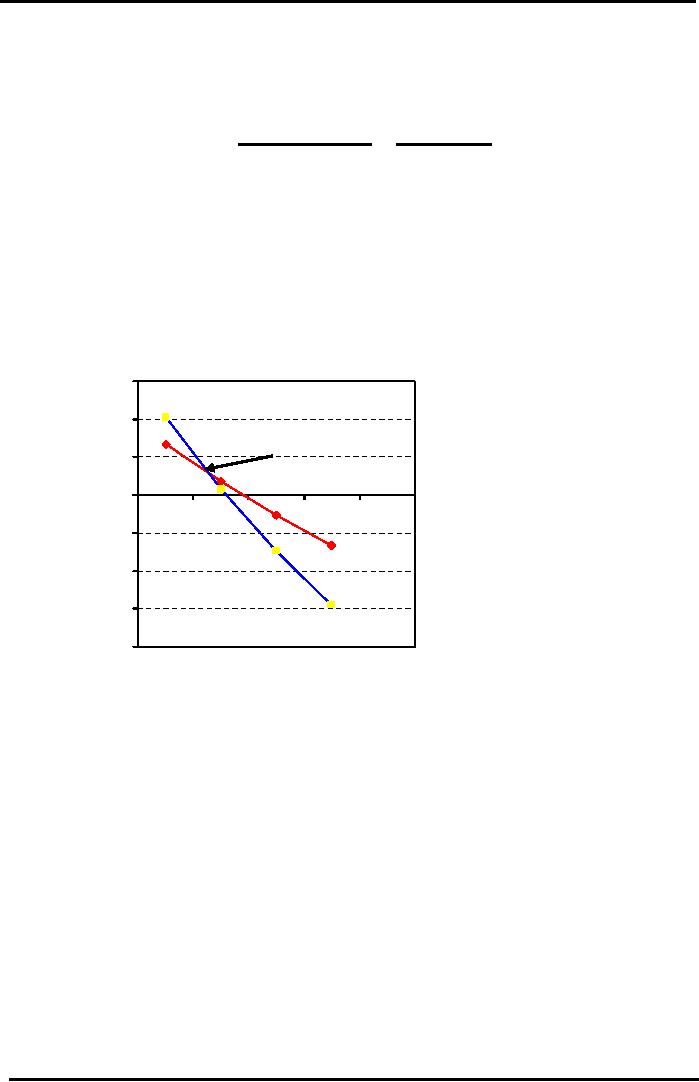
Graphical
Comparison
of
2
Investments
"CROSS-OVER
IRR"
15000
10000
Cross
Over Point
5000
0
i=10%
i=15%
i=20%
-5000
i=5%
-10000
-15000
-20000
The
above diagram shows NPV
Profiles of investments intersect at the Cross
Over Point. Slope
of
Bank Deposit investment is
steeper because larger cash
flows (Rs 111,000) are
taking place later
in
time (2 years instead of 1 year
for Saving Certificates).
Size of the Discounting Factor
grows
exponentially
with time so NPV graph
falls much faster. The
IRR at this Point is
8.8%.
At
this point, the NPV of both
the investments is equal at about +Rs
2,950
When
IRR is less than 8.8%
(Cross-over IRR) then the NPV of
Bank Deposit is
higher!
Investment
Criteria
IRR
Interpretation - How high is
high.
Macro
Aspects
Inflation:
An
IRR, which is considered low
for a medium inflation
country like Pakistan, may
be
considered
high for a low inflation
country like USA, Japan,
and Singapore where inflation is
below
5%.
Risk
Free Rate of Return:
Recall
our discussion from earlier
lecture on Interest Rates and
Money Markets.
In
Pakistan, we use the Government T-Bill
rate, which varies from 7% to 12% per
annum
depending
on the Money Market. Considering the
risk-free rate of return the IRR on
investment is
not
very good. We will talk more
about this after we study
RISK.
48

Financial
Management MGT201
VU
Investment
Criteria
IRR
Interpretation (Micro
Aspects)
ROA
& ROE:
If
the Investor has an existing
running business that
generates cash flows, then
any new project
that
matches or exceeds the returns of the
existing business is worth
considering.
Problem:
ROA
& ROE are Financial Accounting Ratios
based on Net Income (not
cash) &
Historical
Cost or Book Value (not
market value) whereas IRR is
based on Cash and Forecasted
Market
Value.
The financial ratios are
calculated based on the profit
reported in the income statement,
whereas
the
IRR takes into account the
cash flows rather than the
accounting profit in the
calculations.
Weighted
Average Cost of Capital
(WACC) or Hurdle
Rate:
If
the Investors an existing operating
business that runs on
borrowed money (or
financing)
then
the Investor (the borrower)
bears the cost of interest, say
18% pa in Pakistan. Obviously, the rate
of
cash
generation should exceed the rate of
interest payment. The IRR of a new
project should exceed
the
WACC.
We will discuss this in
detail when we study Capital
Structuring. When IRR is above
the
WACC,
the excess return represents surplus
that increases shareholders' wealth.
The details on WACC
would
be further discussed in Capital Structure
determination.
49
Table of Contents:
- INTRODUCTION TO FINANCIAL MANAGEMENT:Corporate Financing & Capital Structure,
- OBJECTIVES OF FINANCIAL MANAGEMENT, FINANCIAL ASSETS AND FINANCIAL MARKETS:Real Assets, Bond
- ANALYSIS OF FINANCIAL STATEMENTS:Basic Financial Statements, Profit & Loss account or Income Statement
- TIME VALUE OF MONEY:Discounting & Net Present Value (NPV), Interest Theory
- FINANCIAL FORECASTING AND FINANCIAL PLANNING:Planning Documents, Drawback of Percent of Sales Method
- PRESENT VALUE AND DISCOUNTING:Interest Rates for Discounting Calculations
- DISCOUNTING CASH FLOW ANALYSIS, ANNUITIES AND PERPETUITIES:Multiple Compounding
- CAPITAL BUDGETING AND CAPITAL BUDGETING TECHNIQUES:Techniques of capital budgeting, Pay back period
- NET PRESENT VALUE (NPV) AND INTERNAL RATE OF RETURN (IRR):RANKING TWO DIFFERENT INVESTMENTS
- PROJECT CASH FLOWS, PROJECT TIMING, COMPARING PROJECTS, AND MODIFIED INTERNAL RATE OF RETURN (MIRR)
- SOME SPECIAL AREAS OF CAPITAL BUDGETING:SOME SPECIAL AREAS OF CAPITAL BUDGETING, SOME SPECIAL AREAS OF CAPITAL BUDGETING
- CAPITAL RATIONING AND INTERPRETATION OF IRR AND NPV WITH LIMITED CAPITAL.:Types of Problems in Capital Rationing
- BONDS AND CLASSIFICATION OF BONDS:Textile Weaving Factory Case Study, Characteristics of bonds, Convertible Bonds
- BONDS VALUATION:Long Bond - Risk Theory, Bond Portfolio Theory, Interest Rate Tradeoff
- BONDS VALUATION AND YIELD ON BONDS:Present Value formula for the bond
- INTRODUCTION TO STOCKS AND STOCK VALUATION:Share Concept, Finite Investment
- COMMON STOCK PRICING AND DIVIDEND GROWTH MODELS:Preferred Stock, Perpetual Investment
- COMMON STOCKS RATE OF RETURN AND EPS PRICING MODEL:Earnings per Share (EPS) Pricing Model
- INTRODUCTION TO RISK, RISK AND RETURN FOR A SINGLE STOCK INVESTMENT:Diversifiable Risk, Diversification
- RISK FOR A SINGLE STOCK INVESTMENT, PROBABILITY GRAPHS AND COEFFICIENT OF VARIATION
- 2- STOCK PORTFOLIO THEORY, RISK AND EXPECTED RETURN:Diversification, Definition of Terms
- PORTFOLIO RISK ANALYSIS AND EFFICIENT PORTFOLIO MAPS
- EFFICIENT PORTFOLIOS, MARKET RISK AND CAPITAL MARKET LINE (CML):Market Risk & Portfolio Theory
- STOCK BETA, PORTFOLIO BETA AND INTRODUCTION TO SECURITY MARKET LINE:MARKET, Calculating Portfolio Beta
- STOCK BETAS &RISK, SML& RETURN AND STOCK PRICES IN EFFICIENT MARKS:Interpretation of Result
- SML GRAPH AND CAPITAL ASSET PRICING MODEL:NPV Calculations & Capital Budgeting
- RISK AND PORTFOLIO THEORY, CAPM, CRITICISM OF CAPM AND APPLICATION OF RISK THEORY:Think Out of the Box
- INTRODUCTION TO DEBT, EFFICIENT MARKETS AND COST OF CAPITAL:Real Assets Markets, Debt vs. Equity
- WEIGHTED AVERAGE COST OF CAPITAL (WACC):Summary of Formulas
- BUSINESS RISK FACED BY FIRM, OPERATING LEVERAGE, BREAK EVEN POINT& RETURN ON EQUITY
- OPERATING LEVERAGE, FINANCIAL LEVERAGE, ROE, BREAK EVEN POINT AND BUSINESS RISK
- FINANCIAL LEVERAGE AND CAPITAL STRUCTURE:Capital Structure Theory
- MODIFICATIONS IN MILLAR MODIGLIANI CAPITAL STRUCTURE THEORY:Modified MM - With Bankruptcy Cost
- APPLICATION OF MILLER MODIGLIANI AND OTHER CAPITAL STRUCTURE THEORIES:Problem of the theory
- NET INCOME AND TAX SHIELD APPROACHES TO WACC:Traditionalists -Real Markets Example
- MANAGEMENT OF CAPITAL STRUCTURE:Practical Capital Structure Management
- DIVIDEND PAYOUT:Other Factors Affecting Dividend Policy, Residual Dividend Model
- APPLICATION OF RESIDUAL DIVIDEND MODEL:Dividend Payout Procedure, Dividend Schemes for Optimizing Share Price
- WORKING CAPITAL MANAGEMENT:Impact of working capital on Firm Value, Monthly Cash Budget
- CASH MANAGEMENT AND WORKING CAPITAL FINANCING:Inventory Management, Accounts Receivables Management:
- SHORT TERM FINANCING, LONG TERM FINANCING AND LEASE FINANCING:
- LEASE FINANCING AND TYPES OF LEASE FINANCING:Sale & Lease-Back, Lease Analyses & Calculations
- MERGERS AND ACQUISITIONS:Leveraged Buy-Outs (LBOs), Mergers - Good or Bad?
- INTERNATIONAL FINANCE (MULTINATIONAL FINANCE):Major Issues Faced by Multinationals
- FINAL REVIEW OF ENTIRE COURSE ON FINANCIAL MANAGEMENT:Financial Statements and Ratios