 |

Financial
Management MGT201
VU
Lesson
19
INTRODUCTION
TO RISK, RISK AND RETURN FOR
A SINGLE STOCK
INVESTMENT
Learning
Objectives:
After
going through this lecture,
you would be able to have an
understanding of the following
topics
·
Introduction
to Risk
·
Risk
and Return for Single
Stock Investment
Before
discussing this important
topic we should go through the
area of finance which we
have
studied
up till now.
Part
I (Introduction and Capital
budgeting)
FM
Markets, Concepts,
Definitions
Review
of Accounting
Interest
Rate Theory &
Calculations
Investment
Decisions: NPV (Valuation), IRR,
Payback
Capital
Budgeting: NPV &
DCF
Capital
Rationing (Budgeting for Real
Assets)
Part
II (Securities Valuation)
Valuation
of Stocks & Bonds (Direct Claim
Securities)
The
Chapter 4 and 5 of text book cover the
topics of risk and return. It is the
fundamental concept to
understand
the topics of portfolio theory and
Capital Asset pricing model
(CAPM).In the previous
lectures,
we are ignoring the origin of
required rate of return.
Risk:
Chinese
Definition of Risk:
It
is defined as the combination of danger and
opportunity. Risk is the combination of
both.
When
we talk about risk with the
reference to the investment we are
talking about risk in term
of the
uncertainty
in outcome of our investment. We are
talking about the variability,
spread, or volatility
that
can
take place in the expected future Value
(Cash Flows) or Returns. For
example, we are
asking
ourselves
if we invest Rs 1,000 for
buying a share today then
what will be the price of the
share one
year
from now. There is no
guarantee about the price of the
share after one year
therefore there is an
uncertainty
or risk we are taking
because we do not know the
final outcome. So, the difference
or
variation
in the possible outcomes of a particular
investment also represents the
risky ness of a
particular
investment.
As
we have studied earlier that there
are two major categories of
assets
1
Real Physical Assets 2 .Financial
Assets (Stock & bonds)
Risk
can be understood with reference to the
uncertainty of Future Cash
Flows produced by
Assets
(Physical & Financial Securities).
Businesses make forecasts based on
certain assumptions
which
we
have discussed in lecture 5 of your
course. These forecasts are
not 100% accurate and there
is
uncertainty
in the possible outcome. The actual cash
flows one or five years from
now may be very
different
from the forecasted and this to
represent risk. When we talk
about risk in investing in
direct
claim
securities then we need to keep in mind
the distinction between Stand Alone
Risk (or Single
Investment
Risk) as oppose to market or
Portfolio Risk (or
Collection of Investments Risk).which is
a
risk
of particular investment compare to
other investments you have made. In
Portfolio risk we are
interested
in overall risk of entire
collection of investments that made by
the company. We will
study
this
topic in the next lectures.
In
case of portfolio risk we
can further made distinction
between Diversifiable Risk and
Market
risk
Diversifiable
Risk: random
risk specific to one company,
can be virtually
eliminated.
Market
Risk: It is
defined as uncertainty caused by
broad movement in market or economy.
More
significant.
Causes
of Risk:
These
can be Company-Specific or General. It
may be because of Cash
Losses from operations
or
poor financial management of the
company. This is one possibility
but the real question is
that why
these
losses occurred. One of the reasons
for the losses might be the
company's Debt,
Inflation,
Economy,
Politics, War or Fate. Final
analysis of risk is that it is a game of
fate or chance.
84

Financial
Management MGT201
VU
Measurement
of Risk:
It
is important to attach different
numbers to the risk so that we
can rank different
investments.
Risk
is measured in terms of the standard
deviation or variance. You have studied
these terms in the
statistics.
Risk is still quite
subjective even after the numbers
you have calculated after
standard
deviation.
The reason is that you have
to keep in mind what kind of
risk you are talking
about. Are you
Stand
Alone Risk or Portfolio
Risk?
Market
Risk or Diversifiable
Risk?
Stock
Price Risk or Earnings Risk?
Another
important thing is Time
Horizon for which you
are measuring the risk. Are
you
investing
in Stocks over 1 Year or
over 30 Years?
The
level of risk might change
as time period of the investment
change.
Fundamental
Rule of Risk & Return:
This
rule can be summed up in
saying that No Pain - No
Gain. Investors will not
take on
additional
Market Risk unless they
expect to receive additional Return
which is common sense and
quite
logical. Most investors are
Risk Averse. Another
important principle that one
should to keep in
mind
is Diversification.
Diversification:
It
states that don't put
all your eggs in one basket.
Diversification can reduce
risk. By
spreading
your money across many
different Investments, Markets,
Industries, Countries you
can avoid
the
weakness of each. Make sure
that they are Uncorrelated
so that they don't suffer
from the same
bad
news.
Due to certain change in the interest
rates some of the investments in your
portfolio may go up
and
the others go downward.
Every
Day Examples of Risk-Return
Pairs:
Risk
Level
Return
·
Climbing Mount K2
High
??
·
Gambling on Cricket
Matches
High
High
·
Oil drilling in Badin
Block
High
High
·
Satta
/
Speculation in Shares
High
Med-High
·
Construction Commercial
Plaza
Medium
High
·
Investing "Blue Chip"
Stocks
Medium
Medium
·
Crossing Road at Peak
Traffic
Medium
??
·
Investing TFC's
Med-Low
Low
·
Depositing Money in Bank
A/c
Low
Low
·
Investing in T-Bills
Low
Low
Before
taking about the risk we
first see the different possible
outcomes of a particular
investment
by
analyzing the expected return. It is
mentioned earlier that once
we have an idea of the variation
then
we
can measure the risk of that
investment.
Range
of Possible Outcomes, Expected
Return:
Overall
Return on Stock = Dividend
Yield + Capital Gains Yield
(Gordon's Formula)
Simply,
Return is proportional to Capital
Gain which is proportional to
Selling Price. We can
use
Forecasted
Selling Price as measure of Return.
The wider the range of Possible
Outcomes that can
occur,
the
greater the Risk
The
chance that a future event
will actually occur is measured
using Probability
Expected
ROR = < r > =
pi
ri
Where
pi represents the Probability of Outcome "i"
taking place and ri represents the Rate
of Return
(ROR)
if Outcome "i" takes place. The
Probability gives weight age
to the return. The Expected or
Most
Likely ROR is the SUM of the weighted returns
for ALL possible Outcomes.
Now
let us take a look of case
of investing in the share of the
particular company.
Suppose
you are deciding whether to
invest in the Stock of Company
ABC. You're not
sure
because
the Future or Forecasted Price of the
Stock after 1 year could
reach any one of 3
Possible
Values
(or Outcomes). Before you
can estimate the most likely
or Mean or Expected Future Price,
you
need
to guess the Probability of Each
Possible Outcome
85
Financial
Management MGT201
VU
Outcomes
(After 1 Yr)
Probability
(%)
"Bull
Market" (Stock Price
P1*=140)
30%
or 0.3
"Normal
Market" (Stock Price
P1*=110)
40%
or 0.4
"Bear
Market" (Stock Price
P1*=80)
30%
or 0.3
100%
1.0
Po=
Present Market Price Rs100.
P1*=Forecasted Price.
The
Sum of Probabilities of all
Possible Outcomes MUST Add
Up to 100% (or 1.0).
Payoff
Table & Expected
ROR
Payoff
Table for Investment in
Stock
Outcomes
(1 Yr)
Prob
(p)
ROR
<r> = (P1*-Po)/Po)
Price
Rises (P1*=140)
0.3
+
40 % = (140-100)/100
Price
Same (P1*=110)
0.4
+
10 % = (110-100)/100
Price
Falls (P1*=80)
0.3
-
20 % = (80-100)/100
1.0
Expected
ROR of Investment in Stock
Most
Likely or Weighted Average or
Mean ROR Rate of Return < r
>
Expected
ROR = < r > =
pi
ri.
=
p1 (r1) + p2 (r2) + p3
(r3)
=
0.3(40%) + 0.4(10%) +
0.3(-20%)
=
12% + 4% - 6% = 10%
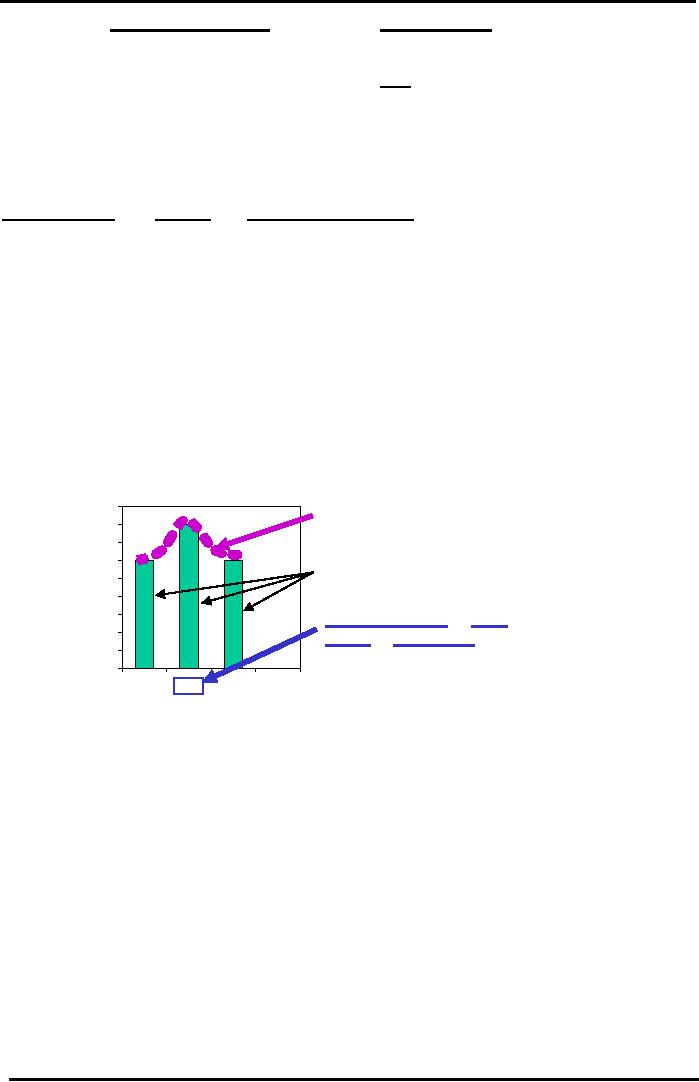
Probability
Distribution
Forecasted
Returns for Single Stock
Investment
"BELL"
0.45
Curve
0.4
Proba
0.35
bility
0.3
(p)
Possible
0.25
Outcomes
0.2
0.15
"Expected
ROR" or Most
0.1
Likely
or Mean ROR =
10%
0.05
0
-20
10
40
Rate
of Return after 1 Year < r
>
In
the diagram, the probability graphed on y
axis and the rate of return is graphed on x
axis. All
three
outcomes are shown in the form of the
bars. In this diagram the largest
probability takes place at
the
value of the expected rate of return
which is 10%. If the top of
each vertical bar is connected
then
the
bell curve is formed. It is
easy to calculate the risk after
calculating the expected rate of return.
We
simply
use the formula of standard
deviation to calculate the risk
Stand
Alone Risk of Single Stock
Investment:
The
wider the range of Possible
Outcomes (i.e. the greater the
variability in potential returns)
that
can occur, the greater the
Risk
Risk
Measured using Standard Deviation
(Note: Variance = Standard Deviation
2)
Risk
= Std Dev =
(
r i - < r i > )2 p i . =
Summed
over each possible outcome " i " with
return "r i " and probability of
occurrence "p i ." < r i
>
is the Expected (or weighted average)
Return
This
topic will be discussed in
detail in the next
lecture
86
Table of Contents:
- INTRODUCTION TO FINANCIAL MANAGEMENT:Corporate Financing & Capital Structure,
- OBJECTIVES OF FINANCIAL MANAGEMENT, FINANCIAL ASSETS AND FINANCIAL MARKETS:Real Assets, Bond
- ANALYSIS OF FINANCIAL STATEMENTS:Basic Financial Statements, Profit & Loss account or Income Statement
- TIME VALUE OF MONEY:Discounting & Net Present Value (NPV), Interest Theory
- FINANCIAL FORECASTING AND FINANCIAL PLANNING:Planning Documents, Drawback of Percent of Sales Method
- PRESENT VALUE AND DISCOUNTING:Interest Rates for Discounting Calculations
- DISCOUNTING CASH FLOW ANALYSIS, ANNUITIES AND PERPETUITIES:Multiple Compounding
- CAPITAL BUDGETING AND CAPITAL BUDGETING TECHNIQUES:Techniques of capital budgeting, Pay back period
- NET PRESENT VALUE (NPV) AND INTERNAL RATE OF RETURN (IRR):RANKING TWO DIFFERENT INVESTMENTS
- PROJECT CASH FLOWS, PROJECT TIMING, COMPARING PROJECTS, AND MODIFIED INTERNAL RATE OF RETURN (MIRR)
- SOME SPECIAL AREAS OF CAPITAL BUDGETING:SOME SPECIAL AREAS OF CAPITAL BUDGETING, SOME SPECIAL AREAS OF CAPITAL BUDGETING
- CAPITAL RATIONING AND INTERPRETATION OF IRR AND NPV WITH LIMITED CAPITAL.:Types of Problems in Capital Rationing
- BONDS AND CLASSIFICATION OF BONDS:Textile Weaving Factory Case Study, Characteristics of bonds, Convertible Bonds
- BONDS VALUATION:Long Bond - Risk Theory, Bond Portfolio Theory, Interest Rate Tradeoff
- BONDS VALUATION AND YIELD ON BONDS:Present Value formula for the bond
- INTRODUCTION TO STOCKS AND STOCK VALUATION:Share Concept, Finite Investment
- COMMON STOCK PRICING AND DIVIDEND GROWTH MODELS:Preferred Stock, Perpetual Investment
- COMMON STOCKS RATE OF RETURN AND EPS PRICING MODEL:Earnings per Share (EPS) Pricing Model
- INTRODUCTION TO RISK, RISK AND RETURN FOR A SINGLE STOCK INVESTMENT:Diversifiable Risk, Diversification
- RISK FOR A SINGLE STOCK INVESTMENT, PROBABILITY GRAPHS AND COEFFICIENT OF VARIATION
- 2- STOCK PORTFOLIO THEORY, RISK AND EXPECTED RETURN:Diversification, Definition of Terms
- PORTFOLIO RISK ANALYSIS AND EFFICIENT PORTFOLIO MAPS
- EFFICIENT PORTFOLIOS, MARKET RISK AND CAPITAL MARKET LINE (CML):Market Risk & Portfolio Theory
- STOCK BETA, PORTFOLIO BETA AND INTRODUCTION TO SECURITY MARKET LINE:MARKET, Calculating Portfolio Beta
- STOCK BETAS &RISK, SML& RETURN AND STOCK PRICES IN EFFICIENT MARKS:Interpretation of Result
- SML GRAPH AND CAPITAL ASSET PRICING MODEL:NPV Calculations & Capital Budgeting
- RISK AND PORTFOLIO THEORY, CAPM, CRITICISM OF CAPM AND APPLICATION OF RISK THEORY:Think Out of the Box
- INTRODUCTION TO DEBT, EFFICIENT MARKETS AND COST OF CAPITAL:Real Assets Markets, Debt vs. Equity
- WEIGHTED AVERAGE COST OF CAPITAL (WACC):Summary of Formulas
- BUSINESS RISK FACED BY FIRM, OPERATING LEVERAGE, BREAK EVEN POINT& RETURN ON EQUITY
- OPERATING LEVERAGE, FINANCIAL LEVERAGE, ROE, BREAK EVEN POINT AND BUSINESS RISK
- FINANCIAL LEVERAGE AND CAPITAL STRUCTURE:Capital Structure Theory
- MODIFICATIONS IN MILLAR MODIGLIANI CAPITAL STRUCTURE THEORY:Modified MM - With Bankruptcy Cost
- APPLICATION OF MILLER MODIGLIANI AND OTHER CAPITAL STRUCTURE THEORIES:Problem of the theory
- NET INCOME AND TAX SHIELD APPROACHES TO WACC:Traditionalists -Real Markets Example
- MANAGEMENT OF CAPITAL STRUCTURE:Practical Capital Structure Management
- DIVIDEND PAYOUT:Other Factors Affecting Dividend Policy, Residual Dividend Model
- APPLICATION OF RESIDUAL DIVIDEND MODEL:Dividend Payout Procedure, Dividend Schemes for Optimizing Share Price
- WORKING CAPITAL MANAGEMENT:Impact of working capital on Firm Value, Monthly Cash Budget
- CASH MANAGEMENT AND WORKING CAPITAL FINANCING:Inventory Management, Accounts Receivables Management:
- SHORT TERM FINANCING, LONG TERM FINANCING AND LEASE FINANCING:
- LEASE FINANCING AND TYPES OF LEASE FINANCING:Sale & Lease-Back, Lease Analyses & Calculations
- MERGERS AND ACQUISITIONS:Leveraged Buy-Outs (LBOs), Mergers - Good or Bad?
- INTERNATIONAL FINANCE (MULTINATIONAL FINANCE):Major Issues Faced by Multinationals
- FINAL REVIEW OF ENTIRE COURSE ON FINANCIAL MANAGEMENT:Financial Statements and Ratios