 |
Chapter
1
Introduction
and Definitions
of
Software Best
Practices
As
this book was being
written, the worst recession of
the 21st century
abruptly
started on September 15,
2008, with the bankruptcy
filing of
Lehman
Brothers. All evidence to date indicates
a deep and prolonged
reces-
sion
that may last for
more than a year. In spite
of signs of partial
recovery
in
mid 2009, job losses
continue to rise as do foreclosures and
bankruptcies.
Even
the most optimistic
projections of recovery are
pointing to late 2010,
while
pessimistic projections are
pointing towards 2011 or 2012.
Indeed,
this
recession may cause permanent changes in
the financial industry,
and
it
is unclear when lost jobs
will return. So long as unemployment
rates top
10
percent in many states, the
economy cannot be
healthy.
Software
is not immune to the failing
economy. Many software
compa-
nies
will close, and thousands of layoffs will
occur as companies
contract
and
try to save money.
Historically,
software costs have been a
major component of
corporate
expense.
Software costs have also
been difficult to control, and
have been
heavily
impacted by poor quality,
marginal security, and other
chronic
problems.
Poor
software engineering, which
gave rise to seriously
flawed eco-
nomic
models, helped cause the
recession. As the recession deepens,
it
is
urgent that those concerned
with software engineering take a
hard
look
at fundamental issues: quality,
security, measurement of
results,
and
development best practices.
This book will discuss the
following
topics
that are critical during a
major recession:
Minimizing
harm from layoffs and
downsizing
■
Optimizing
software quality
control
■
Optimizing
software security
control
■
1

2
Chapter
One
Migration
from custom development to
certified reusable
components
■
Substituting
legacy renovation for new
development
■
Measuring
software economic value and
risk
■
Planning
and estimating to reduce
unplanned overruns
■
This
book does not offer
panaceas, but it does
discuss a number of
important
technical areas that need
improvement if software
engineering
is
to become a legitimate term for an
occupation that has been a
craft or
art
form rather than a true
engineering field.
So
long as software applications
are hand-coded on a line-by-line
basis,
"software
engineering" will be a misnomer.
Switching from
custom-
development
to construction from certified
reusable components
has
the
best prospect of making
really significant improvements in
both
software
engineering disciplines and in
software cost
structures.
More
than a dozen excellent books
are in print in 2009 on the
topic
of
software engineering. Readers
might well ask why another
book on
software
engineering is needed. The
main reason can be seen by
consid-
ering
the major cost drivers of
large software applications. As of
2009,
the
results are
distressing.
From
working as an expert witness in
software litigation, and
from
examining
the software engineering
results of more than 600
companies
and
government organizations, the
author has found that
the software
industry
spends more money on finding
bugs and on cancelled
projects
than
on anything else! As of 2009, the 15
major cost drivers of the
soft-
ware
industry in descending order
are shown in Table
1-1.
(Note
that topic #3, "Producing
English words," refers to
the 90 docu-
ments
associated with large software
projects. Many large
software
applications
spend more time and
money creating text
documents than
they
do creating source
code.)
These
15 major cost drivers are
not what they should be
for a true
engineering
field. Ideally, we in the
field should be spending
much more
TABLE
1-1
Major
Cost Drivers for Software
Applications Circa
2009
1.
Finding and fixing
bugs
9.
Project management
10.
Renovation and
migration
2.
Cancelled projects
11.
Innovation (new kinds of
software)
3.
Producing English
words
12.
Litigation for failures and
disasters
4.
Security flaws and
attacks
13.
Training and learning
software
5.
Requirements changes
14.
Avoiding security
flaws
6.
Programming or coding
15.
Assembling reusable
components
7.
Customer support
8.
Meetings and
communication

Introduction
and Definitions of Software Best
Practices
3
money
on innovation and programming,
and much less money on
fixing
bugs,
cancelled projects, and
problems of various kinds,
such as combat-
ing
security flaws. In a true
engineering field, we should
also be able
to
use far greater quantities
of zero-defect reusable components
than
today's
norms.
One
goal of this book is to
place software engineering
excellence and
best
practices on a sound quantitative
basis. If software
engineering
can
become a true engineering
discipline in which successful
projects
outnumber
failures, cost drivers will be
transformed. A goal of this
book
is
to help transform software
cost drivers, hopefully
within ten years, so
that
they follow a pattern
illustrated by Table
1-2.
Under
this revised set of cost
drivers, defect repairs,
failures, and
cancelled
projects drop from the
top of the list to the
bottom. Recovery
from
security attacks would also
shift toward the bottom
due to better
security
controls during
development.
Heading
up the revised list would be
innovation and the
creation
of
new forms of software.
Programming is only in 11th
place, because
a
true engineering discipline
would be able to utilize far
more zero-
defect
reusable components than is
possible in 2009. The
revised list
of
cost drivers shows what
expenditure patterns might
look like if
software
engineering becomes a true
profession instead of a craft
that
uses
only marginal methods that
frequently lead to failure
instead of
to
success.
Since
the software industry is now
more than 60 years old,
renovation,
migration,
and maintenance of legacy
applications would still
remain
near
the top of the list of
cost drivers, even if
software engineering
were
to
become a true engineering
discipline instead of a craft as it is
today.
In
every industry older than 50
years, maintenance and
enhancement
work
are major cost
elements.
That
brings up another purpose of
this book. This book
examines
best
practices for the entire
life cycle of software
applications, from
early
requirements through deployment
and then through
maintenance.
Since
some large applications are
used for 30 years or more,
this book
TABLE
1-2
Revised
Sequence of Cost Drivers
Circa 2019
1.
Innovation (new kinds of
software)
9.
Requirements changes
2.
Renovation and
migration
10.
Producing English
words
3.
Customer support
11.
Programming or coding
4.
Assembling reusable
components
12.
Finding and fixing
bugs
5.
Meetings and
communications
13.
Security flaws and
attacks
6.
Avoiding security
flaws
14.
Cancelled projects
7.
Training and learning
software
15.
Litigation for failures and
disasters
8.
Project management
4
Chapter
One
covers
a very wide range of topics.
It deals not only with
development
best
practices, but also with
deployment best practices,
maintenance
and
renovation best practices,
and, eventually, best
practices for with-
drawal
of applications when they
finally end their useful
lives.
Since
many large projects fail
and are never completed or
delivered
at
all, this book also
deals with best practices
for attempting to
turn
around
and salvage projects that
are in trouble. If the
project's value has
turned
negative so that salvage is
not a viable option, this
book will also
consider
best practices for
termination of flawed
applications.
For
software, the software
personnel in 2009 working on
maintenance
and
enhancements of legacy applications
outnumber the workers
on
new
applications, yet the topics
of maintenance and enhancement
are
underreported
in the software engineering
literature.
In
spite of many excellent
books on software engineering, we
still
need
to improve quality control
and security control in
order to free
up
resources for innovation and
for improved forms of
software appli-
cations.
We also need to pay more
attention to maintenance and
to
enhancements
of legacy applications.
As
of 2009, the software
industry spends more than 50
cents out of
every
dollar expended on software to fix
bugs and deal with
security
flaws
or disasters such as cancelled
projects. Actual innovation
and new
forms
of software get less than 10
cents out of every
dollar.
If
we can professionalize our
development practices, quality
practices,
and
security practices, it is hoped
that disasters, bug repairs,
and secu-
rity
repairs can drop below 15
cents out of every dollar.
If this occurs,
then
the freed-up funds should
allow as much as 40 cents
out of every
dollar
to go to innovative new kinds of
software.
Software
applications of 10,000 function
points (unit of measure
of
the
business functionality an information
system provides) cost
around
$2,000
per function point from
the start of requirements
until delivery.
Of
this cost, more than
$800 per function point will
be spent on finding
and
fixing bugs that probably
should not be there in the
first place. Such
large
applications, if delivered at all,
take between 48 and 60
months.
The
overall costs are far
too high, and the
distribution of those
costs
indicates
very poor engineering
practices.
By
means of better defect
prevention methods and
utilization of zero-
defect
reusable material, we would
greatly improve the economic
posi-
tion
of software engineering if we could
develop 10,000function
point
applications
for less than $500
per function point, and
could spend less
than
$100 per function point on
finding and fixing bugs.
Development
schedules
of between 12 and 18 months
for 10,000 function points
would
also
be valuable, since shorter
schedules allow quicker
responses to
changing
market conditions. These
goals are theoretically
possible
using
state-of-the-art software methods
and practices. But moving
from
Introduction
and Definitions of Software Best
Practices
5
theory
to practical reality will require
major transformation in
quality
control
and also migration from
line-by-line coding to construction
of
applications
from zero-defect standard
components. An open question
is
whether
this transformation can be
accomplished in ten years. It is
not
certain
if ten years are sufficient,
but it is certain that such
profound
changes
won't occur in less than
ten years.
As
of 2009, large software
projects are almost always
over budget,
usually
delivered late, and are
filled with bugs when
they're finally
delivered.
Even worse, as many as 35
percent of large applications
in
the
10,000function point or more
size range will be cancelled
and never
delivered
at all.
Since
cancelled projects are more
expensive than successfully
com-
pleted
projects, the waste
associated with large software
applications
is
enormous. Completed software
applications in the range of
10,000
function
points cost about $2,000
per function point to build.
But can-
celled
projects in the 10,000function
point range cost about
$2,300
per
function point since they
are usually late and
over budget at the
point
of cancellation!
The
software industry has the
highest failure rate of any
so-called
engineering
field. An occupation that
runs late on more than 75
percent
of
projects and cancels as many
as 35 percent of large projects is
not a
true
engineering discipline.
Once
deployed and delivered to
users, software applications in
the
10,000function
point range have annual
maintenance and
enhance-
ment
costs of between $200 and
$400 per function point
per calendar
year.
Of these costs, about 50
percent goes to fixing bugs,
and the other
50
percent goes to enhancements or
adding new features.
Here,
too, cost improvements are
needed. Ideally, defect
repair costs
should
come down to less than
$25 per function point
per year. Use of
maintenance
workbenches and renovation
tools should drop
enhance-
ment
costs down below $75
per function point per
year. A weak link
in
maintenance and enhancement is
that of customer support,
which
remains
highly labor intensive and
generally unsatisfactory.
Testimony
and depositions noted during
litigation in which the
author
worked
as an expert witness revealed
that many software projects
that
end
up in court due to cancellation or
excessive overruns did not
follow
sound
engineering practices. Five
common problems occurred with
can-
celled
or disastrous projects:
Estimates
prior to starting the
project were inaccurate and
exces-
■
sively
optimistic.
Quality
control during the project
was inadequate.
■
Change
control during the project
was inadequate.
■
6
Chapter
One
Tracking
of progress during development
was severely inadequate
or
■
even
misleading.
Problems
were ignored or concealed
rather than dealt with
rapidly
■
and
effectively when they first
were noted.
When
successful projects are
examined after completion
and delivery,
the
differences between success
and failure become clear.
Successful soft-
ware
projects are good at
planning and estimating,
good at quality
control,
good
at change management, good at tracking
progress, and good at
resolv-
ing
problems rather than
ignoring them. Successful
software projects
tend
to
follow sound engineering
practices, but failing
projects don't.
Depositions
and court testimony reveal
more subtle and deeper
issues.
As
of 2009, an increasing amount of
quantitative data can
provide con-
vincing
proof that certain methods
and activities are valuable
and that
others
are harmful. For example,
when schedules start to slip
or run
late,
managers often try to recover by
taking unwise actions such
as
bypassing
inspections or trying to shorten
testing. Such actions
always
backfire
and make the problems
worse. Why don't software
project man-
agers
know that effective quality
control shortens schedules
and that
careless
quality control lengthens
them?
One
reason for making such
mistakes is that although
many books on
software
engineering and quality tell
how to go about effective
quality
control,
they don't provide
quantitative results. In other
words, what
the
software engineering community
needs is not more "how to do
it"
information,
but rather information on
"what will be the results of
using
this
method?" For example,
information such as the
following would be
very
useful:
"A
sample of 50 projects of 10,000
function points was
examined. Those
using
design and code inspections
averaged 36 months in
development
schedules
and achieved 96 percent
defect removal efficiency
levels."
"A
sample of 125 similar
projects of 10,000 function
points that did not
use
design
and code inspections was
examined. Of this sample, 50
were cancelled
without
completion, and the average
schedule for the 75
completed applica-
tions
was 60 months. Defect
removal efficiency averaged
only 83 percent."
There
is a major need to quantify
the results of software
development
methods
and approaches such as Agile
development, waterfall
develop-
ment,
Six Sigma for software,
the Capability Maturity
Model Integrated
(CMMI),
inspections, the Rational
Unified Process (RUP), Team
Software
Process
(TSP), and many more.
This book will attempt to
provide quanti-
tative
information for many common
development methods. Note,
how-
ever,
that hybrid approaches are
also common, such as using
the Team
Software
Process (TSP) in conjunction with
the Capability
Maturity
Introduction
and Definitions of Software Best
Practices
7
Model
Integrated (CMMI). Common
hybrid forms will be discussed,
but
there
are too many variations to
deal with all of
them.
What
Are "Best Practices" and
How
Can
They Be Evaluated?
A
book entitled Software
Engineering Best Practices
should
start by
defining
exactly what is meant by the
phrase "best practice" and
then
explain
where the data came
from in order to include
each practice in
the
set. A book on best
practices should also
provide quantitative
data
that
demonstrates the results of
best practices.
Because
practices vary by application
size and type, evaluating
them
is
difficult. For example, the
Agile methods are quite
effective for proj-
ects
below about 2,500 function
points, but they lose
effectiveness rap-
idly
above 10,000 function
points. Agile has not
yet even been
attempted
for
applications in the 100,000function
point range and may
even be
harmful
at that size.
To
deal with this situation, an
approximate scoring method
has been
developed
that includes both size
and type. Methods are
scored using a
scale
that runs from +10 to
10 using the criteria
shown in Table 1-3.
Both
the approximate impact on
productivity and the
approximate
impact
on quality are included. The
scoring method can be
applied to
specific
ranges such as 1000 function
points or 10,000 function
points.
It
can also be applied to
specific types of software
such as information
technology,
web application, commercial
software, military software,
and
several
others. The scoring method
runs from a maximum of +10
to a
minimum
of 10, as shown in Table
1-3.
The
midpoint or "average" against
which improvements are
measured
are
traditional methods such as
waterfall development performed
by
organizations
either that don't use
the Software Engineering
Institute's
Capability
Maturity Model or that are
at level 1. This fairly
primitive
combination
remains more or less the
most widely used
development
method
even in 2009.
One
important topic needs to be
understood. Quality needs to
be
improved
faster and to a higher level
than productivity in order
for
productivity
to improve at all. The
reason for this is that
finding and
fixing
bugs is overall the most
expensive activity in software
develop-
ment.
Quality leads and
productivity follows. Attempts to
improve pro-
ductivity
without improving quality
first are
ineffective.
For
software engineering, a historically
serious problem has been
that
measurement
practices are so poor that
quantified results are
scarce.
There
are many claims for
tools, languages, and
methodologies that
assert
each
should be viewed as a best
practice. But empirical data on
their
actual
effectiveness in terms of quality or
productivity has been scarce.

8
Chapter
One
TABLE
1-3
Scoring
Ranges for Software Methodologies
and Practices
Score
Productivity
Improvement
Quality
Improvement
10
25%
35%
9
20%
30%
8
17%
25%
7
15%
20%
6
12%
17%
5
10%
15%
4
7%
10%
3
3%
5%
2
1%
2%
1
0%
0%
0
0%
0%
1
0%
0%
2
1%
2%
3
3%
5%
4
7%
10%
5
10%
15%
6
12%
17%
7
15%
20%
8
17%
25%
9
20%
30%
10
25%
35%
This
book attempts a different
approach. To be described as a best
practice,
a
language, tool, or method
needs to be associated with
soft-
ware
projects in the top 15
percent of the applications
measured and
studied
by the author and his
colleagues. To be included in the
set of best
practices,
a specific method or tool
has to demonstrate by using
quan-
titative
data that it improves
schedules, effort, costs,
quality, customer
satisfaction,
or some combination of these
factors. Furthermore,
enough
data
needs to exist to apply the
scoring method shown in
Table 1-3.
This
criterion brings up three
important points:
Point
1: Software
applications vary in size by
many orders of magni-
tude.
Methods that might be ranked
as best practices for small
programs
of
1000 function points may
not be equally effective for
large systems
of
100,000 function points.
Therefore this book and
the scoring method
use
size as a criterion for
judging "best in class"
status.
Introduction
and Definitions of Software Best
Practices
9
Point
2: Software
engineering is not a "one
size fits all" kind of
occu-
pation.
There are many different
forms of software, such as
embedded
applications,
commercial software packages,
information technology
projects,
games, military applications,
outsourced applications,
open
source
applications, and several
others. These various kinds
of software
applications
do not necessarily use the
same languages, tools, or
devel-
opment
methods. Therefore this book
considers the approaches
that
yield
the best results for
each type of software
application.
Point
3: Tools,
languages, and methods are
not equally effective
or
important
for all activities. For
example, a powerful programming
lan-
guage
such as Objective C will obviously
have beneficial effects
on
coding
speed and code quality. But
which programming language
is
used
has no effect on requirements
creep, user documentation, or
proj-
ect
management. Therefore the
phrase "best practice" also
has to iden-
tify
which specific activities
are improved. This is
complicated because
activities
include development, deployment,
and post-deployment
maintenance
and enhancements. Indeed,
for large applications,
devel-
opment
can take up to five years,
installation can take up to
one year,
and
usage can last as long as 25
years before the application
is finally
retired.
Over the course of more
than 30 years, hundreds of
activities
will
occur.
The
result of the preceding
factors is that selecting a
set of best prac-
tices
for software engineering is a
fairly complicated undertaking.
Each
method,
tool, or language needs to be
evaluated in terms of its
effective-
ness
by size, by application type,
and by activity. This book
will discuss
best
practices in a variety of
contexts:
Best
practices by size of the
application
■
Best
practices by type of software
(embedded, web, military,
etc.)
■
Best
practices by activity (development,
deployment, and
mainte-
■
nance)
In
2009, software engineering is
not yet a true profession
with state
certification,
licensing, board examinations,
formal specialties, and
a
solid
body of empirical facts
about technologies and
methods that have
proven
to be effective. There are, of
course, many international
stan-
dards.
Also, various kinds of
certification are possible on a
voluntary
basis.
Currently, neither standards
nor certification have
demonstrated
much
in the way of tangible
improvements in software success
rates.
This
is not to say that
certification or standards have no
value, but
rather
that proving
their
value by quantification of quality
and productiv-
ity
is a difficult task. Several
forms of test certification
seem to result in
higher
levels of defect removal
efficiency than observed
when uncertified
10
Chapter
One
testers
work on similar applications.
Certified function-point
counters
have
been shown experimentally to produce
more accurate results
than
uncertified
counters when counting trial
examples. However, much
better
data
is needed to make a convincing case
that would prove the
value of
certification.
As
to standards, the results
are very ambiguous. No solid
empiri-
cal
data indicates, for example,
that following ISO quality
standards
results
in either lower levels of
potential defects or higher
levels of
defect
removal efficiency. Some of
the security standards seem
to show
improvements
in reduced numbers of security
flaws, but the data
is
sparse
and unverified by controlled
studies.
Multiple
Paths for Software
Development,
Deployment,
and Maintenance
One
purpose of this book is to
illustrate a set of "paths"
that can be fol-
lowed
from the very beginning of a
software project all the
way through
development
and that lead to a
successful delivery. After
delivery, the
paths
will continue to lead through
many years of maintenance
and
enhancements.
Because
many paths are based on
application size and type, a
network
of
possible paths exists. The
key to successful software
engineering is to
find
the specific path that will
yield the best results
for a specific
project.
Some
of the paths will include
Agile development, and some
will include
the
Team Software Process (TSP).
Some paths will include the
Rational
Unified
Process (RUP), and a few
might even include
traditional water-
fall
development methods.
No
matter which specific path
is used, the destination
must include
fundamental
goals for the application to
reach a successful
conclusion:
Project
planning and estimating must
be excellent and
accurate.
■
Quality
control must be
excellent.
■
Change
control must be
excellent.
■
Progress
and cost tracking must be
excellent.
■
Measurement
of results must be excellent
and accurate.
■
Examples
of typical development paths
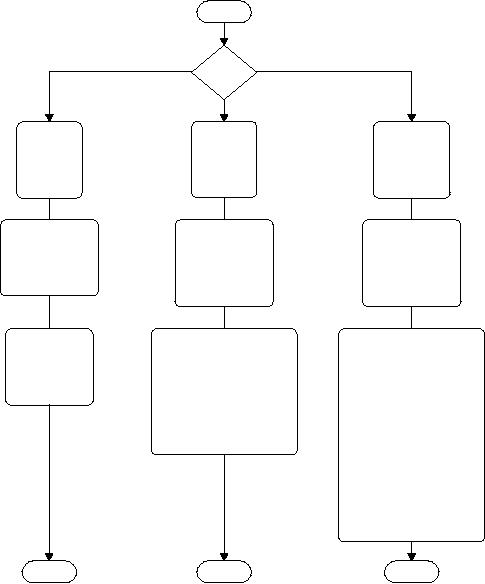
are shown in Figure 1-1.
This
figure
illustrates the development
methods and quality
practices used
for
three different size ranges
of software applications.
To
interpret the paths
illustrated by Figure 1-1,
the Methods boxes
near
the top indicate the
methods that have the
best success rates.
For
example,
at fewer than 1000 function
points, Agile has the
most suc-
cess.
But for larger applications,
the Team Software Process
(TSP) and
Introduction
and Definitions of Software Best
Practices
11
Start
Small
(< 1000 FP)
Large
(> 10,000 FP)
Size
Medium
(100010,000 FP)
Methods
Methods
Methods
1)
TSP/PSP
1)
TSP/PSP
1)
Agile
2)
Agile
2)
CMM 3, 4, 5
2)
TSP/PSP
3)
CMM 3
3)
RUP
3)
Waterfall
4)
RUP
4)
Hybrid
4)
CMM 1, 2
Defect
Prevention
Defect
Prevention
Defect
Prevention
1)
Six Sigma
1)
Six Sigma
1)
Embedded user
2)
QFD
2)
QFD
2)
Scrum
3)
JAD
3)
JAD
3)
JAD
4)
Data mining
4)
Reuse
4)
Reuse
5)
Reuse (certified)
5)
Embedded user
Defect
Removal
Defect
Removal
Defect
Removal
1)
Requirements inspection
1)
Peer review
1)
Code inspection
2)
Design inspection
2)
Unit test
2)
Automated static
analysis
3)
Code inspection
3)
Function test
3)
Unit test
4)
Test plan inspection
4)
Beta test
4)
Function test
5)
SQA review
5)
Regression test
6)
Automated static
analysis
6)
Performance test
7)
Unit test
7)
System test
8)
Function test
8)
Beta test
9)
Regression test
10)
Performance test
11)
Security test
12)
Usability test
13)
SQA test
14)
System test
15)
Beta test
End
End
End
Figure
1-1 Development
practices by size of
application
Personal
Software Process (PSP) have
the greatest success.
However,
all
of the methods in the boxes
have been used for
applications of the
sizes
shown, with reasonable success.
Moving
down, the Defect Prevention
and Defect Removal boxes
show
the
best combinations of reviews,
inspections, and tests. As
you can see,
larger
applications require much
more sophistication and many
more
kinds
of defect removal than small
applications of fewer than
1000
function
points.
12
Chapter
One
Continuing
with the analogy of paths,
there are hundreds of
paths
that
can lead to delays and
disasters, while only a few
paths lead to
successful
outcomes that combine high
quality, short schedules,
and low
costs.
In fact, traversing the
paths of a major software
project resembles
going
through a maze. Most of the
paths will be dead ends. But
examin-
ing
measurement and quantitative
data is like looking at a
maze from
a
tall ladder: they reveal
the paths that lead to
success and show the
paths
that should be
avoided.
Paths
for Software
Deployment
Best
practices are not limited to
development. A major gap in
the lit-
erature
is that of best practices
for installing or deploying
large appli-
cations.
Readers who use only
personal computer software
such as
Windows
Vista, Microsoft Office,
Apple OS X, Intuit Quicken, and
the
like
may wonder why deployment
even matters. For many
applications,
installation
via download, CD, or DVD may
require only a few
minutes.
In
fact, for Software as a
Service (SaaS) applications
such as the Google
word
processing and spreadsheet
applications, downloads do not
even
occur.
These applications are run
on the Google servers and
are not in
the
users' computers at
all.
However,
for large mainframe
applications such as telephone
switch-
ing
systems, large mainframe
operating systems, and
enterprise resource
planning
(ERP) packages, deployment or
installation can take a
year
or
more. This is because the
applications are not just
installed, but
require
substantial customization to match
local business and
techni-
cal
needs.
Also,
training of the users of
large applications is an important
and
time-consuming
activity that might take
several courses and
several
weeks
of class time. In addition,
substantial customized
documentation
may
be created for users,
maintenance personnel, customer
support
personnel,
and other ancillary users.
Best practices for
installation of
large
applications are seldom
covered in the literature,
but they need
to
be considered, too.
Not
only are paths through
software development important,
but also
paths
for delivery of software to
customers, and then paths
for main-
tenance
and enhancements during the
active life of software
applica-
tions.
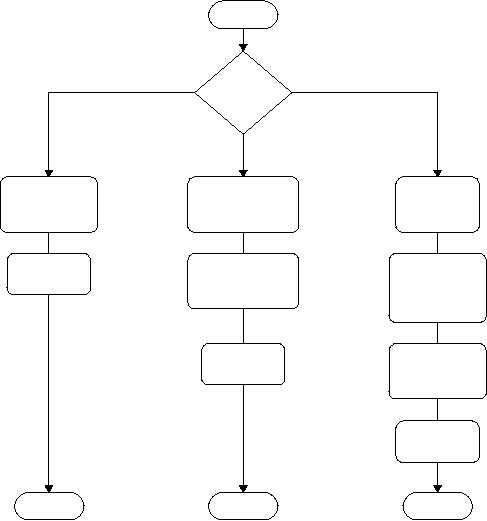
Figure 1-2 shows typical
installation paths for three
very different
situations:
Software as a Service, self-installed
applications, and
those
requiring
consultants and installation
specialists.
Software
as a Service (SaaS) requires no
installation. For
self-installed
applications,
either downloads from the
Web or physical installation
via
CD
or DVD are common and
usually accomplished with moderate
ease.
However,
occasionally there can be
problems, such as the
release of a
Introduction
and Definitions of Software Best
Practices
13
Start
SaaS
Vendor
Install
Install
Method
Self
install
Learn
online
Download
Select
or
or
install
Deployment
from
vendor
from
CD or DVD
Team
Select
classes
Learn
online
Begin
to use
for
users
or
from
software
and
support
vendor
or books
teams
Customize
and
Begin
to use
install
software
application
Begin
to use
software
End
End
End
Deployment
practices by form of
deployment
Figure
1-2
Norton
AntiVirus package that could
not be installed until the
previous
version
was uninstalled. However,
the previous version was so
convo-
luted
that the normal Windows
uninstall procedure could
not remove
it.
Eventually, Symantec had to
provide a special uninstall
tool (which
should
have been done in the
first place).
However,
the really complex
installation procedures are
those associ-
ated
with large mainframe applications
that need customization as
well
as
installation. Some large
applications such as ERP
packages are so
complicated
that sometimes it takes
install teams of 25 consultants
and
25
in-house personnel a year to
complete installation.
Because
usage of these large
applications spans dozens of
different
kinds
of users in various organizations
(accounting, marketing,
customer
14
Chapter
One
support,
manufacturing, etc.), a wide
variety of custom user
manuals
and
custom classes need to be
created.
From
the day large software
packages are delivered until
they are
cut-over
and begin large-scale usage
by all classes of users, as
long as a
year
can go by. Make no mistake:
installation, deployment, and
training
users
of large software applications is
not a trivial
undertaking.
Paths
for Maintenance and
Enhancements
Once
software applications are
installed and start being
used, several
kinds
of changes will occur over
time:
All
software applications have
bugs or defects, and as
these are found,
■
they
will need to be repaired.
As
businesses evolve, new
features and new
requirements will sur-
■
face,
so existing applications must be
updated to keep them
current
with
user needs.
Government
mandates or new laws such as
changes in tax structures
■
must
be implemented as they occur,
sometimes on very short
notice.
As
software ages, structural decay
always occurs, which may
slow
■
down
performance or cause an increase in
bugs or defects.
Therefore
if
the software continues to
have business value, it may
be necessary
to
"renovate" legacy applications.
Renovation
consists
of topics such
as
restructuring or refactoring to lower
complexity, identification
and
removal
of error-prone modules, and
perhaps adding features at
the
same
time. Renovation is a special
form of maintenance that
needs
to
be better covered in the
literature.
After
some years of usage, aging
legacy applications may
outlive
■
their
utility and need
replacement. However, redeveloping an
exist-
ing
application is not the same
as starting a brand-new
application.
Existing
business rules can be
extracted from the code
using data-
mining
techniques, since the
original requirements and
specifications
usually
lag and are not
kept current.
Therefore,
this book will attempt to
show the optimal paths
not only
for
development, but also for
deployment, maintenance, and
enhance-
ments.
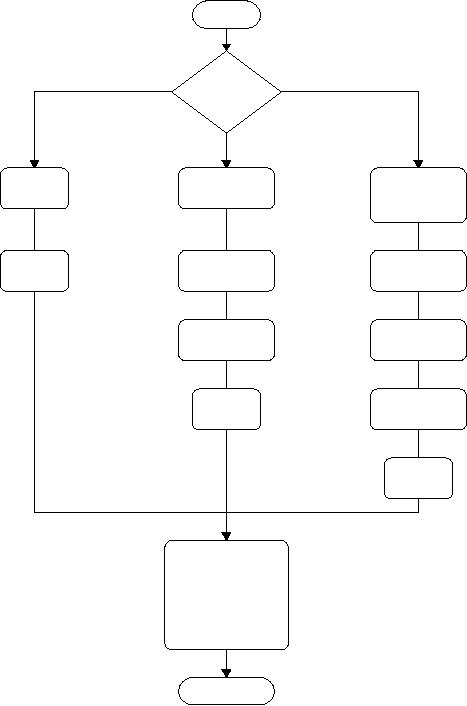
Figure 1-3 illustrates three
of the more common and
important
paths
that are followed during
the maintenance
period.
As
can be seen from Figure 1-3,
maintenance is not a "one
size fits
all"
form of modification. Unfortunately,
the literature on
software
maintenance
is very sparse compared with
the literature on
software
development.
Defect repairs, enhancements,
and renovations are
very
different
kinds of activities and need
different skill sets and
sometimes
different
tools.
Introduction
and Definitions of Software Best
Practices
15
Start
Defect
repair
Renovation
Form
of
changes
Enhancement
Data
mining
Customer
New
user
for
embedded
support
requirements
requirements
Change
Competitive
New
user
team
requirements
requirements
New
mandates
New
mandates
and
laws
and
laws
Change
Competitive
team
requirements
Change
team
1)
Refactoring
2)
Restructuring
3)
Inspection
4)
Static analysis
5)
Regression test
6)
Function test
7)
System test
Release
Major
forms of maintenance and
enhancement
Figure
1-3
16
Chapter
One
Developing
a major application in the
10,000 to 100,000
function-point
size
range is a multiyear undertaking
that can easily last
five years.
Deploying
such an application can take
from 6 months to 12
months.
Once
installed, large software
applications can continue to be
used for
25
years or more. During usage,
enhancements and defect
repairs will
be
continuous. At some point,
renovation or restoring the
application
to
reduce complexity and
perhaps migrate to new file
structures or
new
programming languages might
occur. Therefore, analysis of
best
practices
needs to span at least a
30-year period. Development
alone is
only
a fraction of the total cost
of ownership of major software
applica-
tions.
This book will take a long
view and attempt to
encompass all best
practices
from the first day a
project starts until the
last user signs
off,
perhaps
30 years later.
Quantifying
Software Development,
Deployment,
and Maintenance
This
book will include productivity
benchmarks, quality
benchmarks,
and
data on the effectiveness of a
number of tools, methodologies,
and
programming
practices. It will also include
quantitative data on
the
costs
of training and deployment of
methodologies. The data
itself comes
from
several sources. The largest
amount of data comes from
the author's
own
studies with hundreds of clients
between 1973 and
2009.
Other
key sources of data include
benchmarks gathered by
Software
Productivity
Research LLC (SPR) and data
collected by the
nonprofit
International
Software Benchmarking Standards
Group (ISBSG). In
addition,
selected data will be brought in
from other sources.
Among
these
other sources are the
David Consulting Group, the
Quality/
Productivity
(Q/P) consulting group, and
David Longstreet of
Longstreet
consulting.
Other information sources on
best practices will
include
the
current literature on software
engineering and various
portals into
the
software engineering domain
such as the excellent portal
provided
by
the Information Technology
Metrics and Productivity
Institute
(ITMPI).
Information from the
Software Engineering Institute
(SEI)
will
also be included. Other
professional associations such as
the Project
Management
Institute (PMI) and the
American Society for
Quality
(ASQ)
will be cited, although they do
not publish very much
quantita-
tive
data.
All
of these sources provide
benchmark data primarily
using func-
tion
points as defined by the
International Function Point
Users Group
(IFPUG).
This book uses IFPUG function
points for all quantitative
data
dealing
with quality and
productivity.
There
are several other forms of
function point, including
COSMIC
(Common
Software Measurement International
Consortium) function
Introduction
and Definitions of Software Best
Practices
17
points
and Finnish function points.
While data in these
alternative met-
rics
will not be discussed at length in
this book, citations to
sources of
benchmark
data will be included. Other
metrics such as use case
points,
story
points, and goal-question
metrics will be mentioned and
references
provided.
(It
is not possible to provide
accurate benchmarks using
either lines
of
code
metrics
or cost
per defect metrics.
As will be illustrated later,
both
of
these common metrics violate
the assumptions of standard
econom-
ics,
and both distort historical
data so that real trends
are concealed
rather
than revealed.)
On
the opposite end of the
spectrum from best practices
are worst
practices.
The author has been an
expert witness in a number of
breach-
of-contract
lawsuits where depositions
and trial documents revealed
the
major
failings that constitute
worst practices. These will be
discussed
from
time to time, to demonstrate
the differences between the
best and
worst
practices.
In
between the sets of best
practices and worst
practices are many
methods
and practices that might be
called neutral
practices. These
may
provide
some benefits for certain
kinds of applications, or they
may be
slightly
harmful for others. But in
neither case does use of
the method
cause
much variation in productivity or
quality.
This
book attempts to replace
unsupported claims with empirical
data
derived
from careful measurement of
results. When the software
indus-
try
can measure performance
consistently and accurately,
can estimate
the
results of projects with good
accuracy, can build large
applications
without
excessive schedule and cost
overruns, and can achieve
excel-
lence
in quality and customer
satisfaction, then we can
call ourselves
"software
engineers" without that
phrase being a misnomer. Until
our
successes
far outnumber our failures,
software engineering really
cannot
be
considered to be a serious and
legitimate engineering
profession.
Yet
another major weakness of
software engineering is a
widespread
lack
of measurements. Many software
projects measure neither
produc-
tivity
nor quality. When
measurements are attempted,
many projects
use
metrics and measurement
approaches that have serious
flaws. For
example,
the most common metric in
the software world for
more than
50
years has been lines
of code (LOC).
As will be discussed in Chapter 6
later
in this book, LOC metrics
penalize high-level languages
and can't
measure
noncode activities at all. In
the author's view, usage of
lines of
code
for economic studies
constitutes professional
malpractice.
Another
flawed metric is that of
cost
per defect for
measuring quality.
This
metric actually penalizes
quality and achieves its
lowest values
for
the buggiest applications.
Cost per defect cannot be
used to measure
zero-defect
applications. Here, too, the
author views cost per
defect as
professional
malpractice if used for
economic study.
18
Chapter
One
Mathematical
problems with the cost per
defect metric have led to
the
urban
legend that "it costs 100
times as much to fix a bug
after delivery
as
during development." This
claim is not based on time
and motion
studies,
but is merely due to the
fact that cost per
defect goes up as
numbers
of defects go down. Defect
repairs before and after
deployment
take
about the same amount of
time. Bug repairs at both
times range
from
15 minutes to more than
eight hours. Fixing a few
subtle bugs can
take
much longer, but they
occur both before and
after deployment.
Neither
lines of code nor cost
per defect can be used
for economic
analysis
or to demonstrate software best
practices. Therefore this
book
will
use function point metrics
for economic study and
best-practice
analysis.
As mentioned, the specific
form of function point used
is that
defined
by the International Function
Point Users Group
(IFPUG).
There
are other metrics in use
such as COSMIC function
points, use
case
points, story points, web
object points, Mark II function
points,
Finnish
function points, feature
points, and perhaps 35 other
function
point
variants. However, as of 2008,
only IFPUG function points
have
enough
measured historical data to be
useful for economic and
best-
practice
analysis on a global basis.
Finnish function points have
sev-
eral
thousand projects, but most
of these are from Finland
where the
work
practices are somewhat
different from the United
States. COSMIC
function
points are used in many
countries, but still lack
substantial
quantities
of benchmark data as of 2009
although this situation
is
improving.
This
book will offer some
suggested conversion rules
between other
metrics
and IFPUG function points,
but the actual data will be
expressed
in
terms of IFPUG function points
using the 4.2 version of
the counting
rules.
As
of this writing (late 2008
and early 2009), the
function point com-
munity
has discussed segmenting
function points and using a
separate
metric
for the technical work of
putting software onto
various platforms,
or
getting it to work on various
operating systems. There is
also discus-
sion
of using a separate metric
for the work associated with
quality, such
as
inspections, testing, portability,
reliability, and so on. In
the author's
view,
both of these possible
changes in counting practices
are likely to
conceal
useful information rather
than reveal it. These
measurement
issues
will be discussed at length later in
this book in Chapter
6.
IFPUG
function point metrics are
far from perfect, but
they offer a
number
of advantages for economic
analysis and identification of
best
practices.
Function points match the
assumptions of standard economics.
They
can measure information
technology, embedded applications,
com-
mercial
software, and all other
types of software. IFPUG
function points
can
be used to measure noncode activities as
well as to measure
coding
work.
Function points can be used
to measure defects in
requirements
Introduction
and Definitions of Software Best
Practices
19
and
design as well as to measure
code defects. Function points
can handle
every
activity during both
development and maintenance. In
addition,
benchmark
data from more than 20,000
projects is available using
IFPUG
function
points. No other metric is as
stable and versatile as
function point
metrics.
One
key fact should be obvious,
but unfortunately it is not. To
demon-
strate
high quality levels, high
productivity levels, and to
identify best
practices,
it is necessary to have accurate
measurements in place.
For
more
than 50 years, the software
engineering domain has
utilized mea-
surement
practices and metrics that
are seriously flawed. An
occupation
that
cannot measure its own
performance with accuracy is not
qualified
to
be called an engineering discipline.
Therefore another purpose of
this
book
is to demonstrate how economic
analysis can be applied to
software
engineering
projects. This book will
demonstrate methods for
measuring
productivity
and quality with high
precision.
Critical
Topics in Software Engineering
As
of 2009, several important
points about software
engineering have
been
proven beyond a doubt.
Successful software projects
use state-of-
the-art
quality control methods,
change control methods, and
project
management
methods. Without excellence in
quality control, there
is
almost
no chance of a successful outcome.
Without excellence in
change
control,
creeping requirements will lead to
unexpected delays and
cost
overruns.
Without excellent project
management, estimates will be
inac-
curate,
plans will be defective, and
tracking will miss serious
problems
that
can cause either outright
failure or significant overruns.
Quality
control,
change control, and project
management are the three
critical
topics
that can lead to either
success or failure. The major
forms of best
practices
that will be discussed in this
book include the
following:
1.
Introduction,
Definitions, and Ranking of
Software Practices
Definitions
and rankings of:
Best
practices
■
Very
good practices
■
Good
practices
■
Fair
practices
■
Neutral
practices
■
Harmful
practices
■
Worst
practices
■
Definitions
of professional malpractice
20
Chapter
One
2.
Overview
of 50 Best Practices
Overview
of social and morale best
practices
Overview
of best practices
for:
Organization
■
Development
■
Quality
and security
■
Deployment
■
Maintenance
■
3.
A
Preview of Software Development
and Maintenance
in
2049
Requirements
analysis circa 2049
Design
in 2049
Software
development in 2049
User
documentation circa
2049
Customer
support in 2049
Maintenance
and enhancement in
2049
Deployment
and training in 2049
Software
outsourcing in 2049
Technology
selection and technology
transfer in 2049
Software
package evaluation and
acquisition in 2049
Enterprise
architecture and portfolio
analysis in 2049
Due
diligence in 2049
Software
litigation in 2049
4.
How
Software Personnel Learn New
Skills
Evolution
of software learning
channels
Varieties
of software specialization
Evaluation
of software learning channels in
descending order:
Number
1: Web browsing
Number
2: Webinars, podcasts, and
e-learning
Number
3: Electronic books (e-books)
Number
4: In-house education
Number
5: Self-study using CDs and
DVDs
Number
6: Commercial education
Number
7: Vendor education
Introduction
and Definitions of Software Best
Practices
21
Number
8: Live conferences
Number
9: Wiki sites
Number
10: Simulation web
sites
Number
11: Software journals
Number
12: Self-study using books
and training
materials
Number
13: On-the-job
training
Number
14: Mentoring
Number
15: Professional books,
monographs, and technical
reports
Number
16: Undergraduate university
education
Number
17: Graduate university
education
5.
Team
Organization and
Specialization
Large
teams and small
teams
Finding
optimal organization
structures
Matrix
versus hierarchical
organizations
Using
project offices
Specialists
and generalists
Pair
programming
Use
of Scrum sessions for local
development
Communications
for distributed
development
In-house
development, outsource development, or
both
6.
Project
Management
Measurement
and metrics
Sizing
applications
Risk
analysis of applications
Planning
and estimating
Governance
of applications
Tracking
costs and progress
Benchmarks
for comparison against
industry norms
Baselines
to determine process
improvements
Cancelled
projects and disaster
recovery
Minimizing
the odds of litigation in
outsource agreements
7.
Architecture,
Business Analysis, Requirements,
and Design
Alignment
of software and business
needs
Gathering
requirements for new
applications
22
Chapter
One
Mining
legacy applications for
requirements
Requirements
change or "creeping
requirements"
Requirements
churn or subtle
changes
The
role of architecture in
software
Design
methods for software
Requirements
change and multiple
releases
8.
Code
Development
Development
methodology selection
Choice
of programming languages
Multiple
languages in the same
application
Coding
techniques
Reusable
code
Code
change control
9.
Quality
Control, Inspections, and
Testing
Six
Sigma for software
Defect
estimation
Defect
and quality
measurements
Design
and code inspections
Static
analysis
Manual
testing
Automated
testing
Configuration
control
10.
Security,
Virus Protection, Spyware,
and Hacking
Prevention
methods for security
threats
Defenses
against active security
threats
Recovery
from security attacks
11.
Deployment
and Customization of Large
Applications
Selecting
deployment teams
Customizing
large and complex
applications
Developing
customized training
materials
Cut-over
and parallel runs of new
and old applications
12.
Maintenance
and Enhancements
Maintenance
(defect repairs)
Introduction
and Definitions of Software Best
Practices
23
Enhancements
(new features)
Mandatory
changes (government
regulations)
Customer
support
Renovation
of legacy applications
Maintenance
outsourcing
13.
Companies
That Utilize Best
Practices
Advanced
Bionics
Aetna
Insurance
Amazon
Apple
Computers
Computer
Aid Inc.
Coverity
Dovel
Technologies
Google
IBM
Microsoft
Relativity
Technologies
Shoulders
Corporation
Unisys
These
topics are of course not
the only factors that
need to be excel-
lent
or where best practices are
beneficial. But these topics
are the
core
issues that can eventually
change the term "software
engineering"
from
an oxymoron into a valid
description of an occupation that
has at
last
matured enough to be taken
seriously by other and older
forms of
engineering.
Overall
Ranking of Methods, Practices,
and
Sociological Factors
To
be considered a best practice, a
method or tool has to have
some
quantitative
proof that it actually
provides value in terms of
quality
improvement,
productivity improvement, maintainability
improvement,
or
some other tangible
factors.
Although
more than about 200
topics can have an impact on
software,
only
200 are shown here.
Solid empirical data exists
for about 50 out of
the
200. For the rest,
the data is anecdotal or
inconsistent. The data
has
been
gathered from observations of
about 13,000 projects in 600
companies.

24
Chapter
One
However,
that data spans more
than 20 years of observation, so
the data
is
of inconsistent ages. It is easily
possible that some of the
practices
are
out of place on the list, or
will change places as more
data becomes
available.
Even so, methods and
practices in the top 50 have
proven to
be
beneficial in scores or hundreds of
projects. Those in the
bottom 50
have
proven to be harmful.
Between
the "good" and "bad"
ends of this spectrum are a
significant
number
of practices that range from
intermittently helpful to
occasion-
ally
harmful. These are termed
neutral.
They
are sometimes
marginally
helpful
and sometimes not. But in
neither case do they seem to
have
much
impact.
Although
this book will deal with
methods and practices by
size and
by
type, it might be of interest to
show the complete range of
factors
ranked
in descending order, with the ones
having the widest and
most
convincing
proof of usefulness at the
top of the list. Table
1-4 lists a total
of
200 methodologies, practices,
and social issues that
have an impact
on
software applications and
projects.
Recall
that the scores are the
aggregated results of specific scores
for
applications
of fewer than 1000 function
points to more than
10,000
function
points. In the full table,
systems and embedded
applications,
commercial
applications, information technology,
web applications,
and
other types are also
scored separately. Table 1-4
shows the overall
average
scores.
TABLE
1-4
Evaluation
of Software Methods, Practices, and
Results
Methodology,
Practice, Result
Average
Best
Practices
1.
Reusability
(> 85% zero-defect
materials)
9.65
2.
Defect
potentials < 3.00 per
function point
9.35
3.
Defect
removal efficiency >
95%
9.32
4.
Personal
Software Process
(PSP)
9.25
5.
Team
Software Process
(TSP)
9.18
6.
Automated
static analysis
9.17
7.
Inspections
(code)
9.15
8.
Measurement
of defect removal
efficiency
9.08
9.
Hybrid
(CMM + TSP/PSP + others)
9.06
10.
Reusable
feature certification
9.00
11.
Reusable
feature change
controls
9.00
12.
Reusable
feature recall method
9.00
13.
Reusable
feature warranties
9.00
14.
Reusable
source code (zero
defect)
9.00

Introduction
and Definitions of Software Best
Practices
25
TABLE
1-4
Evaluation
of Software Methods, Practices, and
Results (continued)
Methodology,
Practice, Result
Average
Very
Good Practices
15.
Early
estimates of defect
potentials
8.83
16.
Object-oriented
(OO) development
8.83
17.
Automated
security testing
8.58
18.
Measurement
of bad-fix injections
8.50
19.
Reusable
test cases (zero
defect)
8.50
20.
Formal
security analysis
8.43
21.
Agile
development
8.41
22.
Inspections
(requirements)
8.40
23.
Time
boxing
8.38
24.
Activity-based
productivity measures
8.33
25.
Reusable
designs (scalable)
8.33
26.
Formal
risk management
8.27
27.
Automated
defect tracking tools
8.17
28.
Measurement
of defect origins
8.17
29.
Benchmarks
against industry data
8.15
30.
Function
point analysis (high
speed)
8.15
31.
Formal
progress reports
(weekly)
8.06
32.
Formal
measurement programs
8.00
33.
Reusable
architecture (scalable)
8.00
34.
Inspections
(design)
7.94
35.
Lean
Six Sigma
7.94
36.
Six
Sigma for software
7.94
37.
Automated
cost-estimating tools
7.92
38.
Automated
maintenance workbenches
7.90
39.
Formal
cost-tracking reports
7.89
40.
Formal
test plans
7.81
41.
Automated
unit testing
7.75
42.
Automated
sizing tools (function
points)
7.73
43.
Scrum
session (daily)
7.70
44.
Automated
configuration control
7.69
45.
Reusable
requirements (scalable)
7.67
46.
Automated
project management
tools
7.63
47.
Formal
requirements analysis
7.63
48.
Data
mining for business rule
extraction
7.60
49.
Function
point analysis (pattern
matches)
7.58
50.
High-level
languages (current)
7.53
51.
Automated
quality and risk
prediction
7.53
52.
Reusable
tutorial materials
7.50
(Continued)

26
Chapter
One
TABLE
1-4
Evaluation
of Software Methods, Practices, and
Results (continued)
Methodology,
Practice, Result
Average
Very
Good Practices
53.
Function
point analysis
(IFPUG)
7.37
54.
Measurement
of requirements changes
7.37
55.
Formal
architecture for large
applications
7.36
56.
Best-practice
analysis before start
7.33
57.
Reusable
feature catalog
7.33
58.
Quality
function deployment
(QFD)
7.32
59.
Specialists
for key skills
7.29
60.
Joint
application design
(JAD)
7.27
61.
Automated
test coverage
analysis
7.23
62.
Re-estimating
for requirements
changes
7.17
63.
Measurement
of defect severity
levels
7.13
64.
Formal
SQA team
7.10
65.
Inspections
(test materials)
7.04
66.
Automated
requirements analysis
7.00
67.
DMAIC
(design, measure, analyze,
improve, control)
7.00
68.
Reusable
construction plans
7.00
69.
Reusable
HELP information
7.00
70.
Reusable
test scripts
7.00
Good
Practices
71.
Rational
Unified Process (RUP)
6.98
72.
Automated
deployment support
6.87
73.
Automated
cyclomatic complexity
analysis
6.83
74.
Forensic
analysis of cancelled
projects
6.83
75.
Reusable
reference manuals
6.83
76.
Automated
documentation tools
6.79
77.
Capability
Maturity Model (CMMI Level
5)
6.79
78.
Annual
training (technical
staff)
6.67
79.
Metrics
conversion (automated)
6.67
80.
Change
review boards
6.62
81.
Formal
governance
6.58
82.
Automated
test library control
6.50
83.
Formal
scope management
6.50
84.
Annual
training (managers)
6.33
85.
Dashboard-style
status reports
6.33
86.
Extreme
programming (XP)
6.28
87.
Service-oriented
architecture (SOA)
6.26
88.
Automated
requirements tracing
6.25
89.
Total
cost of ownership (TCO)
measures
6.18

Introduction
and Definitions of Software Best
Practices
27
TABLE
1-4
Evaluation
of Software Methods, Practices, and
Results (continued)
Methodology,
Practice, Result
Average
Good
Practices
90.
Automated
performance analysis
6.17
91.
Baselines
for process
improvement
6.17
92.
Use
cases
6.17
93.
Automated
test case generation
6.00
94.
User
satisfaction surveys
6.00
95.
Formal
project office
5.88
96.
Automated
modeling/simulation
5.83
97.
Certification
(Six Sigma)
5.83
98.
Outsourcing
(maintenance => CMMI Level 3)
5.83
99.
Capability
Maturity Model (CMMI Level
4)
5.79
100.
Certification
(software quality
assurance)
5.67
101.
Outsourcing
(development => CMM 3)
5.67
102.
Value
analysis (intangible
value)
5.67
103.
Root-cause
analysis
5.50
104.
Total
cost of learning (TCL)
measures
5.50
105.
Cost
of quality (COQ)
5.42
106.
Embedded
users in team
5.33
107.
Normal
structured design
5.17
108.
Capability
Maturity Model (CMMI Level
3)
5.06
109.
Earned-value
measures
5.00
110.
Unified
modeling language
(UML)
5.00
111.
Value
analysis (tangible
value)
5.00
Fair
Practices
112.
Normal
maintenance activities
4.54
113.
Rapid
application development
(RAD)
4.54
114.
Certification
(function points)
4.50
115.
Function
point analysis
(Finnish)
4.50
116.
Function
point analysis
(Netherlands)
4.50
117.
Partial
code reviews
4.42
118.
Automated
restructuring
4.33
119.
Function
point analysis
(COSMIC)
4.33
120.
Partial
design reviews
4.33
121.
Team
Wiki communications
4.33
122.
Function
point analysis
(unadjusted)
4.33
123.
Function
points (micro 0.001 to
10)
4.17
124.
Automated
daily progress
reports
4.08
125.
User
stories
3.83
126.
Outsourcing
(offshore => CMM 3)
3.67
(Continued)

28
Chapter
One
TABLE
1-4
Evaluation
of Software Methods, Practices, and
Results (continued)
Methodology,
Practice, Result
Average
Fair
Practices
127.
Goal-question
metrics
3.50
128.
Certification
(project managers)
3.33
129.
Refactoring
3.33
130.
Manual
document production
3.17
131.
Capability
Maturity Model (CMMI Level
2)
3.00
132.
Certification
(test personnel)
2.83
133.
Pair
programming
2.83
134.
Clean-room
development
2.50
135.
Formal
design languages
2.50
136.
ISO
quality standards
2.00
Neutral
Practices
137.
Function
point analysis
(backfiring)
1.83
138.
Use
case points
1.67
139.
Normal
customer support
1.50
140.
Partial
governance (low-risk
projects)
1.00
141.
Object-oriented
metrics
0.33
142.
Manual
testing
0.17
143.
Outsourcing
(development < CMM 3)
0.17
144.
Story
points
0.17
145.
Low-level
languages (current)
0.00
146.
Outsourcing
(maintenance < CMM 3)
0.00
147.
Waterfall
development
0.33
148.
Manual
change control
0.50
149.
Manual
test library control
0.50
150.
Reusability
(average quality
materials)
0.67
151.
Capability
Maturity Model (CMMI Level
1)
1.50
152.
Informal
progress tracking
1.50
153.
Outsourcing
(offshore < CMM 3)
1.67
Unsafe
Practices
154.
Inadequate
test library control
2.00
155.
Generalists
instead of specialists
2.50
156.
Manual
cost estimating
methods
2.50
157.
Inadequate
measurement of productivity
2.67
158.
Cost
per defect metrics
2.83
159.
Inadequate
customer support
2.83
160.
Friction
between stakeholders and
team
3.50
161.
Informal
requirements gathering
3.67
162.
Lines
of code metrics (logical
LOC)
4.00
163.
Inadequate
governance
4.17

Introduction
and Definitions of Software Best
Practices
29
TABLE
1-4
Evaluation
of Software Methods, Practices, and
Results (continued)
Methodology,
Practice, Result
Average
Unsafe
Practices
164.
Lines
of code metrics (physical
LOC)
4.50
165.
Partial
productivity measures
(coding)
4.50
166.
Inadequate
sizing
4.67
167.
High-level
languages (obsolete)
5.00
168.
Inadequate
communications among
team
5.33
169.
Inadequate
change control
5.42
170.
Inadequate
value analysis
5.50
Worst
Practices
171.
Friction/antagonism
among team members
6.00
172.
Inadequate
cost estimating
methods
6.04
173.
Inadequate
risk analysis
6.17
174.
Low-level
languages (obsolete)
6.25
175.
Government
mandates (short lead
times)
6.33
176.
Inadequate
testing
6.38
177.
Friction/antagonism
among management
6.50
178.
Inadequate
communications with
stakeholders
6.50
179.
Inadequate
measurement of quality
6.50
180.
Inadequate
problem reports
6.67
181.
Error-prone
modules in applications
6.83
182.
Friction/antagonism
among stakeholders
6.83
183.
Failure
to estimate requirements
changes
6.85
184.
Inadequate
defect tracking
methods
7.17
185.
Rejection
of estimates for business
reasons
7.33
186.
Layoffs/loss
of key personnel
7.33
187.
Inadequate
inspections
7.42
188.
Inadequate
security controls
7.48
189.
Excessive
schedule pressure
7.50
190.
Inadequate
progress tracking
7.50
191.
Litigation
(noncompete violation)
7.50
192.
Inadequate
cost tracking
7.75
193.
Litigation
(breach of contract)
8.00
194.
Defect
potentials > 6.00 per
function point
9.00
195.
Reusability
(high defect volumes)
9.17
196.
Defect
removal efficiency <
85%
9.18
197.
Litigation
(poor quality/damages)
9.50
198.
Litigation
(security flaw
damages)
9.50
199.
Litigation
(patent violation)
10.00
200.
Litigation
(intellectual property
theft)
10.00
30
Chapter
One
The
candidates for best
practices will be discussed and
evaluated later
in
this book in Chapters 7, 8,
and 9. Here in Chapter 1
they are only
introduced
to show what the overall
set looks like.
Note
that the factors are a
mixture. They include full
development
methods
such as Team Software Process
(TSP) and partial methods
such
as
quality function deployment
(QFD). They include specific
practices
such
as "inspections" of various kinds,
and also include social
issues such
as
friction between stakeholders
and developers. They include
metrics
such
as "lines of code," which is
ranked as a harmful factor because
this
metric
penalizes high-level languages
and distorts both quality
and
productivity
data. What all these
things have in common is
that they
either
improve or degrade quality
and productivity.
Since
programming languages are
also significant, you might
ask why
specific
languages such as Java,
Ruby, or Objective C are not
included.
Because,
as of 2009, more than 700
programming languages exist; a
new
language
is created about every
month.
In
addition, a majority of large
software applications utilize
several
languages
at the same time, such as
Java and HTML, or use
combina-
tions
that may top a dozen
languages in the same
applications. Later in
Chapter
8 this book will discuss the
impact of languages and
their virtues
or
weaknesses, but there are
far too many languages,
and they change
far
too rapidly, for an
evaluation to be useful for
more than a few
months.
Therefore
in Table 1-4, languages are
covered only in a general
way:
whether
they are high level or
low level, and whether
they are current
languages
or "dead" languages no longer
used for new
development.
This
book is not a marketing tool
for any specific products or
methods,
including
the tools and methods
developed by the author.
This book
attempts
to be objective and to base conclusions
on quantitative data
rather
than on subjective
opinions.
To
show how methods and
practices differ by size
of
project, Table 1-5
illustrates
the top 30 best practices
for small projects of 1000
function
points
and for large systems of
10,000 or more function
points. As can
be
seen, the two lists are
very different.
For
small projects, Agile,
extreme programming, and
high-level pro-
gramming
languages are key practices
because coding is the
dominant
activity
for small applications. When
large applications are
analyzed,
quality
control ascends to the top.
Also, careful requirements,
design,
and
architecture are important
for large
applications.
There
are also differences in best
practices by type
of
application.
Table
1-6 shows the top 30
best practices for
information technology
(IT)
projects
compared with embedded and
systems software
projects.
Although
high-quality reusable components
are the top factor
for both,
the
rest of the two lists
are quite different. For
information technology

Introduction
and Definitions of Software Best
Practices
31
TABLE
1-5
Best
Practices for 1000 and
10,000Function Point Software
Projects
Small
(1000 function
points)
Large
(10,000 function
points)
1.
Agile
development
1.
Reusability
(> 85% zero-defect
materials)
2.
High-level
languages (current)
2.
Defect
potentials < 3.00 per
function
point
3.
Extreme
programming (XP)
3.
Formal
cost tracking reports
4.
Personal
Software Process
(PSP)
4.
Inspections
(requirements)
5.
Reusability
(> 85% zero-defect
5.
Formal
security analysis
materials)
6.
Automated
static analysis
6.
Measurement
of defect removal
efficiency
7.
Time
boxing
7.
Team
Software Process
(TSP)
8.
Reusable
source code (zero
defect)
8.
Function
point analysis (high
speed)
9.
Reusable
feature warranties
9.
Capability
Maturity Model (CMMI
Level
5)
10.
Reusable feature
certification
10.
Automated
security testing
11.
Defect potentials < 3.00
per
11.
Inspections
(design)
function
point
12.
Reusable feature change
controls
12.
Defect
removal efficiency >
95%
13.
Reusable feature recall
method
13.
Inspections
(code)
14.
Object-oriented (OO)
development
14.
Automated
sizing tools
(function
points)
15.
Inspections (code)
15.
Hybrid
(CMM + TSP/PSP + others)
16.
Defect removal efficiency >
95%
16.
Automated
static analysis
17.
Hybrid (CMM + TSP/PSP +
others)
17.
Personal
Software Process
(PSP)
18.
Scrum session (daily)
18.
Automated
cost estimating tools
19.
Measurement of defect
removal
19.
Measurement
of requirements changes
efficiency
20.
Function point analysis
(IFPUG)
20.
Service-oriented
architecture (SOA)
21.
Automated maintenance
21.
Automated
quality and risk
prediction
workbenches
22.
Early estimates of defect
potentials 22.
Benchmarks
against industry data
23.
Team Software Process
(TSP)
23.
Quality
function deployment
(QFD)
24.
Embedded users in
team
24.
Formal
architecture for
large
applications
25.
Benchmarks against industry
data
25.
Automated
defect tracking tools
26.
Measurement of defect
severity
26.
Reusable
architecture (scalable)
levels
27.
Use cases
27.
Formal
risk management
28.
Reusable test cases (zero
defects)
28.
Activity-based
productivity measures
29.
Automated security
testing
29.
Formal
progress reports
(weekly)
30.
Measurement of bad-fix
injections
30.
Function
point analysis
(pattern
matches)

32
Chapter
One
TABLE
1-6
Best
Practices for IT Projects
and Embedded/Systems
Projects
Information
Technology (IT)
Projects
Embedded
and Systems Projects
1.
Reusability (> 85%
zero-defect
1.
Reusability (> 85%
zero-defect
materials)
materials)
2.
Formal governance
2.
Defect potentials < 3.00
per function
point
3.
Team Software Process
(TSP)
3.
Defect removal efficiency >
95%
4.
Personal Software Process
(PSP)
4.
Team Software Process
(TSP)
5.
Agile development
5.
Measurement of defect severity
levels
6.
Defect removal efficiency >
95%
6.
Inspections (code)
7.
Formal security
analysis
7.
Lean Six Sigma
8.
Formal cost tracking
reports
8.
Six Sigma for
software
9.
Defect potentials < 3.00
per function 9. Automated
static analysis
point
10.
Automated static
analysis
10.
Measurement of defect
removal
efficiency
11.
Measurement of defect
removal
11.
Hybrid (CMM + TSP/PSP +
others)
efficiency
12.
Function point analysis
(IFPUG)
12.
Personal Software Process
(PSP)
13.
Service-oriented architecture (SOA)
13. Formal security
analysis
14.
Joint application design
(JAD)
14.
Formal cost tracking
reports
15.
Function point analysis
(high speed) 15. Function
point analysis (high
speed)
16.
Automated sizing tools
(function
16.
Inspections (design)
points)
17.
Data mining for business
rule
17.
Automated project management
tools
extraction
18.
Benchmarks against industry
data
18.
Formal test plans
19.
Hybrid (CMM + TSP/PSP +
others)
19.
Quality function deployment
(QFD)
20.
Reusable feature
certification
20.
Automated cost estimating
tools
21.
Reusable feature change
controls
21.
Automated security
testing
22.
Reusable feature recall
method
22.
Object-oriented (OO)
development
23.
Reusable feature
warranties
23.
Inspections (test
materials)
24.
Reusable source code (zero
defect)
24.
Agile development
25.
Early estimates of defect
potentials 25. Automated
sizing tools (function
points)
26.
Measurement of bad-fix
injections
26.
Reusable feature
certification
27.
Reusable test cases (zero
defect)
27.
Reusable feature change
controls
28.
Inspections (requirements)
28.
Reusable feature recall
method
29.
Activity-based productivity
29.
Reusable feature
warranties
measures
30.
Reusable designs
(scalable)
30.
Reusable source code (zero
defect)
projects,
at least for those developed by
Fortune 500 companies,
governance
is
in the number 2 spot for
best practices. This is
because inadequate or
incompetent
governance can now lead to
criminal charges against
corpo-
rate
officers as a result of the
Sarbanes-Oxley Act of 2002.
Introduction
and Definitions of Software Best
Practices
33
For
systems and embedded
software, quality control
measures of vari-
ous
kinds are the top-ranked
best practices. Historically,
systems and
embedded
software have had the
best and most sophisticated
software
quality
control in the history of
software. This is because the
main prod-
ucts
of the systems and embedded
domain are complex physical
devices
that
might cause catastrophic
damages or death if quality
control is
deficient.
Thus manufacturers of medical
devices, aircraft control
sys-
tems,
fuel injection, and other
forms of systems and
embedded applica-
tions
have long had sophisticated
quality control, even before
software
was
used for physical
devices.
The
main point is that software
development is not a "one
size fits all"
kind
of work. Best practices must
be carefully selected to match
both
the
size and the type of
the software under
development.
A
few basic principles are
true across all sizes
and all types:
quality
control,
change control, good estimating,
and good measurement
are
critical
activities. Reuse is also
critical, with the caveat
that only zero-
defect
reusable objects provide
solid value.
Although
this book is primarily about
software engineering best
prac-
tices,
it is useful to discuss polar
opposites and to show worst
practices,
too.
The definition of a worst
practice as
used in this book is a
method or
approach
that has been proven to
cause harm to a significant
number
of
projects that used it.
The word "harm" means
degradation of quality,
reduction
of productivity, or concealing the
true status of projects.
In
addition,
"harm" includes data that is
so inaccurate that it leads to
false
conclusions
about economic value.
Each
of the harmful methods and
approaches individually has
been
proven
to cause harm in a significant
number of applications that
used
them.
This is not to say that
they always fail. Sometimes,
rarely, they
may
even be useful. But in a majority of
situations, they do more
harm
than
good in repeated
trials.
A
distressing aspect of the
software industry is that
bad practices
seldom
occur in isolation. From
examining the depositions
and court
documents
of lawsuits for projects
that were cancelled or never
oper-
ated
effectively, it usually happens
that multiple worst
practices are
used
concurrently.
From
data and observations on the
usage patterns of software
meth-
ods
and practices, it is distressing to
note that practices in the
harmful
or
worst set are actually
found on about 65 percent of
U.S. software
projects.
Conversely, best practices
that score 9 or higher have
only been
noted
on about 14 percent of U.S.
software projects. It is no wonder
that
failures
far outnumber successes for
large software
applications!
From
working as an expert witness in a
number of breach-of-contract
lawsuits,
the author has found
that many harmful practices
tend to occur
repeatedly.
These collectively are
viewed by the author as
candidates for

34
Chapter
One
being
deemed "professional malpractice."
The definition of professional
malpractice
is
something that causes harm
that a trained
practitioner
should
know is harmful and
therefore avoid using it.
Table 1-7 shows 30
of
these common but harmful
practices.
Not
all of these 30 occur at the
same time. In fact, some of
them, such
as
the use of generalists, are
only harmful for large
applications in the
10,000function
point range. However, this
collection of harmful
practices
has
been a drain on the software
industry and has led to
many lawsuits.
TABLE
1-7
Software
Methods and Practices Considered
"Professional Malpractice"
Rank
Methods
and Practices
Scores
1.
Defect
removal efficiency <
85%
9.18
2.
Defect
potentials > 6.00 per
function point
9.00
3.
Reusability
(high defect volumes)
7.83
4.
Inadequate
cost tracking
7.75
5.
Excessive
schedule pressure
7.50
6.
Inadequate
progress tracking
7.50
7.
Inadequate
security controls
7.48
8.
Inadequate
inspections
7.42
9.
Inadequate
defect tracking
methods
7.17
10.
Failure
to estimate requirements
changes
6.85
11.
Error-prone
modules in applications
6.83
12.
Inadequate
problem reports
6.67
13.
Inadequate
measurement of quality
6.50
14.
Rejection
of estimates for business
reasons
6.50
15.
Inadequate
testing
6.38
16.
Inadequate
risk analysis
6.17
17.
Inadequate
cost estimating
methods
6.04
18.
Inadequate
value analysis
5.50
19.
Inadequate
change control
5.42
20.
Inadequate
sizing
4.67
21.
Partial
productivity measures
(coding)
4.50
22.
Lines
of code (LOC) metrics
4.50
23.
Inadequate
governance
4.17
24.
Inadequate
requirements gathering
3.67
25.
Cost
per defect metrics
2.83
26.
Inadequate
customer support
2.83
27.
Inadequate
measurement of productivity
2.67
28.
Generalists
instead of specialists for
large systems
2.50
29.
Manual
cost estimating methods for
large systems
2.50
30.
Inadequate
test library control
2.00
Introduction
and Definitions of Software Best
Practices
35
Note
that two common metrics
are ranked as professional
malpractice:
"lines
of code" and "cost per
defect." They are viewed as
malpractice
because
both violate the tenets of
standard economics and
distort data
so
that economic results are
impossible to see. The lines
of code metric
penalizes
high-level languages. The
cost per defect metric
penalizes qual-
ity
and achieves its best
results for the buggiest
artifacts. These problems
will
be explained in more detail
later.
With
hundreds of methods and
techniques available for
developing
and
maintaining software, not
all of them can be
classified as either
best
practices
or worst practices. In fact,
for many practices and
methods,
the
results are so mixed or
ambiguous that they can be
called "neutral
practices."
The
definition of a neutral
practice is a
method or tool where there
is
little
statistical data that
indicates either help or
hindrance in software
development.
In other words, there are no
quantified changes in
either
a
positive or negative direction
from using the
method.
Perhaps
the most interesting
observation about neutral
practices is
that
they occur most often on
small projects of 1500
function points and
below.
Many years of data indicate
that small projects can be
developed
in
a fairly informal manner and
still turn out all
right. This should
not
be
surprising, because the same
observation can be made
about scores
of
products. For example, a
rowboat does not need
the same rigor of
development
as does a cruise
ship.
Because
small projects outnumber
large applications by more
than
50
to 1, it is not easy to even
perform best-practice analysis if
small
programs
are the only projects
available for analysis. Many
paths lead
to
success for small projects. As
application size goes up,
the number
of
successful paths goes down
in direct proportion. This is one of
the
reasons
why university studies seldom
reach the same conclusions
as
industrial
studies when it comes to
software engineering methods
and
results.
Universities seldom have
access to data from large
software
projects
in the 10,000 to
100,000function point size
range.
Serious
analysis of best and worst
practices requires access to
data
from
software applications that
are in the size range of
10,000 or more
function
points. For large
applications, failures outnumber
successes.
At
the large end of the
size spectrum, the effects
of both best and
worst
practices
are magnified. As size
increases, quality control,
change con-
trol,
and excellence in project
management become more and
more
important
on the paths to successful
projects.
Smaller
applications have many
advantages. Due to shorter
develop-
ment
schedules, the number of
changing requirements is low.
Smaller
applications
can be built successfully
using a variety of methods
and
processes.
Topics such as estimates and
plans are much easier
for small
projects
with limited team
size.
36
Chapter
One
Large
software applications in the
range of 10,000 or more
function
points
are much more difficult to
create, have significant
volumes of
requirements
changes, and will not be
successful without topnotch
qual-
ity
control, change control, and
project management. Many
kinds of
specialists
are needed for large
software applications, and
also special
organizations
are needed such as project
offices, formal quality
assur-
ance
teams, technical writing
groups, and testing
organizations.
Summary
and Conclusions
There
are hundreds of ways to make
large software systems fail.
There
are
only a few ways of making
them successful. However,
the ways or
"paths"
that lead to success are not
the same for small
projects below
1000
function points and large
systems above 10,000
function points.
Neither
are the ways or paths
the same for embedded
applications, web
applications,
commercial software, and the
many other types of
software
applications
in the modern world.
Among
the most important software
development practices are
those
dealing
with planning and estimating
before the project starts,
with
absorbing
changing requirements during
the project, and with
success-
fully
handling bugs or defects.
Another key element of success is
being
proactive
with problems and solving
them quickly, rather than
ignoring
them
and hoping they will go
away.
Successful
projects using state-of-the-art
methods are always
excel-
lent
in the critical activities:
estimating, change control,
quality control,
progress
tracking, and problem
resolution. By contrast, projects
that run
late
or fail usually had
optimistic estimates, did
not anticipate
changes,
failed
to control quality, tracked
progress poorly, and ignored
problems
until
too late.
Software
engineering is not yet a
true and recognized
engineering
field.
It will never become one so long as
our failures outnumber
out
successes.
It would benefit the global
economy and our
professional
status
to move software engineering
into the ranks of true
engineering
fields.
But accomplishing this goal
requires better quality
control, better
change
control, better measurements,
and much better
quantification
of
our results than we have
today.
Readings
and References
These
selections include some of
the historic books on
software best
practices,
and also on broader topics
such as quality in general.
One
book
on medical practice is included:
Paul Starr's book The
Social
Transformation
of American Medicine, which
won a Pulitzer Prize
in
1982.
This book discusses the
improvements in medical education
and
Introduction
and Definitions of Software Best
Practices
37
certification
achieved by the American
Medical Association (AMA).
The
path
followed by the AMA has
considerable relevance to improving
soft-
ware
engineering education, best
practices, and certification.
Thomas
Kuhn's
book on The
Structure of Scientific Revolutions
is
also included,
because
software engineering needs a
revolution if it is to shift
from
custom
development of unique applications to
construction of generic
applications
from certified reusable
components.
Boehm,
Barry. Software
Engineering Economics. Englewood
Cliffs, NJ: Prentice
Hall,
1981.
Brooks,
Fred. The
Mythical Man-Month. Reading,
MA: Addison-Wesley, 1974,
rev. 1995.
Bundschuh,
Manfred, and Carol Dekkers.
The
IT Measurement Compendium. Berlin:
Springer-Verlag,
2008.
Charette,
Bob. Software
Engineering Risk Analysis
and Management. New
York:
McGraw-Hill,
1989.
Crosby,
Philip B. Quality
Is Free. New
York: New American Library,
Mentor Books,
1979.
DeMarco,
Tom. Controlling
Software Projects. New
York: Yourdon Press,
1982.
DeMarco,
Tom. Peopleware:
Productive Projects and
Teams. New
York: Dorset House,
1999.
Garmus,
David, and David Herron.
Function
Point Analysis--Measurement
Practices
for
Successful Software Projects.
Boston:
Addison Wesley Longman,
2001.
Gilb,
Tom, and Dorothy Graham.
Software
Inspections. Reading,
MA: Addison Wesley,
1993.
Glass,
Robert L. Software
Runaways: Lessons Learned
from Massive Software
Project
Failures.
Englewood
Cliffs, NJ: Prentice Hall,
1998.
Glass,
Robert L. Software
Creativity, Second
Edition. Atlanta, GA:
developer.*books,
2006.
Hamer-Hodges,
Ken. Authorization
Oriented Architecture--Open
Application
Networking
and Security in the 21st
Century. Philadelphia:
Auerbach Publications,
to
be published in December
2009.
Humphrey,
Watts. Managing
the Software Process. Reading,
MA: Addison Wesley,
1989.
Humphrey,
Watts. PSP:
A Self-Improvement Process for Software
Engineers. Upper
Saddle
River, NJ: Addison Wesley,
2005.
Humphrey,
Watts. TSP--Leading
a Development Team. Boston:
Addison Wesley, 2006.
Humphrey,
Watts. Winning
with Software: An Executive
Strategy. Boston:
Addison
Wesley,
2002.
Jones,
Capers. Applied
Software Measurement, Third
Edition.
New
York: McGraw-Hill,
2008.
Jones,
Capers. Estimating
Software Costs. New
York: McGraw-Hill,
2007.
Jones,
Capers. Software
Assessments, Benchmarks, and Best
Practices.
Boston: Addison
Wesley
Longman, 2000.
Kan,
Stephen H. Metrics
and Models in Software
Quality Engineering, Second
Edition.
Boston:
Addison Wesley Longman,
2003.
Kuhn,
Thomas. The
Structure of Scientific Revolutions.
Chicago:
University of Chicago
Press,
1996.
Love,
Tom. Object
Lessons. New
York: SIGS Books,
1993.
McConnell,
Steve. Code
Complete. Redmond,
WA: Microsoft Press,
1993.
Myers,
Glenford. The
Art of Software Testing. New
York: John Wiley & Sons,
1979.
Pressman,
Roger. Software
Engineering--A Practitioner's Approach,
Sixth
Edition.
New
York:
McGraw-Hill, 2005.
Starr,
Paul. The
Social Transformation of American
Medicine. New
York: Basic Books,
1982.
Strassmann,
Paul. The
Squandered Computer. Stamford,
CT: Information Economics
Press,
1997.
38
Chapter
One
Weinberg,
Gerald M. Becoming
a Technical Leader. New
York: Dorset House,
1986.
Weinberg,
Gerald M. The
Psychology of Computer Programming.
New
York: Van
Nostrand
Reinhold, 1971.
Yourdon,
Ed. Death
March--The Complete Software
Developer's Guide to
Surviving
"Mission
Impossible" Projects. Upper
Saddle River, NJ: Prentice Hall
PTR, 1997.
Yourdon,
Ed. Outsource:
Competing in the Global
Productivity Race. Upper
Saddle
River,
NJ: Prentice Hall PTR,
2005.
Table of Contents:
- Introduction and Definitions of Software Best Practices:Paths for Software Deployment
- Overview of 50 Software Best Practices:Best Practices for Outsourcing Software Applications
- A Preview of Software Development and Maintenance in 2049:Requirements Analysis Circa 2049
- How Software Personnel Learn New Skills:The Evolution of Software Learning Channels
- Software Team Organization and Specialization:Quantifying Organizational Results
- Project Management and Software Engineering:Software Progress and Problem Tracking
- Requirements, Business Analysis, Architecture, Enterprise Architecture, and Design:Software Requirements
- Programming and Code Development:How Many Programming Languages Are Really Needed?
- Software Quality: The Key to Successful Software Engineering, Measuring Software Quality, Software Defect Removal
- Index