 |
FINAL REVIEW OF ENTIRE COURSE ON FINANCIAL MANAGEMENT:Financial Statements and Ratios |
| << INTERNATIONAL FINANCE (MULTINATIONAL FINANCE):Major Issues Faced by Multinationals |

Financial
Management MGT201
VU
Lesson
45
FINAL
REVIEW OF ENTIRE COURSE ON FINANCIAL
MANAGEMENT.
Outline
of 5 Major Areas of FM:
1-
Interest Rates
Compounding
(money
grows with time)
Discrete
Annual (FV=PV (1+r) t)
vs.
Discrete
Multiple / Fractional (FV = PV
(1+ (r/m)) mn)
"n"
number of years,
"r"
is the Discount Rate or Opportunity
Cost of Capital or WACC
depending on your
perspective
"m"
times a year interest is compounded
Discounting
(or Reverse-Compounding)
PV
= FV / (1+r) t
Annuity
and Perpetuity
FV
Annuity = CCF [(1+r) n -1]
/ i. Limited time
period.
PV
Perpetuity = CCF / r.
Yield
Curves and Term
Structure
·
Normal Yield Curve is
Upward Sloping. Interest
Rates rise with maturity or
life
of
Bond.
Geometric
Average:
·
(1 + 2Yr Bond YTM)
=
(1 + 1Yr Bond YTM 1st year)
x (1 + 1Yr Bond YTM in 2nd
Year).
·
Nominal i = Real i + Inflation +
Risk Premiums (i.e.
Liquidity Risk + Maturity
Risk
+
Sovereign Risk)
Financial
Statements and Ratios
·
Balance Sheet, Profit and
Loss Account (Income Statement) and
Cash flow
statement
·
DuPont = Profit Margin x Asset
Turnover x (Assets/Equity),
·
Margin = Net Income/Sales
·
Turnover = Sales /
Assets
·
Important
ratios: ROA,
ROE, EPS, P/E, Plough back Pb,
Current ratio,
Debt/Capitalization,
TIE
·
ROA ( = (NI + Interest) / Total
Assets) and ROE (= NI /
Equity)
·
EPS (= NI / No. of Shares
Outstanding) and P/E and
Plough back (Pb = g /
ROE
where "g" is Dividend growth rate
%)
·
Current Ratio (=Current
Assets / Current Liabilities),
Debt/Capitalization or
Leverage
Ratio, TIE
184

Financial
Management MGT201
VU
FM
Perspective of Balance Sheet
Own
Stock
Issued
by
Company
to
Raise
Cash
Copyright:
M. S. Humayun
4
Graphical
View of
Simple,
Discrete Compound, &
Continuous
Interest - Important
Future
Value (FV)
CONTINUOUS
COMPOUNDING
in
Rupees
DISCRETE
COMPOUNDING
SIMPLE
INTEREST
Time
(Years)
185

Financial
Management MGT201
VU
Yield
Curve for Bonds
Term
Structure of Interest
rates
Annualized
Interest
Rate %
(Bond
Yield)
Time
(Years)
Now
1
Year
5
Years
10
Years
2-
Capital Budgeting and Investment
Decisions to Rank Projects - Fixed
assets Side of
Balance
Sheet
Objective
of Financial Management: Maximization
of Shareholders' (Owners')
Wealth.
Maximization of Value of Firm.
Maximization of Value of Shares of the
Firm.
Cash
Flows = CF
=Net
After Tax Incremental Cash
Flows
=
NOI + Depreciation + Cost Savings
Extra Taxes + Any Salvage
Value
Cash
Flow Diagrams / Time Line:
Cash Inflows (Upward
Arrows)
NPV
or DCF (Best
Criterion) Highest NPV
Project is Best.
NPV
uses Discount Rate
=
Required ROR or WACC which
can be changed for every
year and varies depending
on
the Investor's Risk
Profile.
NPV=
PV - Io
=
-Io + CF1/ (1+r) + CF2/
(1+r) 2 + CF3/ (1+r) 3 +
...,
For
comparison of projects with Unequal Lives
use Adjusted
NPV
=
NPV x EAA where EAA Factor = [i x (1+i)
n / (1+i) n
-1]
IRR
(%) -
Higher IRR is better. Fixed
throughout life of
project,
If
Multiple IRR then use
(1+MIRR) n =
FV Inflows / PV Outflows.
FV
= Future Value and PV =
Present Value
Capital Rationing Limited
Budget, % Budget
Utilization
186
Financial
Management MGT201
VU
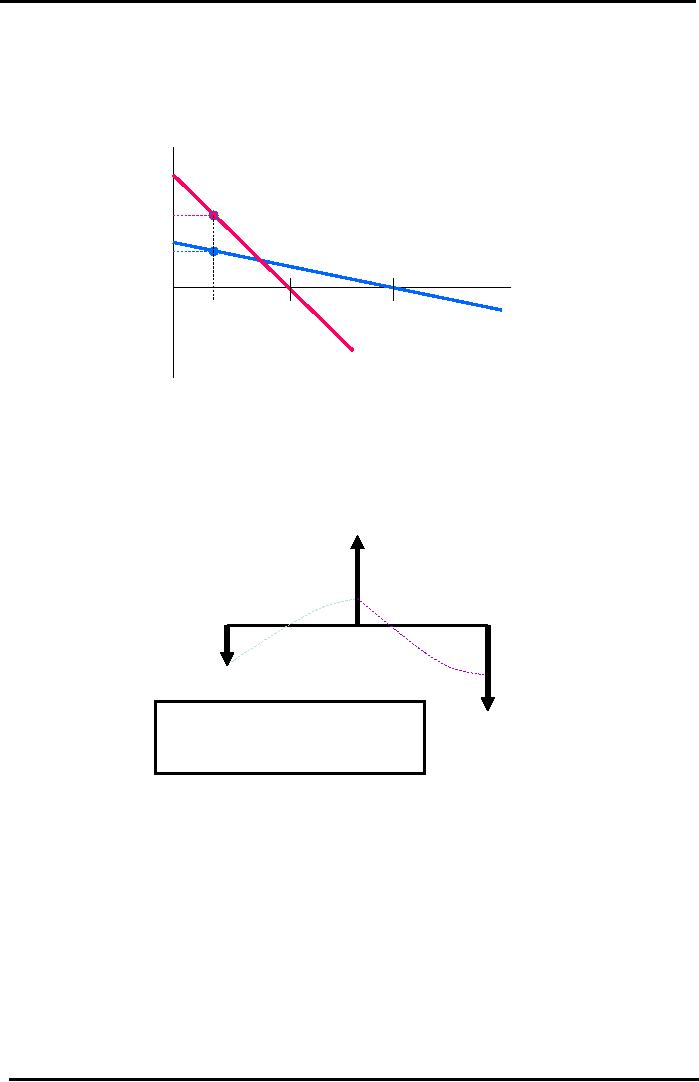
NPV
IRR Diagram
Combined
Use of NPV & IRR
to
Compare 2 Projects - Important
NPV
(Rs)
PROJECT
A: LOWER IRR BUT
HIGHER
NPV BECAUSE
ACTUAL
"r"
IS VERY LOW.
PROJECT
B: HIGHER IRR BUT
LOWER
NPV
NPV
A
NPV
FAVORS PROJECT A
SO
PROJECT A IS BETTER.
NPV
B
Discount
Rate
% (r)
ACTUAL
IRR
IRR
Required
Project
B
Project
A
Return
or
WACC
for
Investor
Non-Normal
Cash Flow
Diagram
Multiple
IRR Example
(1+MIRR)n =
(FV Cash Inflows) / (PV
Cash Outflows)
CF
1 = +Rs 500
Sign
Change #1
Yr
0
Yr
1
Yr
2
Sign
Change #2
Io
= - Rs 500
Note:
More
than 1 Sign
Change
CF
2 = -Rs 500
in
Direction of Cash
Flow
Arrows
suggests Multiple
IRR's
3-
Securities Valuation
Fair
vs. Market Value - PV
Formula gives Fair
(Intrinsic)Value
Market Value is determined by
Investors in Market and
buying /selling of securities.
Bond
Pricing and YTM -
Bond is Legal Paper representing
Debt
·
Use PV Formula to Calculate
Bond Price:
PV
= CF1 / (1+rD)
+ CF2 / (1+rD) 2 + ... +
PAR value / (1+rD)
n
·
Cash Flows = CF =
Coupon
=
Coupon Rate (%) x Par
Value
·
Coupon Rate (fixed)
vs. Discount Rate (rD Required Return
for
Bond
Investor)
·
YTM = IRR for Bond.
Set PV = 0 and solve for
"rD"
using Iteration.
·
Bond Ratings of FIRMS by Moodys
and S&P.
Share
Pricing and
Yields:
187
Financial
Management MGT201
VU
Stock
is Legal Paper representing
Ownership
·
Market Price of Share = Po = EPS x
P/E
·
Gordon's Formula is IMPORTANT:
rE =
Required Return on Equity
for
Shareholders
=
(DIV1 / Po) + g = Dividend Yield +
Capital Gains Yield.
Note:
DIV1 is expected future Dividend NEXT
year. Po is price THIS
year.
·
Earnings Approach: Po = (EPS /
rE)
+ PVGO.
PVGO = NPV1/(rE -
g) =[-Io +(C/rE
)] / (rE -g)
Io = Value of Reinvestment = Pb x
EPS where Pb=
Plough back = 1 -
Payout
= 1 - (DIV/EPS)
·
Shareholders' Required ROR (=
rE)
vs. ROE (= NI / Equity)
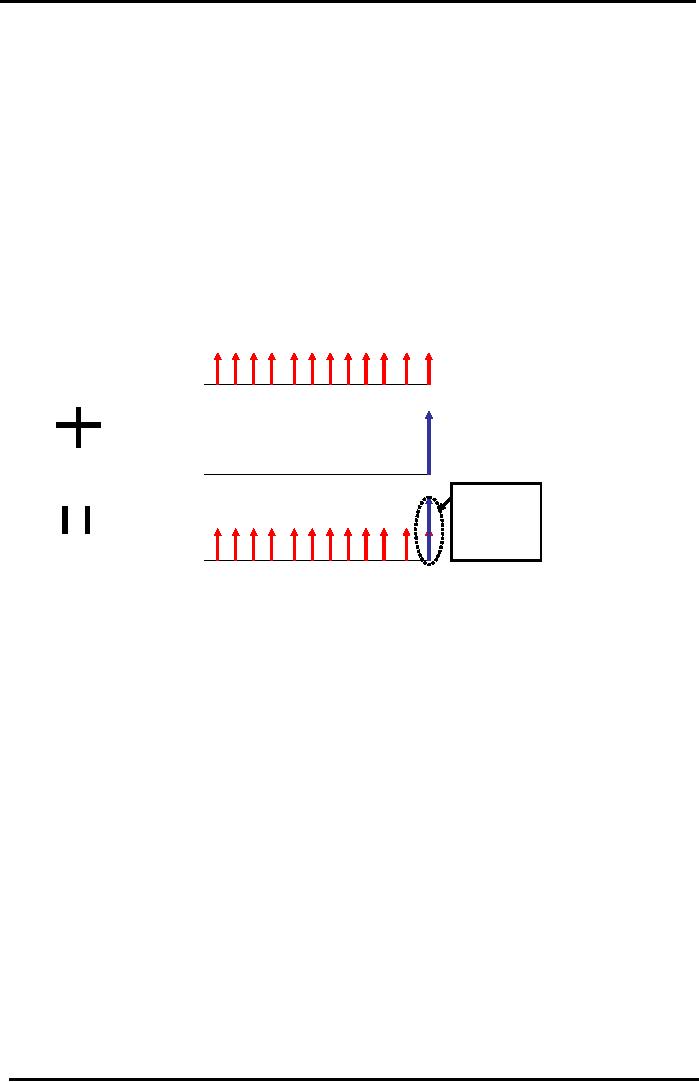
Bond
Cash Flow Diagram
Savings
Certificate Example
Rs
1,000
Coupon
Annuity :
(Monthly)
Time
(Months)
12
01
2
6
Rs
100,000
Par
Receipt :
(at
Maturity)
0
12
2
Cash Flow
Arrows
at
SAME
point in
time
can be
Combined
added.
Time
(Months)
12
Cash
Flow Diagram 0 1
2
6
4-
Risk and Return
Securities
·
Single Stock Risk = Standard
Deviation
Single
Stock Return: measured
by Share Price or Capital Gain
or
Return
(rE)
Single Stock Risk = Standard
Deviation = Sq. Root of
Variance in the
Expected
Return
Total Risk
=
Diversifiable (Company Specific)
Risk + Market Risk
·
Portfolio
Theory and CML
Portfolio Return - Weighted
Average Formula
Portfolio Risk: Risk
Matrix , Covariance of each stock
with entire
Market
, Correlation Coefficient
Risk Return Graph:
Hook-shaped Curve, Efficient
Frontier, T-Bill
Portfolio
and CML
Portfolio of Stocks Return:
Weighted Average
Formula.
2-Stock
Portfolio's Expected Return
=
rP * = xA
rA +
xB rB
Portfolio Risk: Measured by Sigma P
(standard deviation).
2
Stocks:
P
= XA2 σ
A 2 + XB2
σ
B 2 + 2 (XA
XB σ
A σ
B ρ
AB).
188
Financial
Management MGT201
VU
Risk
Matrix , Covariance of each stock
with entire Market ,
Correlation
Coefficient
Risk
Return Graph for
Portfolio of Stocks
Hook-shaped
Curve: possible to
reduce risk and raise
return
together
Efficient
Frontier shows
all possible efficient
portfolios
"Risk
Free" T-Bill Portfolio is
always available to all
investors
CML
connects Risk Free Return
and Tangent to Efficient
Frontier
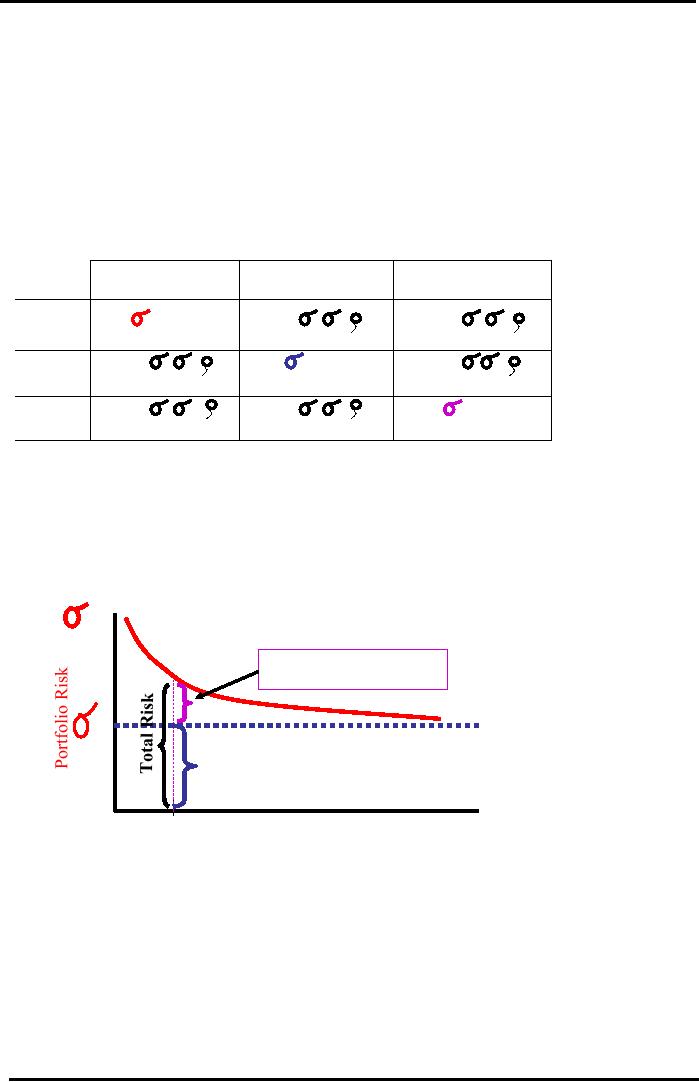
3-Stock
Portfolio Risk Formula
RISK
MATRIX
S
to ck A
S
to ck B
S
to ck C
S
to ck X A2
A 2
XA
XB
XA
XC
A
B
AB
A
C
AC
A
X
B2
2
S
to ck X
B
X A
B
XB
XC
A
BA
B
B
C
BC
B
X
C2
2
S
to ck X C
X A
C
XC
XB
A
CA
C
B
CB
C
C
Portfolio
Size vs Risk Graph
P
Unique
or
Diversifiable
or
Specific
or Non-Systematic
Risk
M
Market
or Systematic or
Non-
Diversifiable
or Beta
Risk
=
Minimum
Possible Portfolio Risk
n
7
20
40
Number
of Investments (Stocks) in the
Portfolio
Note:
About
100%
of the Diversifiable Risk (and
50%
of the Total
Risk)
can be removed by Diversification across 40
stocks.
Just
7
carefully
chosen Un-Correlated Stocks might be
enough to remove
30%
of the Total Risk.
·
CAPM
and SML -Efficient Markets, Beta,
Non-diversifiable Market
Risk,
Risk
Premium, Required ROR on Equity
(rE =
rRF + (rM
rRF)Beta)
·
CV (Coefficient of Variation) =
Risk / Return
Criterion
combines BOTH Risk and
return in deciding which is the
Best Investment
(Capital
Budgeting)
189
Financial
Management MGT201
VU
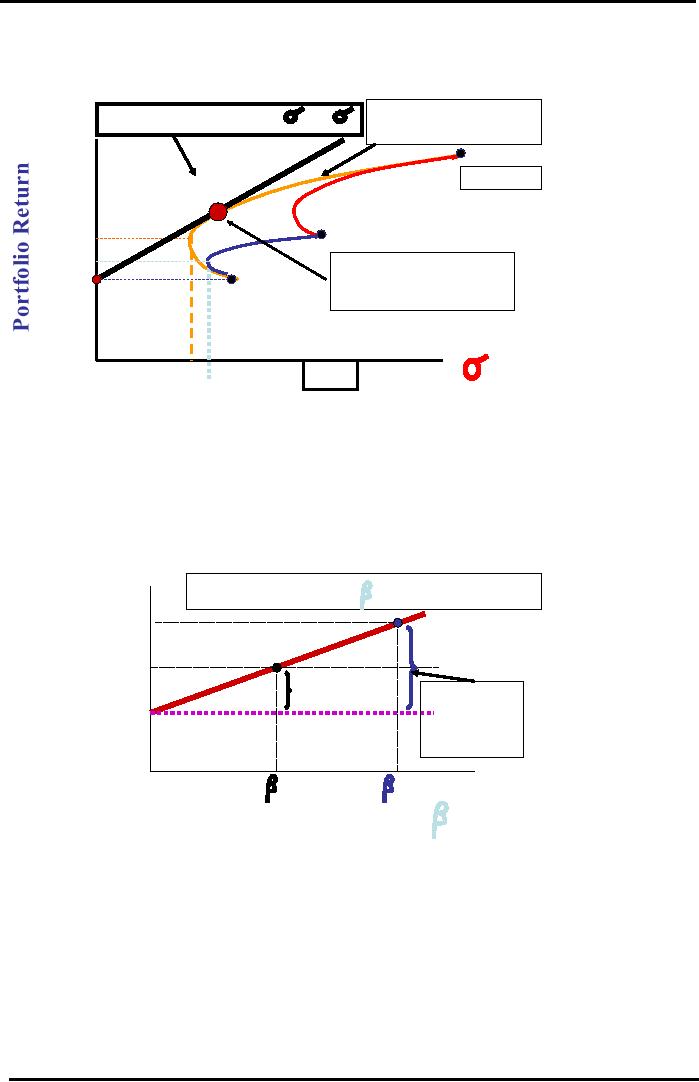
Portfolio
Efficient Frontier & CML -
Important
P
Efficient
Frontier for
rP* =
rRF + [ (rM
- rRF) / M
]
rP*
3-Stock
Portfolio
e
Lin
30%
t
rke
Stock
C
a
lM
"The
Parachute"
a
pit
Ca
Stock
A
20%
Optimal
Portfolio Mix
(50%A,
30% B, 20%C) if
10%=
Stock
B
rRF
Risk
Free T-Bill ROR =
10%
40%
20%
2.5%
P
Portfolio
with Negative
Portfolio
Risk
3.4%
or
Zero Correlation
Coefficient
Security
Market Line (SML)
ALL
Efficient
Stocks in
Efficient Markets
Important
Required
rA =
rRF +
(rM -
rRF )
.
IMPORTANT
Return
(r*)
A
rA= 30%
ne
i
et
L
rk
a
ty
M
rM=
20%
Market
Risk
uri
Sec
Premium
for
Risky
Stock A's
Avg
Stock = 10%
rRF= 10%
Total
Risk
Premium
=
30-10
= 20%
A
=+ 2.0
M
=+ 1.0
Beta
Risk (
)
190
Financial
Management MGT201
VU
Combined
Risk & Return
Graphical
Comparison of
Investments
T-Bill
B: Low
Risk
&
Low Return
Project
C:
High
Risk
B
Risk
& High Return
Risk
C
Exp
Return C
Exp
Return B
Rate
of Return ( r ) %
Entire
Firm
·
Return - ROA = (NI + Interest) /
(D+E) or ROE = NI / E
·
Risk - Standard Deviation in ROE
(stand alone), FIRM BETAS
(market Risk)
·
Firm's Overall Level of
Risk = Business Risk +
Financial Risk
Business Risk caused by
changes in price and cost of
raw materials and
products
and Operating Leverage
Business Risk and Operating
Leverage
(OL = Fixed Costs /
Total Cost). OL can be good if
Sales > Breakeven
Point
Financial Risk, Financial
Leverage:
Financial Risk caused by
Financial Leverage or
Debt
(FL = Debt / Total
Assets = D / (D+E)). FL can be
good if EBIT / Total
Assets
> Cost of Debt
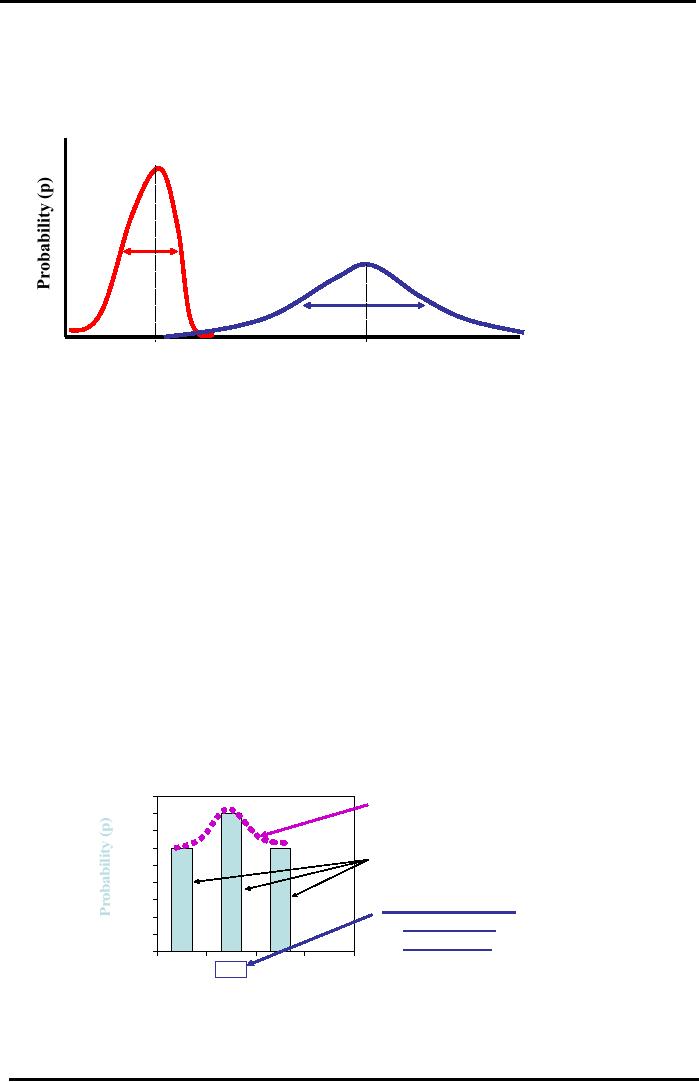
Probability
Distribution
Many
Possibilities for Forecasted Returns
of
Single
Stock Uncertainty & Risk
"BELL"
0.45
Curve
0.4
0.35
0.3
Possible
0.25
Outcomes
0.2
0.15
"Expected
ROR"
0.1
or
Most Likely
0.05
or
Mean ROR =
0
10%
-20
10
40
Rate
of Return After 1 Year < r
>
5-
Capital Structure and Corporate
Financing - Long Term
LIABILITIES Side of Balance
Sheet
191

Financial
Management MGT201
VU
Maturity
Matching or Hedging Principle
of
Financing Important
Value
(Rs)
Spontaneous
Financing
ie.
A/c
Receivables
Spontaneous
Current
Short
Term
Assets
Loans
Temporary
Current Assets
Permanent
Financing
ie.
Equity & Long
Term
Loans
/ Bonds
Fixed
or Permanent Assets :
Life
/ usage more than 1
Yr
Time
Buy
Permanent Fixed Assets with
Permanent Financing. IMPORTANT
Objective:
To maintain best balance of
Debt & Equity
Capital
Cost
vs. Required Return- Net
Proceeds, After-Tax Cost of
Debt , Source of
Equity
·
Compute Cost using Net
Proceeds: NP = Market Price (Po)
Issuance Costs
·
After-Tax Cost of Debt:
rD (1-Tc)
·
Source of Equity: Retained Earnings
cheaper than Fresh Stock
Issuance in
Stock
Market
WACC (%) - Use MARKET
VALUES of Debt and
Equity,
FIRMS TRY TO MINIMIZE THEIR COST OF
CAPITAL
·
WACC = rDxD +
rExE. IMPORTANT
FORMULA
rD and
rE are "Costs" of Debt &
Equity respectively. INTEREST is
the
cost
paid by Firm to Investors
who hold Firm's Debt.
DIVIDEND is
cost
paid by Firm to Investors
who hold Firm's
Equity.
xD and
xE based on MARKET VALUES of
Debt and Equity,
Firm Value = Value =
Debt + Equity
=
Share Price x Number of Shares
Outstanding
Two
ways to compute:
NI
(or EBIT) Approach (E = NI /
rE
V
= E+D) and Tax Shield (or
NOI) Approach (VL =
VU + Tc D
EL rE
WACC)
VL
is Value of Levered Firm. VU is
Value of Un levered Firm. Tc is
Corporate Tax %. D is
Debt.
192
Financial
Management MGT201
VU
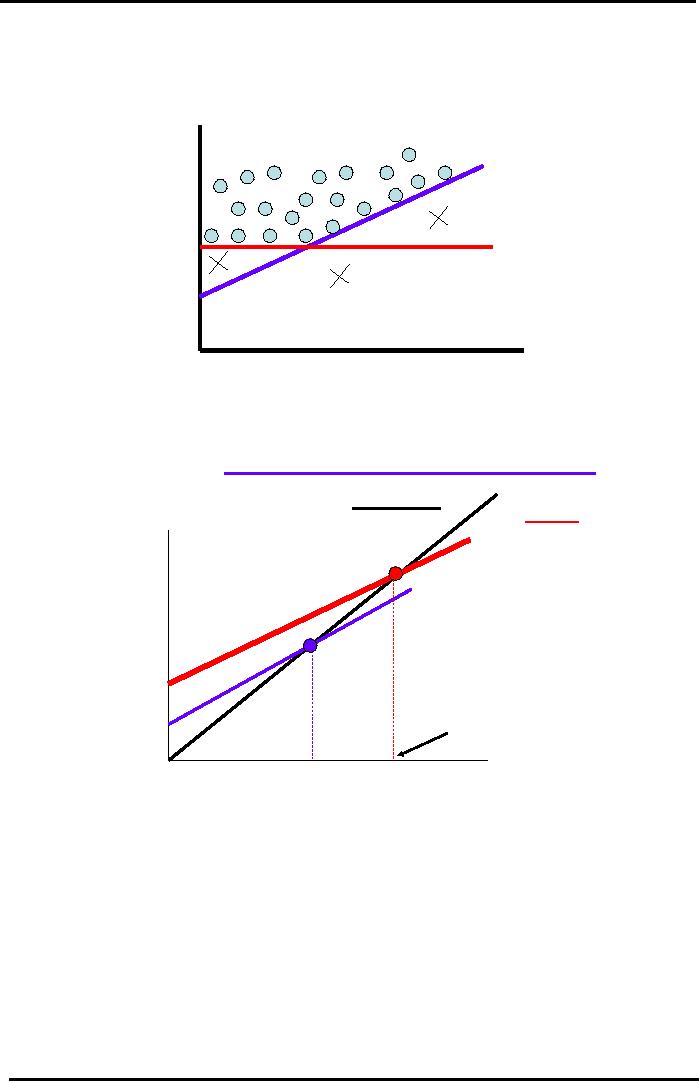
SML
WACC Graph
Important
Required
FEASIBLE
REGION (where
SML
Line
ROR
rCE (%)
IRR
of investment or project
(EXTERNAL
is
more than SML
and
MARKET
WACC)
criterion)
IRR
< SML
1
WACC
Firm's
own
WACC
3
IRR
< WACC
2
(INTERNAL
rRF
=
T-
IRR
<WACC < SML
Bill
rate
criterion)
Beta
Risk
Visualizing
Operating Leverage
(OL)
Impact
on Breakeven Point & Capital
Budgeting
Revenues
&
Sales
REVENUE Line
Total
COST Line
Costs
(Rupees)
Company
A:
OL
= Fixed Cost /Total
Cost
Higher
OL So
Higher
Breakeven
Total
COST Line
Company
B
Breakeven
A is Higher.
A
is More Risky. As
Fixed
Costs A
long
as Sales >
Breakeven,
OL is Good.
Fixed
Costs B
Sales
Quantity
(#
of Units)
QB*
QA*
193
Financial
Management MGT201
VU
Visualizing
Financial Leverage
(FL)
Impact
on ROE & Capital Structure
LEVERED
(Debt
ROE
(%)
&
Equity) Firm:
77%
Higher
Slope.
FL
IS GOOD IF EBIT /
ROE
more
ASSETS
> COST OF
sensitive
to
42%
DEBT.
changes
in EBIT
35%
= <ROE>L
UN-LEVERED
(100%
Equity)
21%
= <ROE>UL
Firm.
Safer
Capital
Structure
3.5%
at
Low EBIT's
0%
EBIT
(Rs)
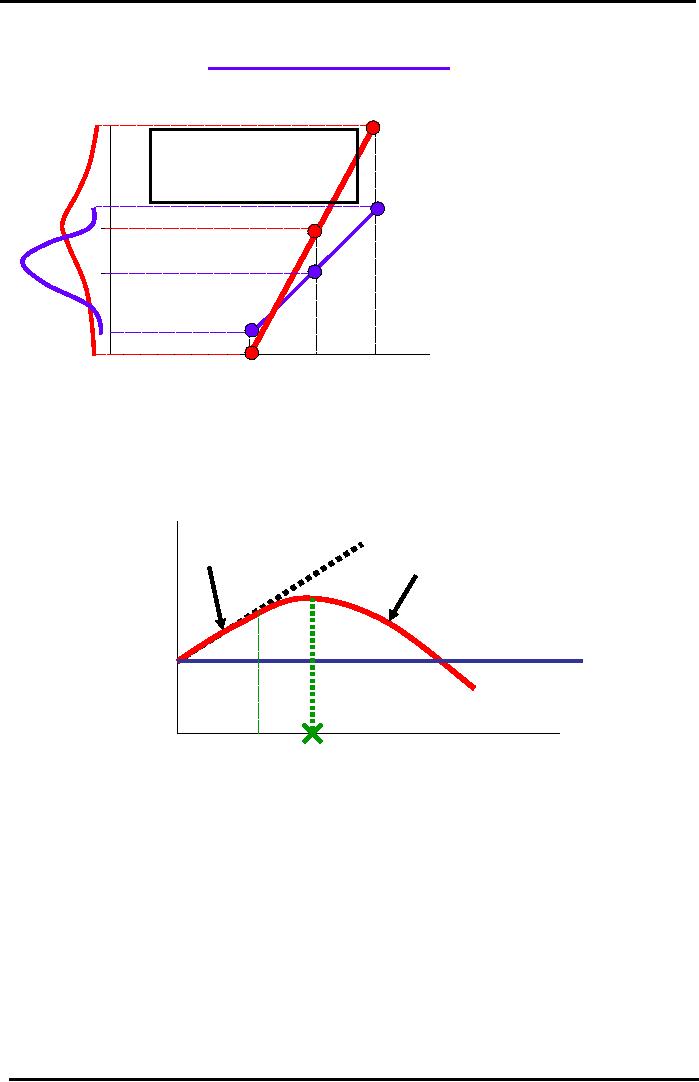
Tradeoff
Theory Graph
LeveSlahgeeve&geOiptiImeaTaxCapital
Structure
rig
tly L ra d F rm: nter st l
Shield
Benefit. Total Return to
Investors
Excessively
Leveraged Firm:
Rises
so Stock Value Rises.
Total
Return
Threat
of Bankruptcy has
Real
=
Net Income (paid to
Shareholders) +
Value
of
Costs.
Less Investor
Interest
(paid to Debt
Holders)
Firm
or
Confidence
and Lower Share
Price.
Price
of
Stock
Firm
Remains 100%
Equity
(Un-Levered)
Financial
Leverage =
OPTIMAL
Capital
Debt
/ Assets =
Structure
- MAXIMUM
D/(D+E)
VALUE
& MINIMUM
WACC
Capital
Structure Theories:
Tradeoff Theory: Little
Debt reduces WACC. High
Debt Bankruptcy Risk
Signaling Theory: Raising
New Debt carries Positive
signal to market. Fresh
Equity
carries
Negative Signal
Agency Theory: Managers'
Personal Motives clash with
Shareholders' (Owners')
Interest
Capital
Structure Models
Miller
Modigliani
(Without
Taxes: rE = WACCU
+ (D/E
(WACCU
-rE),
194
Financial
Management MGT201
VU
Pure
MM Theory - Ideal Markets
WAFinancialGraph
- Important
CC
Risk.
Cost
of
rE =
Cost of Equity
Higher
Required
Capital
Return
on Equity.
=WACC+D/E
(WACC-rD)
Higher
rE
(%)
WACC
=
rE
rDxD
+ rExE
rD =
Cost
rD
of
Debt
Debt
/ Equity = A
Measure
of Leverage =
100%
D/E
= xD / ( 1- xD
)
Equity
Firm
Market
Value of Firm = V = EBIT /
WACC. As Debt Increases,
Risk Increases so rD and rE
and
WACC
should increase. BUT Debt is
cheaper than equity (recall
Risk Theory) so as
Debt
Increases,
WACC should decrease! Net
Effect is No Change in WACC and No
Change in
Value.
CAPITAL BUDEGTING is Independent of
Corporate Finance / Capital
Structure.
DEBT
HAS NO BEARNING ON A FIRM'S
VALUE!
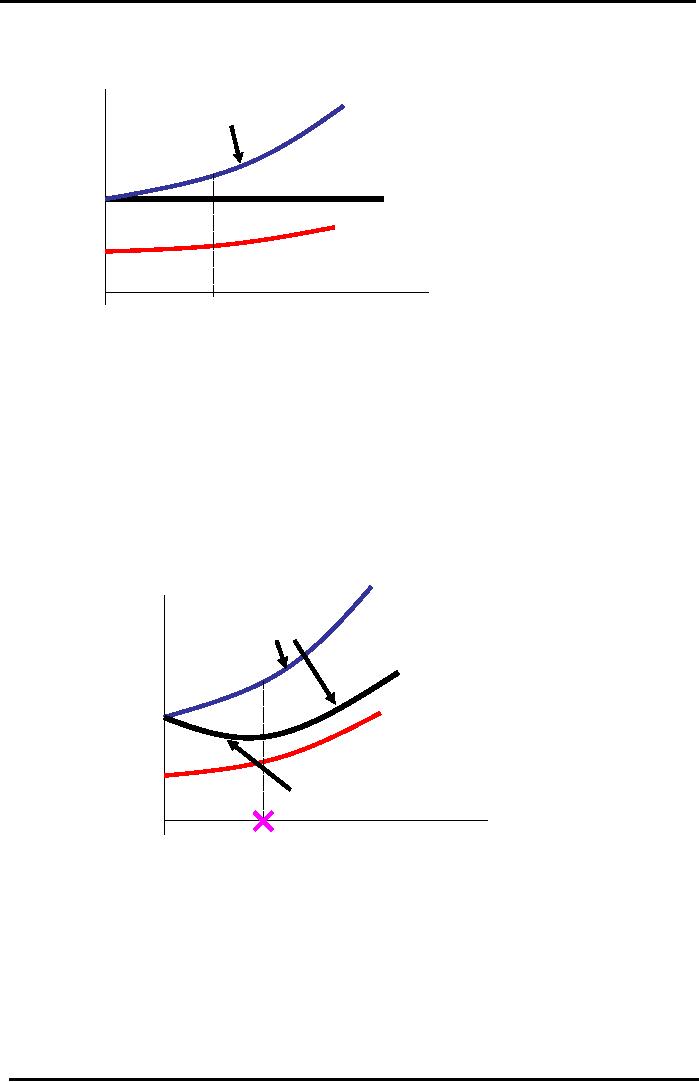
Traditionalist
Theory - Real Markets
WACC
Graph - Important
Bankruptcy
Risk
&
Cost
of
Costs.
Higher
Capital
Required
Return on
rE,L =
Cost of Equity =
Equity.
Steeper Rise.
(%)
WACCU +
xD(WACCU
-rD)
(1-TC)
WACCL =
rD(1-Tc)xD +
rExE
rE
rD =
Cost of Debt
rD
Interest
Tax Shield
Advantage
Debt
/ Equity = A
100%
Optimal
Capital
Measure
of
Structure
= Minimum
Equity
Leverage
= D/E = xD
WACC
and
Firm
Maximum
Value
/
( 1- xD )
Note:
xD = D / (D+E)
Traditionalists
Formulas (WACCL =
rD (1-Tc) xD
+ rExE)
FIRM'S
VALUE = EBIT / COST OF CAPITAL. MORE
LEVERAGE (OR DEBT)
MEANS
MORE RISK WHICH MEANS
HIGHER COST OF CAPITAL AND
THEREFORE
LOWER VALUE
Traditionalist
View is based on Practical Reality.
Leverage provides Interest
Tax
Savings
(or Shield) but also
Increases Financial Risk.
Excessive Leverage leads
to
Bankruptcy
Risk. Increases in Risk will
Change Value of Firm and
WACC.
195
Financial
Management MGT201
VU
Practical
Capital Structure Management- Target
Ratios i.e. TIE of 2.5. TIE
and Debt /
Capitalization
Dividend
Policy Theories - MM, Signaling, and
Agency,
DIV1
= DIVo (1+g) , g = Pb x ROE , If ROE < rE then
better to give Dividends
than to
Retain
Earnings
MM: Dividend Policy and Debt
are Irrelevant to a Firm's
Value. What matters
is
the Cash Flows from
Underlying Assets and NOT
how you divide or split
up
the
Cash Outflows i.e.
Dividends. IMPORTANT.
Signaling Theory: Issuing
New Debt (or taking
new loan) gives positive
signal
to
Investors. Issuing Fresh
Stock / Equity in Stock
Market gives negative
signal.
Agency Theory: Management's
Personal Motives often clash
with Owner /
Shareholders
Objectives
Impact
of Dividend Announcement and Ex-Dividend
Date on Share Price
Dividend
Payout restricted by Capital Expenditure
Requirement, Target Debt
Ratio, and
restrictions
placed by Debt Contracts
DIV1
= Future Dividend
If
ROE < rE then better to pay
out Dividends rather than keep
cash as Retained Earnings
because
company is unable to generate an ROE high
enough to satisfy the
Shareholder's
Required Return (rE).
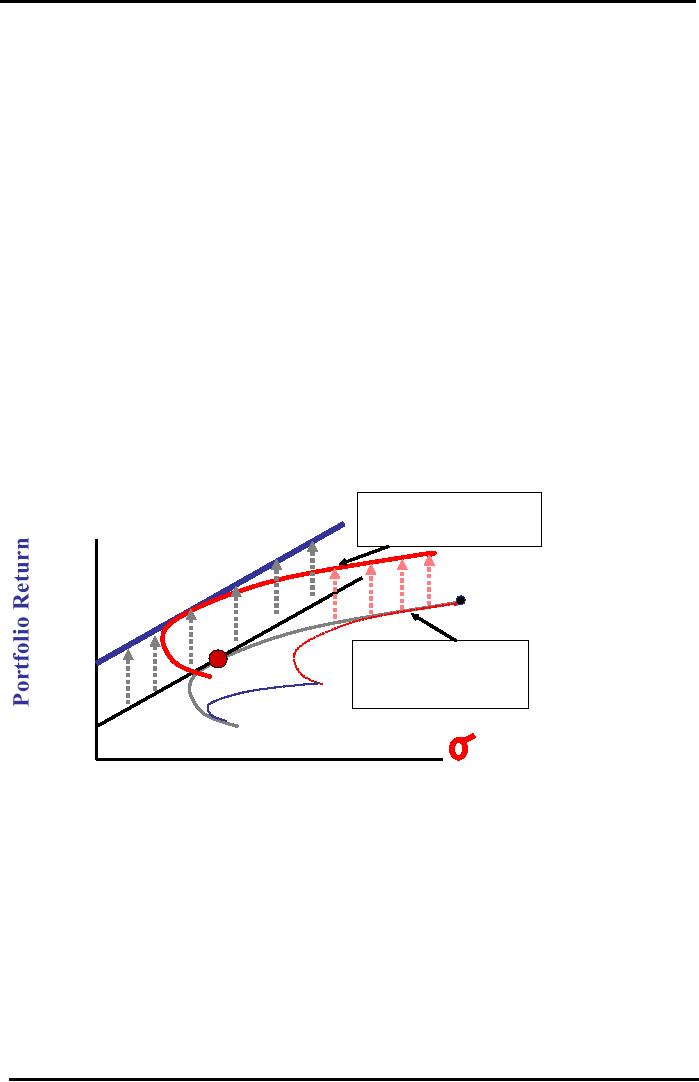
Global
Investing Makes the
Efficient Frontier
and
the
CML (Capital Market Line)
Rise Up
Higher
Return for Same Level of
Risk
Efficient
Frontier (for
)
rP*
nts
Global
Investments)
e
stm
ve
l
In
ba
s)
ent
o
Gl
stm
r
e
(fo
Inv
ML
y
ntr
C
u
Co
Efficient
Frontier
le
ing
S
(for
Investment in
r
(fo
rRF
L
Single
Country)
CM
P
Risk
Outline
of 4 Minor Areas of FM:
1-
Working Capital and Short
Term Financing
Current Assets Management:
Cash, Marketable Securities,
Inventory.
·
Current Assets necessary
for safe liquidity but
earn no / little return on
cash,
inventory
·
Fat Cat vs. Lean Mean , C/F
Synchronization and Cheques Float
,
Current Liabilities and Short
Term Financing: Accounts Payable and
Short Term Loans.
"Spontaneous"
and unpredictable source of
financing.
Types of Financing
·
Permanent (Equity & Long
Term Loan) vs. Temporary
(Short-Term Loan)
vs.
Spontaneous Financing (Current
Liabilities). IMPORTANT.
196

Financial
Management MGT201
VU
·
Hedging
Principle or Self-Liquidating Debt or
Maturity Matching:
Buy
Permanent
Assets with Permanent
Financing. IMPORTANT.
2-
Lease Financing
Financing Lease, Operating
Lease, Sale & Lease
Back
Ownership vs. Control
Valuation of Lease Finance: NAL
(modified NPV) and IRR
(%)
3-
Mergers and Acquisitions (M&A) and
Valuation of Firms
Mergers, Acquisitions,
LBO's
Merger Valuation using
DCF (NPV) or MMA Short-cut
Formulas
Impact of Merger on Share Price and
Value of Firm
4-
International Finance
Impact on Major Areas of FM:
Capital Structure and Corporate
Financing, Financial
Accounting,
Capital Budgeting
Foreign Exchange (F/x)
·
Markets: Spot, Forward, Futures,
Options
·
Relationships: PPP, Fischer Effect,
IRP
·
European Convention & Cross
Rates
----------------------------THE
END----------------------
197
Table of Contents:
- INTRODUCTION TO FINANCIAL MANAGEMENT:Corporate Financing & Capital Structure,
- OBJECTIVES OF FINANCIAL MANAGEMENT, FINANCIAL ASSETS AND FINANCIAL MARKETS:Real Assets, Bond
- ANALYSIS OF FINANCIAL STATEMENTS:Basic Financial Statements, Profit & Loss account or Income Statement
- TIME VALUE OF MONEY:Discounting & Net Present Value (NPV), Interest Theory
- FINANCIAL FORECASTING AND FINANCIAL PLANNING:Planning Documents, Drawback of Percent of Sales Method
- PRESENT VALUE AND DISCOUNTING:Interest Rates for Discounting Calculations
- DISCOUNTING CASH FLOW ANALYSIS, ANNUITIES AND PERPETUITIES:Multiple Compounding
- CAPITAL BUDGETING AND CAPITAL BUDGETING TECHNIQUES:Techniques of capital budgeting, Pay back period
- NET PRESENT VALUE (NPV) AND INTERNAL RATE OF RETURN (IRR):RANKING TWO DIFFERENT INVESTMENTS
- PROJECT CASH FLOWS, PROJECT TIMING, COMPARING PROJECTS, AND MODIFIED INTERNAL RATE OF RETURN (MIRR)
- SOME SPECIAL AREAS OF CAPITAL BUDGETING:SOME SPECIAL AREAS OF CAPITAL BUDGETING, SOME SPECIAL AREAS OF CAPITAL BUDGETING
- CAPITAL RATIONING AND INTERPRETATION OF IRR AND NPV WITH LIMITED CAPITAL.:Types of Problems in Capital Rationing
- BONDS AND CLASSIFICATION OF BONDS:Textile Weaving Factory Case Study, Characteristics of bonds, Convertible Bonds
- BONDS VALUATION:Long Bond - Risk Theory, Bond Portfolio Theory, Interest Rate Tradeoff
- BONDS VALUATION AND YIELD ON BONDS:Present Value formula for the bond
- INTRODUCTION TO STOCKS AND STOCK VALUATION:Share Concept, Finite Investment
- COMMON STOCK PRICING AND DIVIDEND GROWTH MODELS:Preferred Stock, Perpetual Investment
- COMMON STOCKS RATE OF RETURN AND EPS PRICING MODEL:Earnings per Share (EPS) Pricing Model
- INTRODUCTION TO RISK, RISK AND RETURN FOR A SINGLE STOCK INVESTMENT:Diversifiable Risk, Diversification
- RISK FOR A SINGLE STOCK INVESTMENT, PROBABILITY GRAPHS AND COEFFICIENT OF VARIATION
- 2- STOCK PORTFOLIO THEORY, RISK AND EXPECTED RETURN:Diversification, Definition of Terms
- PORTFOLIO RISK ANALYSIS AND EFFICIENT PORTFOLIO MAPS
- EFFICIENT PORTFOLIOS, MARKET RISK AND CAPITAL MARKET LINE (CML):Market Risk & Portfolio Theory
- STOCK BETA, PORTFOLIO BETA AND INTRODUCTION TO SECURITY MARKET LINE:MARKET, Calculating Portfolio Beta
- STOCK BETAS &RISK, SML& RETURN AND STOCK PRICES IN EFFICIENT MARKS:Interpretation of Result
- SML GRAPH AND CAPITAL ASSET PRICING MODEL:NPV Calculations & Capital Budgeting
- RISK AND PORTFOLIO THEORY, CAPM, CRITICISM OF CAPM AND APPLICATION OF RISK THEORY:Think Out of the Box
- INTRODUCTION TO DEBT, EFFICIENT MARKETS AND COST OF CAPITAL:Real Assets Markets, Debt vs. Equity
- WEIGHTED AVERAGE COST OF CAPITAL (WACC):Summary of Formulas
- BUSINESS RISK FACED BY FIRM, OPERATING LEVERAGE, BREAK EVEN POINT& RETURN ON EQUITY
- OPERATING LEVERAGE, FINANCIAL LEVERAGE, ROE, BREAK EVEN POINT AND BUSINESS RISK
- FINANCIAL LEVERAGE AND CAPITAL STRUCTURE:Capital Structure Theory
- MODIFICATIONS IN MILLAR MODIGLIANI CAPITAL STRUCTURE THEORY:Modified MM - With Bankruptcy Cost
- APPLICATION OF MILLER MODIGLIANI AND OTHER CAPITAL STRUCTURE THEORIES:Problem of the theory
- NET INCOME AND TAX SHIELD APPROACHES TO WACC:Traditionalists -Real Markets Example
- MANAGEMENT OF CAPITAL STRUCTURE:Practical Capital Structure Management
- DIVIDEND PAYOUT:Other Factors Affecting Dividend Policy, Residual Dividend Model
- APPLICATION OF RESIDUAL DIVIDEND MODEL:Dividend Payout Procedure, Dividend Schemes for Optimizing Share Price
- WORKING CAPITAL MANAGEMENT:Impact of working capital on Firm Value, Monthly Cash Budget
- CASH MANAGEMENT AND WORKING CAPITAL FINANCING:Inventory Management, Accounts Receivables Management:
- SHORT TERM FINANCING, LONG TERM FINANCING AND LEASE FINANCING:
- LEASE FINANCING AND TYPES OF LEASE FINANCING:Sale & Lease-Back, Lease Analyses & Calculations
- MERGERS AND ACQUISITIONS:Leveraged Buy-Outs (LBOs), Mergers - Good or Bad?
- INTERNATIONAL FINANCE (MULTINATIONAL FINANCE):Major Issues Faced by Multinationals
- FINAL REVIEW OF ENTIRE COURSE ON FINANCIAL MANAGEMENT:Financial Statements and Ratios