 |

Financial
Management MGT201
VU
Lesson
23
EFFICIENT
PORTFOLIOS, MARKET RISK AND CAPITAL
MARKET LINE (CML)
Learning
Objectives:
After
going through this lecture,
you would be able to have an
understanding of the following
topics.
·
Efficient
Portfolios,
·
Market
Risk & CML
First
we recap the important concepts
which we have studied in previous
lectures. Portfolio theory
is
looking at the relationships between the
risk and return for
portfolios, especially for
diversified
portfolios.
Total
Stock Return = Dividend Yield +
Capital Gain
Yield
You
should recall this from the
Gordon formula that we
learnt in the share
valuation.
We
spoke about the total risk
for the stock and we said that it is
equal to the company's risk
plus the
market
risk.
Total
Risk = Diversifiable Risk + Market
Risk
We
mentioned that on the basis of
experimental studies that if we
invest in many stocks which
are
not
correlated to each other then it is
possible to reduce overall risk
for your investment as a
whole. We
called
this portfolio or collection of
stocks. 7
Stocks
are a good number for
diversification & 40
Stocks
are
enough for eliminating
Company Risk & Minimizing
Total Risk.
Now,
in the portfolio theory model
which we are going to
discuss the major assumption is that
the
rational
investors in the market place maintain
diversified portfolios. We discuss in the
previous lecture
about
calculating expected return on the
portfolio and we mentioned
that it is simply the
weighted
average
of return of each stock in the portfolio.
The formula
2-Stock
Portfolio's Expected Return =
rP * = xA
rA +
xB rB
2-Stock
Portfolio Risk
Formula
Sd=
√
X
A2
σ
A
2 +XB2
σ
B
2 + 2 (XA
XB
σ
A
σ
B
AB)
It
is mentioned in the previous lecture
that we can calculate the risk of
larger portfolio using
the
matrix
approach
Matrix
for Calculating Portfolio
Risk: Covariance Terms
(Non-Diagonal Boxes) measures
(1)
Magnitude
of movement (Standard Deviation) and
(2) Closeness
of movement (Correlation
Coefficient)
between
any two stocks in the
portfolio.
3-Stock
Portfolio Risk
Formula
3
x 3 Matrix Approach
Stock
A
Stock
B
Stock
C
XA2
2
Stock
XA
XB
XA
XC
A
A
B
AB
A
C
AC
A
XB2
2
Stock
XB
XA
XB
XC
B
A
BA
B
B
C
BC
B
XC2
2
Stock
XC
XA
XC
XB
C
A
CA
C
B
CB
C
C
To
compute the Portfolio
Variance for a
3-Stock Portfolio, just add up
all the terms in
every
box.
To compute the Portfolio Risk (Standard
Deviation), simply take the
Square Root of the
Variance.
98

Financial
Management MGT201
VU
You
can extend this Matrix
Approach to calculate the Risk
for a Portfolio consisting of
any
number
of stocks.
·Terms in Boxes on Diagonal
(Top Left to Bottom Right)
are called "VARIANCE"
terms
associated
with
individual magnitude of risk
for each stock.
·Terms in all other
(or NON-DIAGONAL) Boxes are
called "COVARIANCE"
terms
which account
for
affect of one stock's movement on another
stock's movement. These represent the
magnitude or size
of
the movement between the two stocks.
There are two parts
for this covariance
terms
·One of the two covariance
terms for two stock
portfolios is XA
XB
σ
A
σ
B
AB.
Both
standard deviation and covariance
are important to calculate the size of
the movement of
both
stock A and B. In other words, if covariance is large
then a pair of stock moves a
lot and they
also
move
together. Correlation coefficient is the
measure that how closely
they move Standard
deviation
tells
us that how much they
move.
We
have discussed in the previous lecture
about the efficient portfolio
map and the efficient
frontier.
If we plot the risk and return
for the portfolio whose
correlation coefficient is negative
then we
come
up with a hook shape curve
and it tells us that it is possible to
increase the return on portfolio &
at
same
time reduce the risk which
is ideal because the objective is to
maximize the return and to
minimize
the
risk. But in conclusion of last
lecture we said that there is a
whole line with infinite
number of points
that
represents an efficient frontier and
every single combination or
mix of the portfolio on this
line
represents
an efficient combination. But
this does not help us
very much why because we do
not know
which
one of these mix is the
best. So, the first ting we
are going to figure out is
that what optimal
mix
of
the portfolio is. The starting
point to figure out this is
to realize that if you have a
portfolio of stocks
then
every investor have access to another
portfolio and that portfolio
is the portfolio of T bills and we
are
going to assume that every
body have the option of investing in the
T-Bills that give them the
risk
free
rate of return. For Pakistan, we consider
that figure to be 10%.So;
this is the starting point to
figure
out
that what is the optimal
portfolio mix is. The
realization that if your
portfolio is giving you
the
return
which is less then risk
free rate of return then why
would you investing in that
portfolio and you
would
choose to invest in T-bills. By
using this understanding,
let's take another look on
risk and return
portfolio
frontier model and see that
how we can use this
fact to find the optimal
portfolio mix and we
take
look at 3 stock portfolio consisting of stock A, B
and C and added to that we
will give ourselves the
option
of investing in a T-bill portfolio
wherever stocks are not
providing sufficient return.
So, if we
look
at the e efficient portfolio map
you will see that
Portfolio
risk is on X- axis and the
portfolio
return
on Y- axis.
99
Financial
Management MGT201
VU
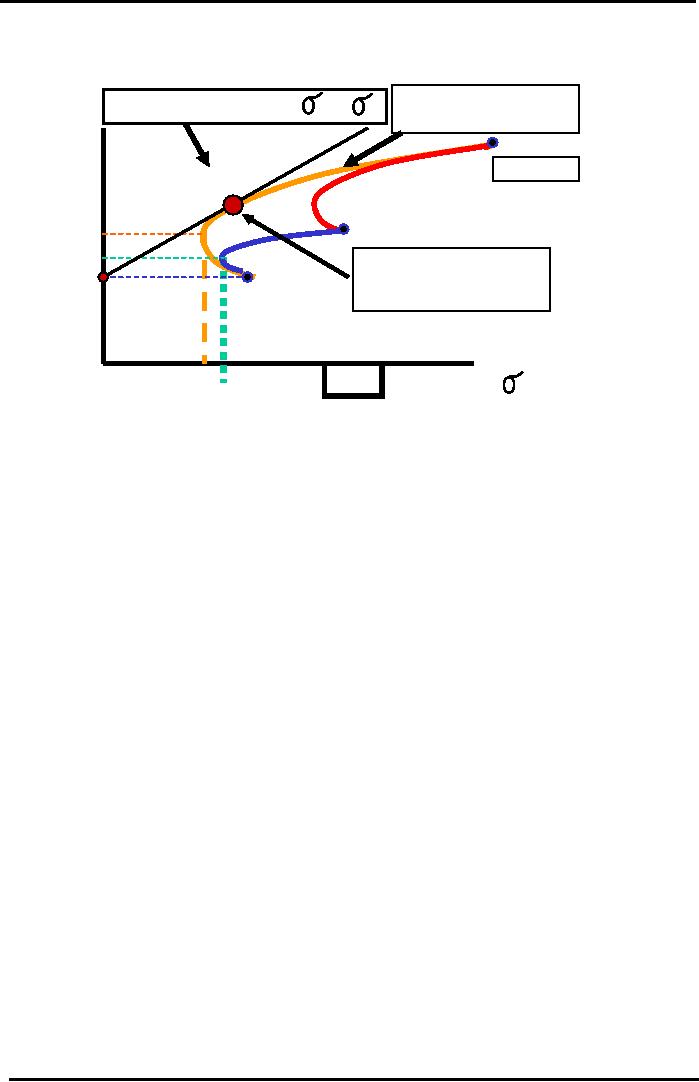
Picking
Most Efficient Portfolio
Capital
Market Line (CML) & T-Bill
Portfolio
P
Efficient Frontier
rP* =
rRF + [ (rM
- rRF) / M
]
rP*
for
3-Stock Portfolio
Portfolio
Capital
Market Line
Stock
C
Return
30%
"The
Parachute"
Stock
A
20%
Optimal
Portfolio Mix
(50%A,
30% B, 20%C) if
10%=
Stock
B
rRF
Risk
Free T-Bill ROR =
10%
40%
20%
2.5%
P
Portfolio
with Negative
3.4%
Portfolio
Risk
or
Zero Correlation
Coefficient
The
efficient frontier for the 3 stock
portfolio is the overarching largest hook
shaped curve and
also
remember that closed
combination of the all the hook
shaped curves forms a
parachute like
shape
and any one of the points
inside that parachute is a possible
mix or combination of
different
stocks
that you can have in your
portfolio. However, the most
efficient combinations lie on
the
efficient
frontier line and the next
logical step we are going to
take is to figure out what
is the best
point
on the efficient frontier. As it is
mentioned that we will
assume that we have access to T-
bill
portfolio
which offers a risk free
rate of return of 10% and that
will be the starting point of
our
capital
market line (CML).wherever
this line if you extend
from the 10 % point from
y-axis touches
the
efficient frontier line and is tangent to
it is the point for the "Optimal
Portfolio Mix." This
point
is
shown as a large dot in the above figure.
If you look at the location of
this large dot on the
efficient
frontier you can see
that it lies closer to the
Stock B and Stock A. Therefore, there is
larger
percentage
of stock A and B in this optimal
portfolio mix. Approximately, the
optimal portfolio mix
consist
of 50% Stock A, 30% Stock B,
and 20% Stock C. It is important to
remember that we have
the
option of investing in the T-bill
portfolio which offers a
risk free rate of
return
And
the expected rate of return is 10%.Therefore, if the
returns on this portfolio decrease
10%
then
the investor will invest in the
risk free T bills
portfolio. Whichever portfolio
offers lowest
coefficient
of variation is the better portfolio.
The CML represents different
combinations that you
can
pick in the risk free as
well as stock portfolio. Thus CML
represents combination of
efficient
portfolio
in the capital market. It is the
important point remembers
that According to the
Portfolio
Theory,
Efficient Portfolios are
Fully Diversified and they
must lie on the CML Line.
Now, it is
also
possible simply come up with the
equation for the CML.
CML
Equation: rP* = rRF
+
[(rM
- rRF) /
σM] σP
rRF=
risk free rate of
return
rM =
expected rate of return for
the market of all possible
stock
σM
= risk of
the market
σP
= risk of
stock portfolio
The
Expected Return on an Investment in a Common
Share is not guaranteed or certain.
The
Price
and Dividend can vary so we
can guess what the Possible
future Returns (or Outcomes)
might
be
and assign probabilities to
each.
Uncertainty
about Future Expected Return on
Investment gives
rise
to Probability Distribution of Possible
Outcomes. This gives rise to a
Spread of Possible
Future
Returns
which is a measure of the Risk or
Uncertainty or Standard Deviation. We can
apply this
100
Financial
Management MGT201
VU
concept
to the single stock or a portfolio of a
many stocks. When we talk
about the expected return
on
a single stock then we are
saying that it is the combination of the
dividend gain yield and
the
capital
gain yield. When we talk
about the expected return for the
portfolio then we consider
expected
return for each stock in
that portfolio and assign
proportionate amount of weightage
based
on
the fraction of the investment in a
particular stock compare to the total
value of the portfolio.
Furthermore,
the individual risk of every
investment affects the risk of every
other investment in the
portfolio!
The Overall Portfolio Risk
decreases as the number of investments increase up to
the
point
that the Company Specific or
Unique Risk has been
totally eliminated i.e.
About 40
uncorrelated
stocks. In
this Range it is possible to
Increase Return and Reduce
Risk! After
that,
the
Portfolio is assumed to be Fully
Diversified and any additional
investment will only
contribute
to
the Market Risk which can
not be eliminated.
Market
Risk & Portfolio
Theory:
We
can measure that how
market risk varies from one
stock to another based on the Beta's. It
is
mentioned
that when you add newly
stock to the fully diversified portfolio
then the only
contribution
this
new stock is made to the risk of the
existing portfolio is the market
risk because we are
considering
that
company's unique risk has
entirely wiped out by
diversification. If the correlation between
different
stocks
is negative or Zero then
risk and return profile
graph takes on a hook shaped
curve and this hook
shaped
curve is important to understand because
it means that it is possible for
certain combinations of
the
portfolio to both reduce
risk and increase
return.
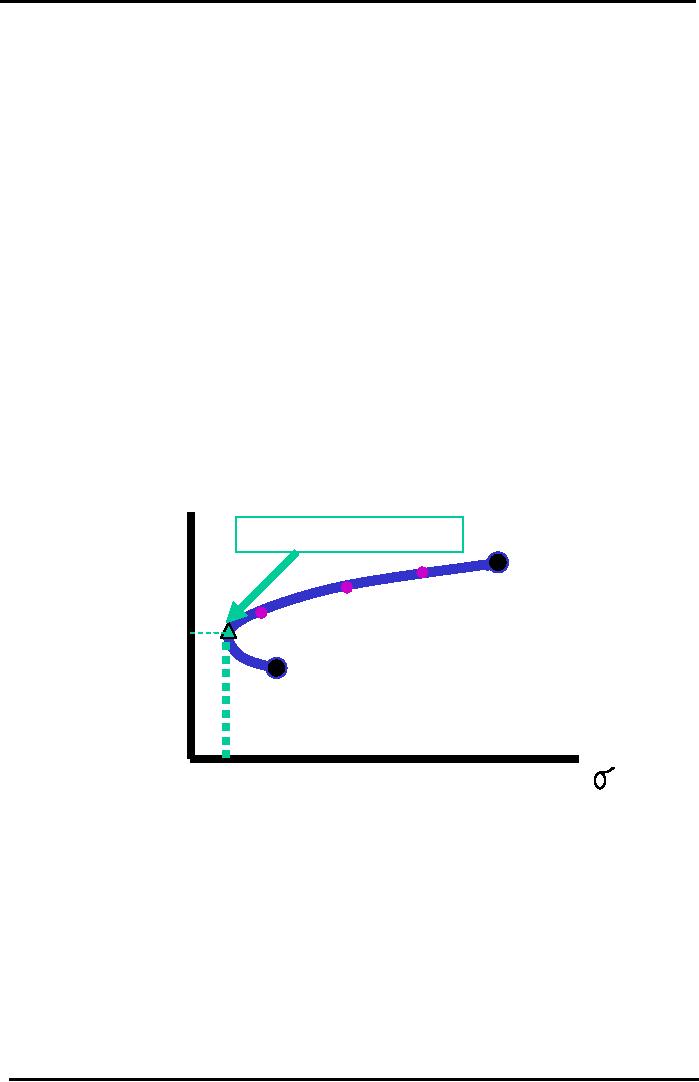
Hook
Shaped Curve
Negative
Correlation Coefficient
Possible
to Get Higher Return AND
LOWER RISK
rP*
Point
of Minimum Risk
Portfolio
20%
Return
Stock
A
(100%
A)
80%A
15%
50%A
13%
30%A
11.5%
15%A
10%
Stock
B
(100%
B)
3.4%
5%
20%
9%
15%
P
Portfolio
Risk
However,
if the correlation coefficient is +ve
then the risk return relationship is
that of
continuous
function which is continuously
rising as return rises the
risk also rises with
it. It is the
fundamental
concept in risk and return
that the investor will not
take on any additional risk
unless
they
compensated by additional return. It is
important to under stand
that when we are talking
about
efficient
capital markets and talking
about the capital market
line we are saying that
efficient
portfolios
in the market all lie on the
capital market line. It
means that if one investor
is only
investing
in the stock A and the other has a
diversified portfolio of 40 stocks and
now he is also
investing
in Stock A then the amount of risk
for both investors will be
different the investor who
is
only
investing in stock A is taking on the
Market risk of the stock as well as the
company's risk
whereas
the other investor is only
taking on the market component risk
for that stock. Rational
Investors
with Diversified Portfolios expect to be
compensated by extra return in
exchange for
taking
on Extra Market
Risk.
You
can NOT expect to receive extra
return (or compensation) for
taking on Company-Specific
Risk
which Rational Investors have
eliminated! The Efficient
Market will only offer
you a Return
101
Financial
Management MGT201
VU
(and
a Share Price) which is the bare
minimum acceptable to Rational
Diversified Investors. This
is
the
Basis of the Capital Asset Pricing
Model (CAPM).
Beta
Concept & CAPM:
Beta:
It
is a tendency of a Stock to move with the
Market (or Portfolio of all
Stocks in the Stock
Market).it
is the building block of
CAPM.
Stock
Risk vs. Stock
Beta:
Stock
Risk:
It
is a statistical spread of possible returns
(or Volatility) for that
Stock
Stock
Beta:
It
is a statistical spread of possible returns
(or Volatility) for that
Stock relative to the
market
spread i.e. spread (or
Volatility) of the fully diversified
market portfolio or
index.
Beta
Coefficients of Individual Stocks
are published in "Beta
Books" by Stock Brokerages &
Rating
Agencies
CAPM:
Capital Asset Pricing
Model.
It
is developed by Professors Sharpe &
Markowitz. He won Nobel Prize in
1990
Market
Risk is the only risk that
is relevant to a Rational Investor
with a Diversified Portfolio
of
Investments.
The Company Specific (or
Unique) Risk is Diversified
Away! Market Risk is
measured
in
terms of the Standard Deviation (or
Volatility) of the Market Portfolio or
Index. Every Stock
Market
develops
an Index comprising of a weighted
average of the highest-volume shares in
that market. This
Index
represents the relative strength of that
Stock Exchange and is considered to be close to a
Totally
Diversified
Portfolio. In reality, no such
Portfolio exists anywhere in the world.
For example the
Karachi
Stock Exchange has the KSE
100 Index.
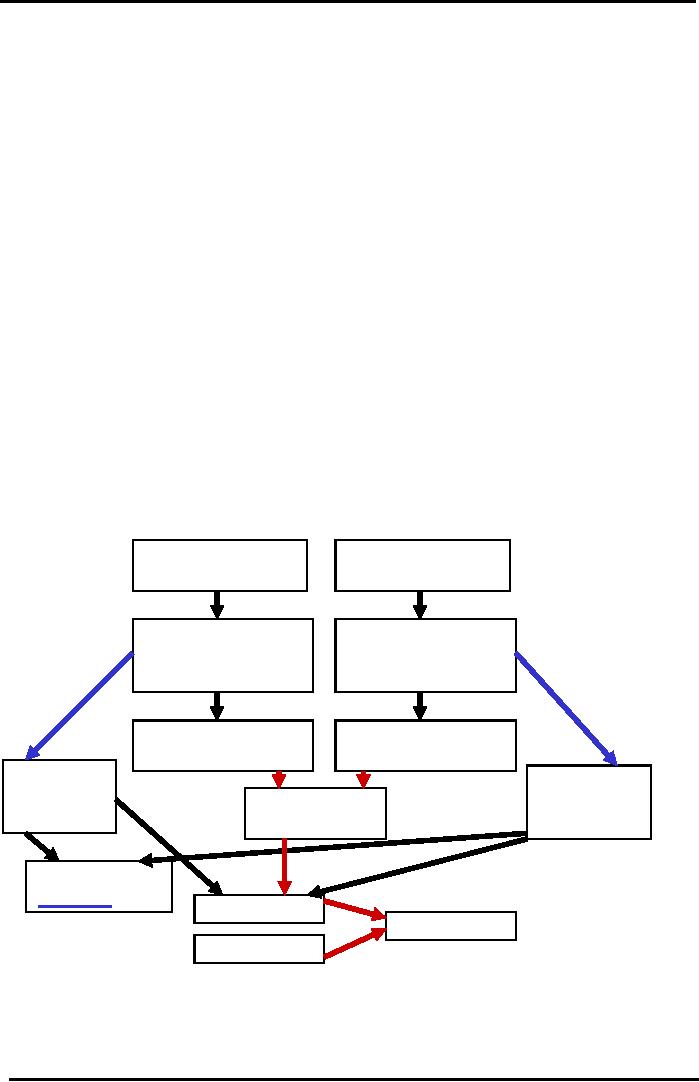
Return,
Risk, and Beta
Stock
B's Possible
Stock
A's Possible
Future
Returns
Future
Returns
Stock
B's Weighted
Stock
A's Weighted
Average
Return or
Average
Return or
Expected
Mean Return
Expected
Mean Return
Stock
A's Risk or
Stock
A's Risk or
Standard
Deviation
Standard
Deviation
Weightage
of
Weightage
of
Stock
A in
Stock
B in
Correlation
Portfolio
Portfolio
between
2 Stocks
Portfolio's
Expected
Return
Portfolio
Risk
Beta
Market
Risk
102
Table of Contents:
- INTRODUCTION TO FINANCIAL MANAGEMENT:Corporate Financing & Capital Structure,
- OBJECTIVES OF FINANCIAL MANAGEMENT, FINANCIAL ASSETS AND FINANCIAL MARKETS:Real Assets, Bond
- ANALYSIS OF FINANCIAL STATEMENTS:Basic Financial Statements, Profit & Loss account or Income Statement
- TIME VALUE OF MONEY:Discounting & Net Present Value (NPV), Interest Theory
- FINANCIAL FORECASTING AND FINANCIAL PLANNING:Planning Documents, Drawback of Percent of Sales Method
- PRESENT VALUE AND DISCOUNTING:Interest Rates for Discounting Calculations
- DISCOUNTING CASH FLOW ANALYSIS, ANNUITIES AND PERPETUITIES:Multiple Compounding
- CAPITAL BUDGETING AND CAPITAL BUDGETING TECHNIQUES:Techniques of capital budgeting, Pay back period
- NET PRESENT VALUE (NPV) AND INTERNAL RATE OF RETURN (IRR):RANKING TWO DIFFERENT INVESTMENTS
- PROJECT CASH FLOWS, PROJECT TIMING, COMPARING PROJECTS, AND MODIFIED INTERNAL RATE OF RETURN (MIRR)
- SOME SPECIAL AREAS OF CAPITAL BUDGETING:SOME SPECIAL AREAS OF CAPITAL BUDGETING, SOME SPECIAL AREAS OF CAPITAL BUDGETING
- CAPITAL RATIONING AND INTERPRETATION OF IRR AND NPV WITH LIMITED CAPITAL.:Types of Problems in Capital Rationing
- BONDS AND CLASSIFICATION OF BONDS:Textile Weaving Factory Case Study, Characteristics of bonds, Convertible Bonds
- BONDS VALUATION:Long Bond - Risk Theory, Bond Portfolio Theory, Interest Rate Tradeoff
- BONDS VALUATION AND YIELD ON BONDS:Present Value formula for the bond
- INTRODUCTION TO STOCKS AND STOCK VALUATION:Share Concept, Finite Investment
- COMMON STOCK PRICING AND DIVIDEND GROWTH MODELS:Preferred Stock, Perpetual Investment
- COMMON STOCKS RATE OF RETURN AND EPS PRICING MODEL:Earnings per Share (EPS) Pricing Model
- INTRODUCTION TO RISK, RISK AND RETURN FOR A SINGLE STOCK INVESTMENT:Diversifiable Risk, Diversification
- RISK FOR A SINGLE STOCK INVESTMENT, PROBABILITY GRAPHS AND COEFFICIENT OF VARIATION
- 2- STOCK PORTFOLIO THEORY, RISK AND EXPECTED RETURN:Diversification, Definition of Terms
- PORTFOLIO RISK ANALYSIS AND EFFICIENT PORTFOLIO MAPS
- EFFICIENT PORTFOLIOS, MARKET RISK AND CAPITAL MARKET LINE (CML):Market Risk & Portfolio Theory
- STOCK BETA, PORTFOLIO BETA AND INTRODUCTION TO SECURITY MARKET LINE:MARKET, Calculating Portfolio Beta
- STOCK BETAS &RISK, SML& RETURN AND STOCK PRICES IN EFFICIENT MARKS:Interpretation of Result
- SML GRAPH AND CAPITAL ASSET PRICING MODEL:NPV Calculations & Capital Budgeting
- RISK AND PORTFOLIO THEORY, CAPM, CRITICISM OF CAPM AND APPLICATION OF RISK THEORY:Think Out of the Box
- INTRODUCTION TO DEBT, EFFICIENT MARKETS AND COST OF CAPITAL:Real Assets Markets, Debt vs. Equity
- WEIGHTED AVERAGE COST OF CAPITAL (WACC):Summary of Formulas
- BUSINESS RISK FACED BY FIRM, OPERATING LEVERAGE, BREAK EVEN POINT& RETURN ON EQUITY
- OPERATING LEVERAGE, FINANCIAL LEVERAGE, ROE, BREAK EVEN POINT AND BUSINESS RISK
- FINANCIAL LEVERAGE AND CAPITAL STRUCTURE:Capital Structure Theory
- MODIFICATIONS IN MILLAR MODIGLIANI CAPITAL STRUCTURE THEORY:Modified MM - With Bankruptcy Cost
- APPLICATION OF MILLER MODIGLIANI AND OTHER CAPITAL STRUCTURE THEORIES:Problem of the theory
- NET INCOME AND TAX SHIELD APPROACHES TO WACC:Traditionalists -Real Markets Example
- MANAGEMENT OF CAPITAL STRUCTURE:Practical Capital Structure Management
- DIVIDEND PAYOUT:Other Factors Affecting Dividend Policy, Residual Dividend Model
- APPLICATION OF RESIDUAL DIVIDEND MODEL:Dividend Payout Procedure, Dividend Schemes for Optimizing Share Price
- WORKING CAPITAL MANAGEMENT:Impact of working capital on Firm Value, Monthly Cash Budget
- CASH MANAGEMENT AND WORKING CAPITAL FINANCING:Inventory Management, Accounts Receivables Management:
- SHORT TERM FINANCING, LONG TERM FINANCING AND LEASE FINANCING:
- LEASE FINANCING AND TYPES OF LEASE FINANCING:Sale & Lease-Back, Lease Analyses & Calculations
- MERGERS AND ACQUISITIONS:Leveraged Buy-Outs (LBOs), Mergers - Good or Bad?
- INTERNATIONAL FINANCE (MULTINATIONAL FINANCE):Major Issues Faced by Multinationals
- FINAL REVIEW OF ENTIRE COURSE ON FINANCIAL MANAGEMENT:Financial Statements and Ratios