 |
Financial
Management MGT201
VU
Lesson
07
DISCOUNTING
CASH FLOW ANALYSIS, ANNUITIES AND
PERPETUITIES
Learning
Objectives:
After
going through this lecture,
you would be able to have an
understanding of the following
concepts.
·
Discounted
Cash Flows (DCF Analysis)
·
Annuities
·
Perpetuity
This
lecture is continuation of the previous
lecture's topics. In the previous
lecture, we had
discussed
the calculation of the Net Present
Value (NPV) and the use of
the value of interest rate or
Opportunity
cost in the process. Bank
Interest on the PLS Account
represents the Minimum
Opportunity
Cost
of our investment. A good
investment opportunity should,
however, offer a higher
return than the
Bank
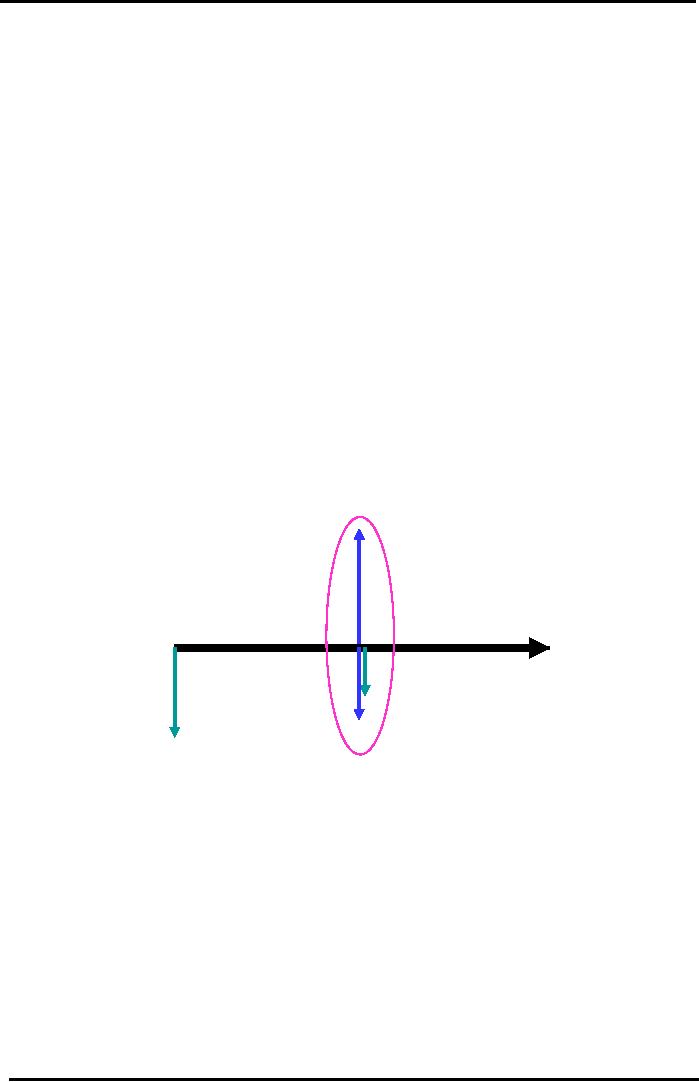
Interest rate. We also used the
time & arrow diagram to show the
cash flows forecast. In the
diagram,
we used upward pointing
arrow to represent the cash
inflows & downward pointing
arrow are
used
to represent the cash outflows. You
can simplify that diagram by
arithmetically solving the
upward
&
down ward pointing arrows at
same point in time by
showing it with one arrow.
(see Fig)
Cash
Flow Diagram
Recap
of Café Example
Use
Downward Pointing Arrows to
show Cash Outflows (Cash
Payments or Expenses
or
Investments). Use Upward
Pointing Arrows to show Cash
Inflows (Cash
Receipts
ie.
Cash Revenue or
Income)
Receipts
= Rs. 200,000
Year
1: 3 Cash Flow Arrows
at
one point in time can
be
simplified
into 1 Net Cash
Flow
Arrow: 200,000
50,000
30,000 = +120,000
Interest:
10% pa
Yr
0
Yr
1
Future
Investment = Rs 30,000
Payments
= Rs 50,000
Initial
Investment = Rs 100,000
The
arrows in time-and-arrow diagram can be
added and subtracted when
they are on same
point
in time but when these
arrows are at the different point of
time these cannot be added or
subtracted.
Now,
let's talk about some common
cash flow patterns the most
common is called annuity.
Annuity:
An
annuity
is a
series of fixed payments, which
might be over a fixed number of
years, or over
the
lifetime of an individual, or both.
The commonly known types of
annuities we see are the
monthly
rent,
and monthly mortgage payments, or insurance
premiums.
There
are two types of
annuities
1.
Ordinary Annuity
An
ordinary annuity, also known
as deferred annuity, consists of a
series of equal payments at the end
of
each
period.
2.
Annuity Due
An
annuity due consists of a series of
equal payments at the beginning of
each period.
34

Financial
Management MGT201
VU
Value
of Annuity depends on the Constant
Cash Flows (CCF) (over a
limited or finite
period
of time) and
the Discount Factor (which
is different for Annual or
Multiple
Compounding)
CCF
CCF
CCF CCF CCF
Ordinary
Five Year Annuity
Time
Line (Years)
Yr
1 Yr 2
Yr
3 Yr 4 Yr 5
Annual
Compounding (at end of every
year):
FV
= CCF (1 + i)
n
- 1
For
example, the payment of Rs.10,000 as
monthly rental to the land
lord is an annuity
which
gives
birth to an annuity stream.
Future value of an annuity
can be seen as
follows:
Future
value of annuity =constant
cash flows x (1+i) n-1/i
Where,
i=interest rate
n=no.
of years
We
can write this formula in
smaller compounded form which describes a
compounding cycle given
as
under:
Multiple
Compounding:
Future
Value of annuity =CCF
(constant cash flow)*(1+
(i/m) m*n-1/i/n
Once
we have calculated the future value of the
annuity, it is very easy to calculate the
present
value
using the well-known interest rate
formula.
Annual
Compounding (at end of every
year)
PV
=FV / (1 + i ) n .
n = life of Annuity in number of
years
Multiple
Compounding:
PV
=FV /
[1 + (i/m)] mxn
i
= % interest per year
More than once per
year i.e. Monthly (m =12),
Quarterly (m=4), Six-monthly
(m=2).
n
= number of years
Now
let's talk about another
kind of cash flow pattern
called perpetuity.
The
difference between Annuity and Perpetuity
is that the Perpetuity is an ongoing
concern, it is never
ending
stream of annuities, whereas an
annuity is for a limited
period.
Perpetuity:
"It
is defined as an annuity with an
infinite life making
continual payments."
In
real life, we see the
example of perpetuity in the retirement
plan. For Example, you
might
plan
to save a sufficient amount of money
& invested in a particular security
or investment that will
give
you
steady & consistent rate of return on
every month or quarter and
this represents a constant
cash flow
amount
that we can assume to go as
long as you live. Since we
are not sure how
far we are going to
live
and
we make an infinite series of
annuities the formula of Future
value of Perpetuity is simpler
than that
of
annuity:
Future
value of perpetuity=constant cash flow/interest
rate
As
we assume that, it is never
ending and on going so time is
irrelevant and is simply
dropped
out
of the equation.
35

Financial
Management MGT201
VU
Common
Cash Flow
Patterns
Perpetuity
·
Perpetuity
Never-ending
Annuity.
It is a Perpetual or
Infinite
stream of Constant Cash
Flows
(CCF)
at
regular intervals.
PV
= CCF
i
CCF
CCF
CCF CCF CCF
CCF
CCF
Infinity
Yr
1 Yr 2
Yr
3 Yr 4 Yr 5 Yr 6
Note:
For Perpetuity whose CCF is
growing at constant
annual
growth rate % "g" :
PV =
CCF / (i - g)
Let's
do a simple numerical example
which will help us what an
annuity calculation is
like
Example:
Assume
that we need to make a basic
financial decision, whether to
purchase a particular
asset
or
to get it on lease (installments).
A
car has a Market Value
today of Rs 150,000. If you get the
car on Lease Financing, then
you
are
required to pay a fixed
regular rental at a fixed interest
rate to the Leasing Company. You
are
allowed
to use the car but the
ownership of the car stays in the
name of the Leasing Company
until you
complete
all your rental payments.
The
question is whether
you should Lease the car or
Buy it?
The
Leasing Company quotes Rs
120,000 every year for 2
years in the form of Car
Lease
Rental
at a Nominal rate of interest (APR
interest rate) of 20% pa. Then
what is the total Future
Value
you
would have paid after 2
years? You would be paying
approximately Rs 240,000 if you do
not take
into
account the time value of
money.
Now
we calculate the present value of the
investment by using Time
value of money concept.
First,
we need to calculate the future value by
using annuity formula
FV
=CCF [(1+i) n
- 1]/
i
=120,000[(1+0.2)2
-1]/0.2
=
Rs 264,000 (yearly
compounding)
If
we deposit the amount annually in a bank
at the rate of 20 percent, we would be able to get
Rs
264,000
at the end of the second year. Now we
will calculate what the present
value of this future
value
is
going to be, and for this,
we will use the old interest rate
formula
PV
= FV / (1+i) n
=
264,000 / (1+0.2)2
=
Rs 183,333
The
resulting amount is about Rs 33,000 more
than what we would have
originally paid if we
had
bought the car rather than
lease it
The
above calculation, however, was
not based on realistic
assumptions because car
lease
rentals
are generally paid monthly,
rather than annual payments. In fact,
you pay Rs 10,000 per
month
for
2 years. We use periodic interest rate
(i/m). Now, what is the
future value after 2 years?
Our cash
flow
diagram should present the
monthly installments & not
annual Payments.
36

Financial
Management MGT201
VU
Monthly
Lease Rentals Example
Annuity
- Cash
Flow Diagram
FV2
= Rs 292,150
PV
= Rs 196,481
CCF
= Monthly Rentals
=
Rs 10,000
Interest
= 20% pa
Time
Line (Years)
Step
1: Bring All the Cash
Yr
0
Yr
1
Yr
2
Flows
Forward to Year 2
(because
formula is written
Step
1
in
terms of FV).
Step2:
Discount the
Step
2 (24 jumps back)
Combined
Cash Flow at
Year
2 back to the Present
It
can be argued that by paying a
rental of 10,000 monthly, we
are actually paying Rs
120,000
in
a year, so there hardly any
difference. But, by not
realizing the difference, one is
violating the time
value
of money because cash flows
occurring at different points of
time cannot be subtracted or
added.
It
is the cardinal principle of Time
value of money.
If
we have to calculate the future value of the
annuity on a monthly basis, we
would use the
following
formula.
=CCF
X {[(1+i/m) nxm-1]/ (i/m)}
Now
the m= 12 compounding cycle in a
year
Putting
the values in the formula, we obtain the
result as under.
FV2=Rs
292,150
Now,
we can calculate the present value of the
future value of
annuity
PV
= FV / (1+i) n
=292150/(1+.2/12)2x12
=196,481
The
present value of annuity can
also be called the intrinsic
value of the annuity.
The
aforementioned technique allows us to
compare the amount of money we are
paying to
leasing
company with the market value of car. It
helps you to decide whether you
should buy the car on
market
price or to get it leased. The
cost of leasing at 20% p.a.
tell us that you have to pay
20% interest
&
you have to pay more money in
leasing as compare to the decision if
you buy it .
Perpetuity
Example -
Retirement Planning
You
would like to retire at the
age of 60 and receive an income of Rs.
200,000 every year
from
your
Bank Account for as long as
you live. How much
money do you need to deposit
in the Bank
Account
offering 10% pa so that the
Account will pay you Rs
200,000 of interest income every
year
forever
(even though you will
not live forever)!
·
PV = CCF / i = 200,000 / 0.10 = Rs
2,000,000
This
also implies that you
would be receiving Rs 200,000
every year for the rest of
your life and
the
money would neither finish
nor decrease in amount. This
would happen so, because
what you would
be
receiving at the end each year
would be interest accrued on the
investment that you have
made. The
money
that you are getting is
not a part of the investment; instead, it
is the yield on your
investment.
This
may sound like a `big
idea' for making money,
but in fact, it is not so.
Inflation, a macroeconomic
syndrome
erodes the value of money
constantly. If the prevailing inflation
rate is 5 percent, then your
real
return on investment is not 10 percent.
If we consider the real rate of return,
which is interest rate
rate
of inflation, you would see
that you need to invest
twice as much to guard
yourself against inflation.
37

Financial
Management MGT201
VU
Another
example for perpetuity is
Consol Bonds. Consol Bonds were issued by
the British
Government
in 18th century
to pay off the smaller bonds
that were issued to fund the
wars against
France.
Since the purpose of the bond was to
consolidate the past debts, it
was named as Consol.
These
bonds
were just like other bonds
issued by the government, with the
difference that it had no maturity.
It
implies
that the holder of the bond
was to receive regular interest payments
for an endless
period.
Now
if we have to invest in such a bond we
need to know the price or the
present value of the
bond.
Dividing the interest payment that a
Consol bondholder would
receive, by the interest rate, we
can
find
the present value of a Consol
bond. Suppose that the
interest rate is at 10 percent and the promised
interest
payments to be received are £
1,000 every year, the price
of the bond can be calculated as
under
·
PV = CCF / i = 1,000/ 0.10 = £
10,000
With
this example, the discussion on
discounted cash flows, annuities,
and perpetuities is
concluded.
We would study the capital
budgeting techniques in the next
lecture.
38
Table of Contents:
- INTRODUCTION TO FINANCIAL MANAGEMENT:Corporate Financing & Capital Structure,
- OBJECTIVES OF FINANCIAL MANAGEMENT, FINANCIAL ASSETS AND FINANCIAL MARKETS:Real Assets, Bond
- ANALYSIS OF FINANCIAL STATEMENTS:Basic Financial Statements, Profit & Loss account or Income Statement
- TIME VALUE OF MONEY:Discounting & Net Present Value (NPV), Interest Theory
- FINANCIAL FORECASTING AND FINANCIAL PLANNING:Planning Documents, Drawback of Percent of Sales Method
- PRESENT VALUE AND DISCOUNTING:Interest Rates for Discounting Calculations
- DISCOUNTING CASH FLOW ANALYSIS, ANNUITIES AND PERPETUITIES:Multiple Compounding
- CAPITAL BUDGETING AND CAPITAL BUDGETING TECHNIQUES:Techniques of capital budgeting, Pay back period
- NET PRESENT VALUE (NPV) AND INTERNAL RATE OF RETURN (IRR):RANKING TWO DIFFERENT INVESTMENTS
- PROJECT CASH FLOWS, PROJECT TIMING, COMPARING PROJECTS, AND MODIFIED INTERNAL RATE OF RETURN (MIRR)
- SOME SPECIAL AREAS OF CAPITAL BUDGETING:SOME SPECIAL AREAS OF CAPITAL BUDGETING, SOME SPECIAL AREAS OF CAPITAL BUDGETING
- CAPITAL RATIONING AND INTERPRETATION OF IRR AND NPV WITH LIMITED CAPITAL.:Types of Problems in Capital Rationing
- BONDS AND CLASSIFICATION OF BONDS:Textile Weaving Factory Case Study, Characteristics of bonds, Convertible Bonds
- BONDS VALUATION:Long Bond - Risk Theory, Bond Portfolio Theory, Interest Rate Tradeoff
- BONDS VALUATION AND YIELD ON BONDS:Present Value formula for the bond
- INTRODUCTION TO STOCKS AND STOCK VALUATION:Share Concept, Finite Investment
- COMMON STOCK PRICING AND DIVIDEND GROWTH MODELS:Preferred Stock, Perpetual Investment
- COMMON STOCKS RATE OF RETURN AND EPS PRICING MODEL:Earnings per Share (EPS) Pricing Model
- INTRODUCTION TO RISK, RISK AND RETURN FOR A SINGLE STOCK INVESTMENT:Diversifiable Risk, Diversification
- RISK FOR A SINGLE STOCK INVESTMENT, PROBABILITY GRAPHS AND COEFFICIENT OF VARIATION
- 2- STOCK PORTFOLIO THEORY, RISK AND EXPECTED RETURN:Diversification, Definition of Terms
- PORTFOLIO RISK ANALYSIS AND EFFICIENT PORTFOLIO MAPS
- EFFICIENT PORTFOLIOS, MARKET RISK AND CAPITAL MARKET LINE (CML):Market Risk & Portfolio Theory
- STOCK BETA, PORTFOLIO BETA AND INTRODUCTION TO SECURITY MARKET LINE:MARKET, Calculating Portfolio Beta
- STOCK BETAS &RISK, SML& RETURN AND STOCK PRICES IN EFFICIENT MARKS:Interpretation of Result
- SML GRAPH AND CAPITAL ASSET PRICING MODEL:NPV Calculations & Capital Budgeting
- RISK AND PORTFOLIO THEORY, CAPM, CRITICISM OF CAPM AND APPLICATION OF RISK THEORY:Think Out of the Box
- INTRODUCTION TO DEBT, EFFICIENT MARKETS AND COST OF CAPITAL:Real Assets Markets, Debt vs. Equity
- WEIGHTED AVERAGE COST OF CAPITAL (WACC):Summary of Formulas
- BUSINESS RISK FACED BY FIRM, OPERATING LEVERAGE, BREAK EVEN POINT& RETURN ON EQUITY
- OPERATING LEVERAGE, FINANCIAL LEVERAGE, ROE, BREAK EVEN POINT AND BUSINESS RISK
- FINANCIAL LEVERAGE AND CAPITAL STRUCTURE:Capital Structure Theory
- MODIFICATIONS IN MILLAR MODIGLIANI CAPITAL STRUCTURE THEORY:Modified MM - With Bankruptcy Cost
- APPLICATION OF MILLER MODIGLIANI AND OTHER CAPITAL STRUCTURE THEORIES:Problem of the theory
- NET INCOME AND TAX SHIELD APPROACHES TO WACC:Traditionalists -Real Markets Example
- MANAGEMENT OF CAPITAL STRUCTURE:Practical Capital Structure Management
- DIVIDEND PAYOUT:Other Factors Affecting Dividend Policy, Residual Dividend Model
- APPLICATION OF RESIDUAL DIVIDEND MODEL:Dividend Payout Procedure, Dividend Schemes for Optimizing Share Price
- WORKING CAPITAL MANAGEMENT:Impact of working capital on Firm Value, Monthly Cash Budget
- CASH MANAGEMENT AND WORKING CAPITAL FINANCING:Inventory Management, Accounts Receivables Management:
- SHORT TERM FINANCING, LONG TERM FINANCING AND LEASE FINANCING:
- LEASE FINANCING AND TYPES OF LEASE FINANCING:Sale & Lease-Back, Lease Analyses & Calculations
- MERGERS AND ACQUISITIONS:Leveraged Buy-Outs (LBOs), Mergers - Good or Bad?
- INTERNATIONAL FINANCE (MULTINATIONAL FINANCE):Major Issues Faced by Multinationals
- FINAL REVIEW OF ENTIRE COURSE ON FINANCIAL MANAGEMENT:Financial Statements and Ratios