 |
CONFIDENCE AND SUPPORT |
| << DATA MINING |
| ELECTRONIC DATA INTERCHANGE (EDI) >> |

E-COMMERCE
IT430
VU
Lesson
35
CONFIDENCE
AND SUPPORT
There
are two terms/measures used
in association, that is, support
and confidence. Confidence' is a
measure
of how often the relationship holds true
e.g, what percentage of time did people
who bought milk
also
bought eggs. Support means what is the
percentage of two items occurring
together overall.
Mathematically,
they can be expressed as follows if we
take the example of eggs and
milk:
Confidence =
Transactions (eggs+milk)
Transactions
(eggs or milk or
both)
In
case no. of transactions
involving eggs and milk
are 25 and those involving
eggs or milk or both are
75
then
confidence is 25/75*100=33.3%
Support
=
Transactions
(eggs+milk)
Total
no. of transactions
In
case no. of transactions
involving eggs and milk
are 10 and total no. of
transactions in a day are 50
then
support
is 10/50*100 = 20%
Suppose
if confidence is 90% but the support is
5%., then we can gather
from this that the two items
have
very strong
affinity or relationship with each
other such that when an item is
sold the other is sold
together,
however, the
chance of this pair being purchased
out of the total no. of
transactions is very slim, just
5%.
One
can adjust these measures to
discover items having corresponding level of
association and
accordingly
set
marketing strategy. So, if I feed the
data to the association mining
tool and specify the
percentage of
confidence
and support, it will list
down the items that have
association corresponding to these
percentages.
Results
of association mining are
shown with the help of
double arrows as indicated below:
Bread
----
Butter
Computer
----
Furniture
Clothes
----
Shoes
Using the
result of association mining, a
marketer can take a number of
useful steps to set or
modify
marketing
strategy. For example, items
that have closeness/affinity with
each other can be shelved
together
to
improve customer service. Certain
promotional schemes can be
introduced in view of the
association
mining
result etc.
Characterization
It is discovering
interesting concepts in concise and
succinct terms at generalized
levels for examining the
general
behavior of the data. For
example, in a database of graduate
students of a university the students
of
different
nationalities can be enrolled in
different departments such as
music history, physics etc. We
can
apply
characterization technique to find a
generalized concept/answer in response to the question
that how
many
students of a particular country are
studying science or arts. See the
following example:
Student
name Department
City
of residence
Imran
History
Karachi
Alice
Physics
London
Ali
Literature
Lahore
Bob
Mathematics
Toronto
...
In the
above example, characterization
tool can, for that
matter, tell us that 02
Pakistani students
are
studying
arts. Note that the concept
of location and the field of
education are generalized to
Pakistan and
arts,
respectively.
The
two algorithms used in characterization
are Version Space Search
and Attribute-Oriented
Induction.
144
E-COMMERCE
IT430
VU
Clustering
A
cluster is a group of data
objects that are similar to
another within the same cluster
and are dissimilar to
the
objects in other clusters.
For example, clusters of distinct
group of customers, categories of
emails in a
mailing
list database, different
categories of web usage from
log files etc. It serves as a
preprocessing step
for
other algorithms such as classification
and characterization. K-means
algorithm is normally used
in
clustering.
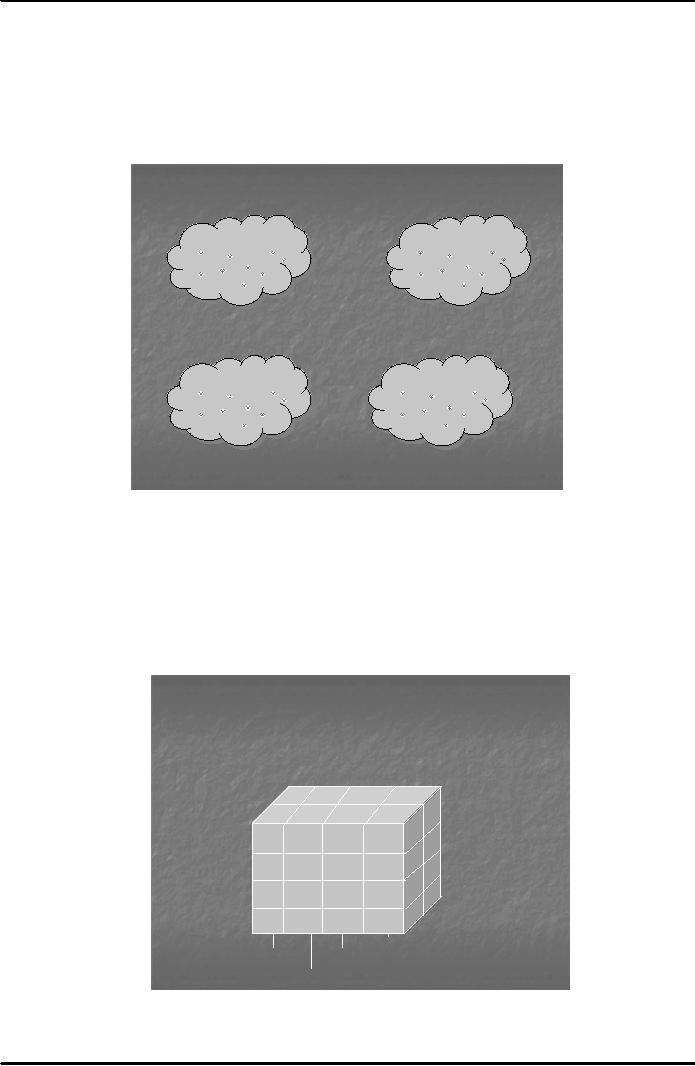
In the example below you can
see four clusters of customers
based on their income level.
K-
means
algorithm displays the result in the
format as shown in Fig. 1 below:
IIncome<10000000
ncome<1,, 0,, 00
IIncome>=10000000
ncome>=1,, 0,, 00
<=220000000
<= ,, 0,, 00
IIncome>20000000
ncome>2,, 0,, 00
IIncome>35500000
ncome>3,, 0,, 00
<=335500000
<= ,, 0,, 00
Fig.
1
Online
Analytical Processing
(OLAP)
OLAP
makes use of background knowledge
regarding the domain of the data being
studied in order to
allow
the presentation of data at different
levels of abstraction. It is different
form data mining in the
sense
that
it does not provide any
patterns for making predictions; rather the
information stored in databases
can
be
presented/ viewed in a convenient format
in case of OLAP at different
levels that facilitates
decision
makers
or managers. The result of
OLAP is displayed in the form of a
data cube as
shown in Fig. 2
below:
Data
Cube in OLAP
Karachi
440
345
Location
(cities)
Lahore
Q1
605
825
Time
Quarters
400
Q2
Q3
Q4
Grocery
Furniture
phone
computer
(Item
Types)
Fig.
2
145

E-COMMERCE
IT430
VU
Note
that in the above diagram, time, item
type and location are the
three dimensions. OLAP data
cube
indicates
the sale of 605 and 825
units of furniture and computers,
respectively, in the first quarter of
the
year
in Lahore, 440 units of furniture and
345 phone sets in Karachi in the
first quarter, respectively,
and
400
grocery items in Lahore during
second quarter. Results can
be displayed through data
cube against more
than
three dimensions. For
instance, variables, `warehouse'
and `customer type' may
also be added as
dimensions
to view the sale results.
OLAP tool allows the use of
different processes, namely,
drill-down,
roll-up,
slice, dice etc. Using
drill-down we can further
dig the data to receive some
specific information.
For
example using that I can
find the sale of furniture in a
specific month of the first
quarter, say,
February.
Roll-up
is the reverse of drill-down. In it we
can sum-up or integrate the
information in a particular
dimension to
show the result. For example
the sale of furniture or computers in a
particular year (rather
than a
specific quarter) can be viewed
using roll-up. Similarly, through
slice and dice information
can be
presented
which is specific to certain
dimensions of the data
cube.
SAS
(Enterprise Miner) and DB miner are the
names of two commonly used tools
for data mining
and
OLAP.
Note that characterization
can be used in respect of
any data type whereas OLAP
is generally used
for
numeric data alone.
146
Table of Contents:
- E-COMMERCE
- WHAT IS A NETWORK
- HOW MANY CLASS A, B, C NETWORKS AND HOSTS ARE POSSIBLE
- NETWORKING DEVICES
- BASICS OF HTML 1
- BASICS OF HTML 2
- TEXT BOXES, CHECK BOXES, RADIO BUTTONS
- FRAMES AND IMAGES IN HTML
- TAG ATTRIBUTES, SOUNDS FILES, ANIMATIONS
- STYLE SHEETS 1
- STYLE SHEETS 2
- SOME USEFUL STYLE SHEETS PROPERTIES
- JAVA SCRIPTING 1
- JAVA SCRIPTING 2
- JAVA SCRIPTING 3
- JAVA SCRIPTING AND XML
- CLIENT AND SERVER SIDE PROCESSING OF DATA
- APPLETS, CGI SCRIPTS
- MAINTAINING STATE IN A STATELESS SYSTEM
- INTEGRATION WITH ERP SYSTEMS
- FIREWALLS
- CRYPTOGRAPHY
- HASH FUNCTION AND MESSAGE DIGEST
- SYMMETRIC KEY ALGORITHMS
- VIRTUAL PIN PAYMENT SYSTEM
- E-CASH PAYMENT SYSTEM 1
- E-CASH PAYMENT SYSTEM 2
- SECURE SOCKET LAYER (SSL)
- E-BUSINESS: DISADVANTAGES OF E-BUSINESS
- E-BUSINESS REVENUE MODELS
- E-MAIL MARKETING
- CUSTOMER RELATIONSHIP MANAGEMENT (CRM)
- META INFORMATION
- DATA MINING
- CONFIDENCE AND SUPPORT
- ELECTRONIC DATA INTERCHANGE (EDI)
- PERSONAL FINANCE ONLINE
- SUPPLY CHAIN
- PORTERS MODEL OF COMPETITIVE RIVALRY
- BARRIERS TO INTERNATIONAL E-COMMERCE
- ELECTRONIC TRANSACTIONS ORDINANCE, 2002 - 1
- ELECTRONIC TRANSACTIONS ORDINANCE, 2002 - 2
- ELECTRONIC TRANSACTIONS ORDINANCE, 2002 - 3
- GLOBAL LEGAL ISSUES OF E-COMMERCE - 1
- GLOBAL LEGAL ISSUES OF E-COMMERCE - 2