 |
CAPITAL WORK IN PROGRESS 2 |
| << CAPITAL WORK IN PROGRESS 1 |
| REVALUATION OF FIXED ASSETS >> |
Financial
Accounting (Mgt-101)
VU
Lesson-20
CAPITAL
WORK IN PROGRESS
If an
asset is not completed at
that time when balance sheet
is prepared, all costs incurred on
that asset up to
the
balance sheet date are
transferred to an account called
Capital
Work in Progress Account.
This
account
is shown separately in the balance
sheet below the fixed asset.
Capital work in progress
account
contains
all expenses incurred on the asset
until it is converted into working
condition. All these
expenses
will
become part of the cost of
that asset. When any
expense is incurred or paid, it is included in the
Capital
Work
in Progress Account through the
following entry:
Debit:
Work
in Progress Account
Credit:
Cash/Bank/Payable
Account
When
an asset is completed and it is
ready to work, all costs
will transfer to the relevant asset
account
through
the following entry:
Debit:
Relevant
asset account
Credit:
Capital
work in progress
account
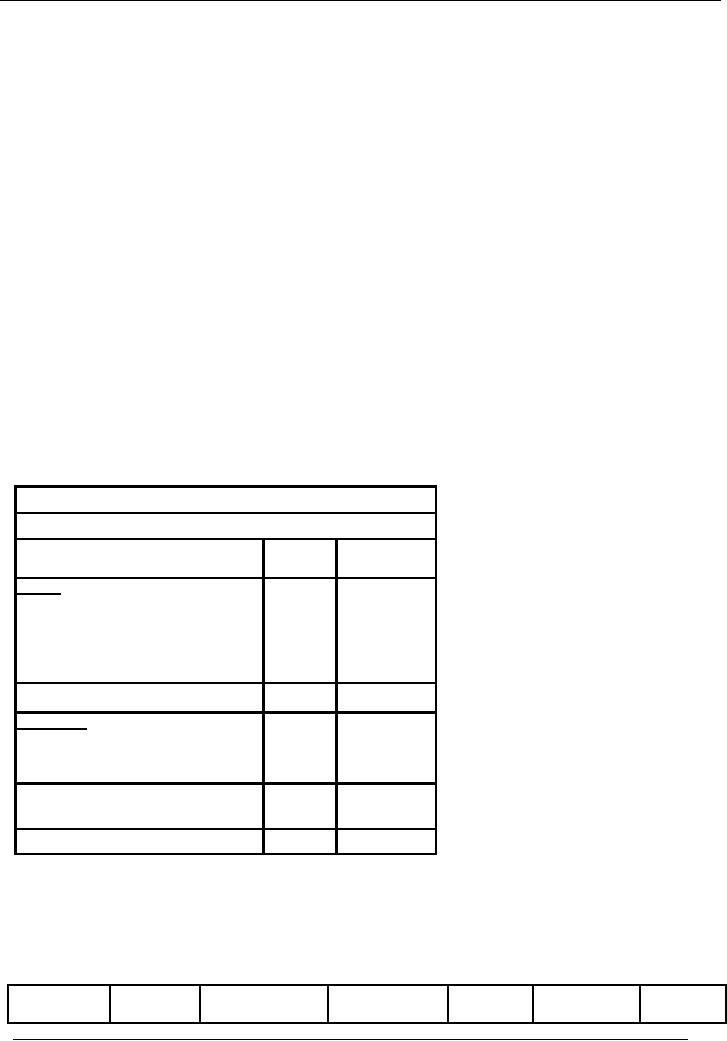
PRESENTATION
It is
already mentioned that Work in
Progress Account is shown
separately in the balance sheet
below the
fixed
asset. i-e.
Name of the
Entity
Balance
Sheet As At
Particulars
Amount
Amount
Rs.
Rs.
Assets
Fixed
Assets
xyz
Capital
Work in Progress
xyz
Other
Long Term Assets
xyz
Current
Assets
Total
Xyz
Liabilities
Capital
xyz
Profit
xyz
Xyz
Long
Term Liabilities
Xyz
Current
Liabilities
Total
Xyz
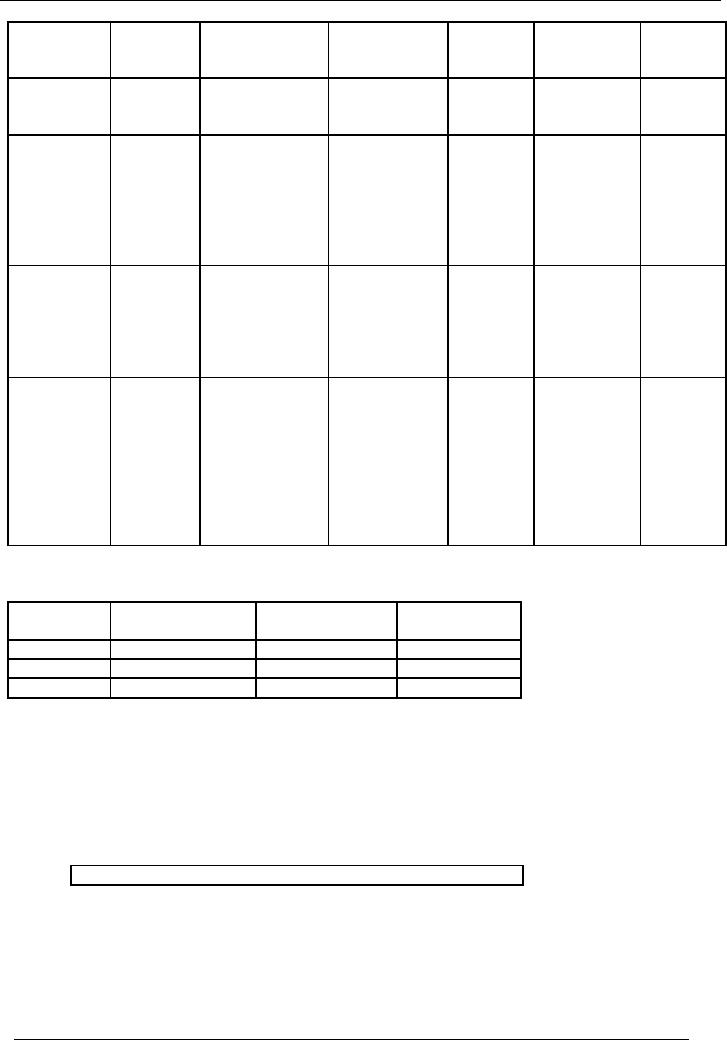
Consider
the solved illustration in the previous
lecture:
Depreciation
on the basis of
use
Date
Purchase
Depreciation
Accumulated
Total
Written
Total
of
(Rs.)
depreciation
Accum.
Down
Value
Written
144
Financial
Accounting (Mgt-101)
VU
machine
(Rs.)
Dep.
(Rs.)
Down
(Rs.)
Value
(Rs.)
01-09-2000
100,000
Machine # 1
Machine
# 1
20,833
Machine # 1
79,167
100,000
x 25%
20,833
79,167
x10/12=20,833
2001-2002
Machine
# 1
Machine
# 1
61,458
Machine # 1
238,542
79,167x25%
40,625
59,375
= 19,792
31-01-2002
200,000
Machine # 2
Machine
# 2
Machine
# 2
200,000x25%x5/
20,833
179,167
12=20,833
2002-2003
Machine
# 1
Machine
# 1
121,094
Machine # 1
178,906
59,375x25%
55,469
44,531
= 14,844
Machine
# 2
Machine
# 2
Machine
# 2
179,167x25%
65,625
134,375
=44,792
2003-2004
Machine
# 1
Machine
# 1
175,538
Machine # 1
138,281
44,531x25%x
63,819
(36,181)
9/12=
8,350
(sold)
Machine
# 2
Machine
# 2
Machine
# 2
134,375x25%
99,219
100,781
= 33,594
01-07-2003
50,000
Machine # 3
Machine
# 3
Machine
# 3
50,000x25%
12,500
37,500
= 12,500
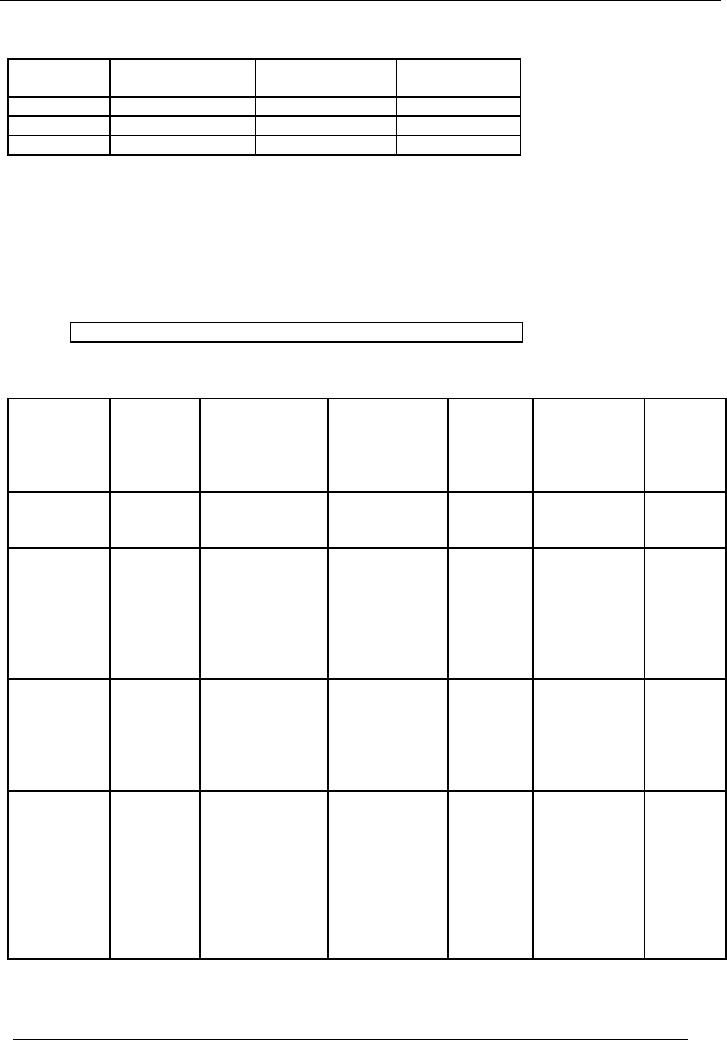
PRESENTATION
IN THE BALANCE SHEET
Year
Cost
of Machinery
Accumulated
Written
Down
Depreciation
Value
2000-2001
100,000
20,833
79,167
2001-2002
300,000
61,458
238,542
2002-2003
300,000
121,094
178,906
Written
Down Value of the year
2003-2004
Opening
Written Down Value:
Rs.
178,906
Add:
Cost of machine
purchased:
Rs.
50,000
Less:
Depreciation of Machine # 1 in
2003-2004:
(8,350)
Less:
Depreciation of other
assets:
(46,094)
Less:
Written Down Value of
machine disposed:
(36,181)
Closing
Written Down Value:
Rs.
138,281
145
Financial
Accounting (Mgt-101)
VU
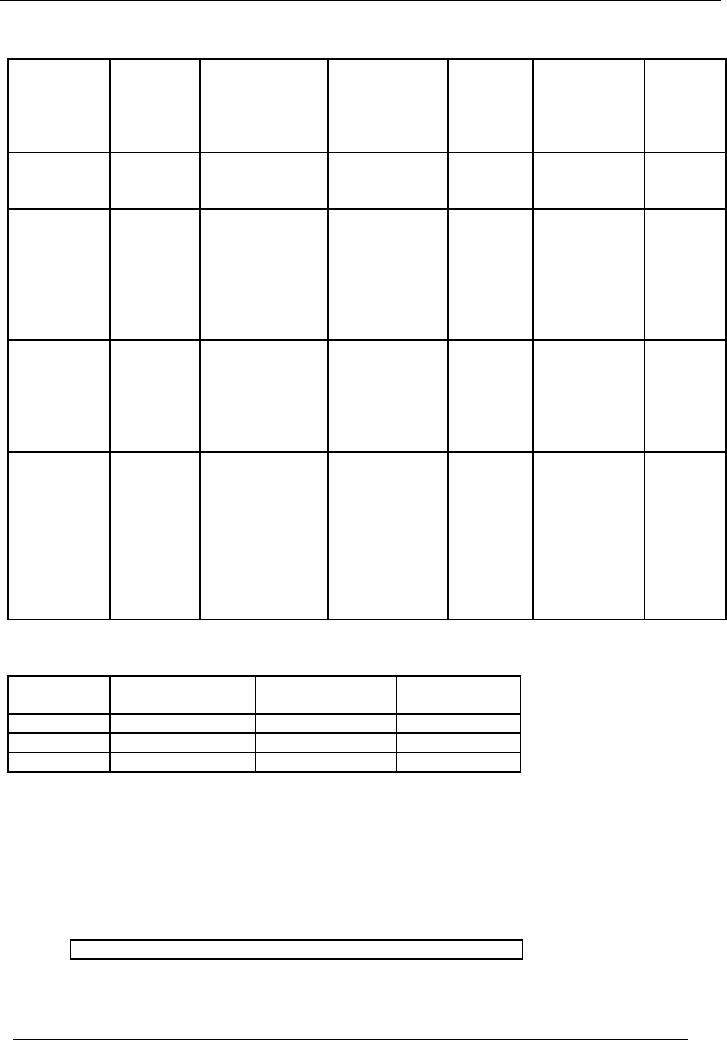
Full
year depreciation in the
year of purchase and no depreciation in
the year of sale:
Date
Purchase
Depreciation
Accumulated
Total
Written
Total
of
(Rs.)
depreciation
Accum.
Down
Value
Written
machine
(Rs.)
Dep.
(Rs.)
Down
(Rs.)
Value
(Rs.)
01-09-2000
100,000
Machine # 1
Machine
# 1
25,000
Machine # 1
75,000
100,000
x 25%
25,000
75,000
=25,000
2001-2002
Machine
# 1
Machine
# 1
93,750
Machine # 1
206,250
75,000x25%
43,750
56,250
= 18,750
31-01-2002
200,000
Machine # 2
Machine
# 2
Machine
# 2
200,000x25%
50,000
150,000
=50,000
2002-2003
Machine
# 1
Machine
# 1
145,313
Machine # 1
154,687
56,250x25%
57,813
42,187
= 14,063
Machine
# 2
Machine
# 2
Machine
# 2
150,000x25%
87,500
112,500
=37,500
2003-2004
Machine
# 1
Machine
# 1
185,935
Machine # 1
121,875
0
57,813
42,187
Machine
sold
(sold)
(sold)
Machine
# 2
Machine
# 2
Machine
# 2
112,500x25%
115,625
84,375
= 28,125
01-07-2003
50,000
Machine # 3
Machine
# 3
Machine
# 3
50,000x25%
12,500
37,500
= 12,500
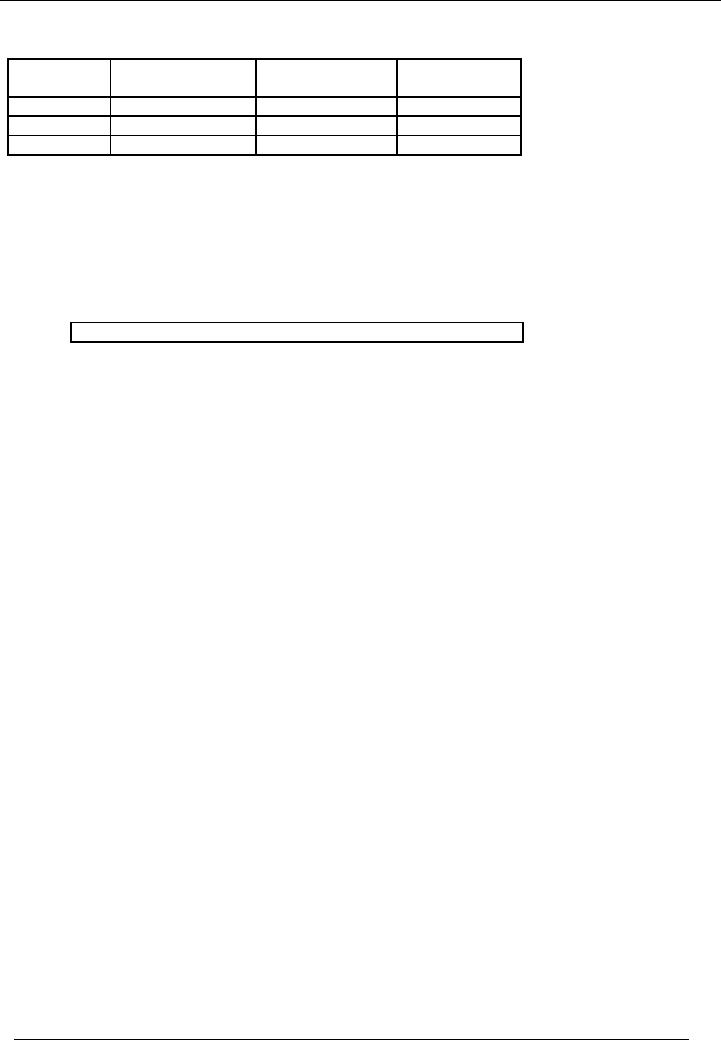
PRESENTATION
IN THE BALANCE SHEET
Year
Cost
of Machinery
Accumulated
Written
Down
Depreciation
Value
2000-2001
100,000
25,000
75,000
2001-2002
300,000
93,750
206,250
2002-2003
300,000
145,313
154,687
Written
Down Value of the year
2003-2004
Opening
Written Down Value:
Rs.
154,687
Add:
Cost of machine
purchased:
Rs.
50,000
Less:
Depreciation of Machine # 1 in
2003-2004:
0
Less:
Depreciation of other
assets:
(40,625)
Less:
Written Down Value of
machine disposed:
(42,187)
Closing
Written Down Value:
Rs.
121,875
146
Financial
Accounting (Mgt-101)
VU
ILLUSTRATION
# 2
Following
information of machinery account is
available in Year 2004:
· Machine
# 1 is purchased on
August
1, 2000 for Rs.
50,000
· Machine
# 2 is purchased on April 1, 2002
for Rs. 100,000
· Machine
# 3 is purchased on March 1, 2004
for Rs. 150,000
· Machine
# 1 is disposed on May 31,
2004
Depreciation
is charged @ 20% reducing balance method.
Financial year is closed on June 30
every year.
Show
the calculation of depreciation on machinery for
four years using the
following policies:
· Depreciation
is charged on the basis of
use
· Full
depreciation is charged in the year of
purchase and no depreciation is charged
in the year of
disposal,
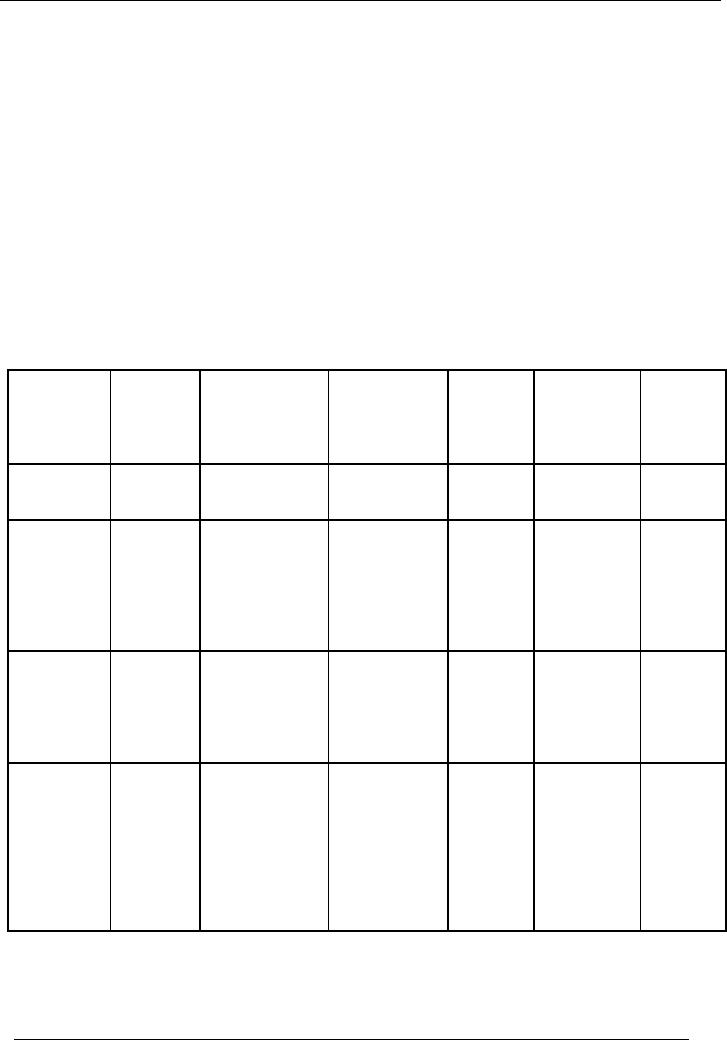
SOLUTION
Depreciation
on the basis of
use
Date
Purchase
Total
Depreciation
Accumulated
Total
Written
of
Down
Value
Written
(Rs.)
depreciation
Accum.
machine
(Rs.)
Down
Dep.
(Rs.)
(Rs.)
Value
(Rs.)
01-08-2000
50,000
Machine # 1
Machine
# 1
9,167
Machine # 1
40,833
50,000
x 20%
9,167
9,167
x11/12=9,167
2001-2002
Machine
# 1
Machine
# 1
22,334
Machine # 1
127,666
40,833x20%
17,334
32,666
= 8,167
Machine
# 2
01-04-2002
100,000
Machine # 2
5,000
Machine
# 2
100,000x20%x3/
95,000
12=5,000
2002-2003
Machine
# 1
Machine
# 1
47,867
Machine # 1
102,133
32,666x20%
23,867
26,133
= 6,533
Machine
# 2
Machine
# 2
Machine
# 2
95,000x20%
24,000
76,000
=19,000
2003-2004
Machine
# 1
Machine
# 1
77,858
Machine # 1
200,800
26,133x20%x
28,658
(21,342)
11/12=
4,791
(sold)
Machine
# 2
Machine
# 2
Machine
# 2
76,000x20%
39,200
60,800
= 15,200
01-03-2004
150,000
Machine # 3
Machine
# 3
Machine
# 3
150,000x20%x
10,000
140,000
4/12=
10,000
147
Financial
Accounting (Mgt-101)
VU
PRESENTATION
IN THE BALANCE SHEET
Year
Cost
of Machinery
Accumulated
Written
Down
Depreciation
Value
2000-2001
50,000
9,167
40,833
2001-2002
150,000
22,334
127,666
2002-2003
150,000
47,867
102,133
Written
Down Value of the year
2003-2004
Opening
Written Down Value:
Rs.
102,133
Add:
Cost of machine
purchased:
Rs.
150,000
Less:
Depreciation of Machine # 1 in
2003-2004:
(4,791)
Less:
Depreciation of other
assets:
(25,200)
Less:
Written Down Value of
machine disposed:
(21,342)
Closing
Written Down Value:
Rs.
200,800
Full
year depreciation in the
year of purchase and no depreciation in
the year of sale:
Date
Purchase
Depreciation
Accumulated
Total
Written
Total
of
(Rs.)
depreciation
Accum.
Down
Value
Written
machine
(Rs.)
Dep.
(Rs.)
Down
(Rs.)
Value
(Rs.)
01-08-2000
50,000
Machine # 1
Machine
# 1
10,000
Machine # 1
40,000
50,000
x 20%
10,000
40,000
=10,000
2001-2002
Machine
# 1
Machine
# 1
38,000
Machine # 1
112,000
40,000x20%
18,000
32,000
= 8,000
01-04-2002
100,000
Machine # 2
Machine
# 2
Machine
# 2
100,000x20%
20,000
80,000
=20,000
2002-2003
Machine
# 1
Machine
# 1
60,400
Machine # 1
89,600
32,000x20%
24,400
25,600
= 6,400
Machine
# 2
Machine
# 2
Machine
# 2
80,000x20%
36,000
64,000
=16,000
2003-2004
Machine
# 1
Machine
# 1
103,200
Machine # 1
171,200
0
24,400
(25,600)
Machine
sold
(sold)
(sold)
Machine
# 2
Machine
# 2
Machine
# 2
64,000x20%
48,800
51,200
= 12,800
01-03-2004
150,000
Machine # 3
Machine
# 3
Machine
# 3
150,000x20%
30,000
120,000
= 30,000
148
Financial
Accounting (Mgt-101)
VU
PRESENTATION
IN THE BALANCE SHEET
Year
Cost
of Machinery
Accumulated
Written
Down
Depreciation
Value
2000-2001
50,000
10,000
40,000
2001-2002
150,000
38,000
112,000
2002-2003
150,000
60,400
89,600
Written
Down Value of the year
2003-2004
Opening
Written Down Value:
Rs.
89,600
Add:
Cost of machine
purchased:
Rs.
150,000
Less:
Depreciation of Machine # 1 in
2003-2004:
0
Less:
Depreciation of other
assets:
(42,800)
Less:
Written Down Value of
machine disposed:
(25,600)
Closing
Written Down Value:
Rs.
171,200
REVALUATION
OF FIXED ASSETS
Fixed
assets are purchased to be
used for longer period. In the
subsequent years, the value of
asset could be
higher or
lower than its present
book value due to
inflationary condition of the economy.
Assets are valued
at
Historical Cost in the books of accounts.
Historical Cost is the original
cost of the asset at which it
was
purchased
plus additional costs incurred on the
asset to bring it in working
condition. Sometimes, the
management
of the business, if it thinks fit,
revalues the asset to present it on
current market value. Once
the
asset
is revalued to its market
value, then its value
has to be constantly monitored to reflect the
changes in
the
market value.
If an
asset is revalued at higher cost than
its original cost, the
excess amount will be treated as
profit on
revaluation of
fixed assets and it is
credited to Revaluation Reserve
Account.
On the
other hand, if an asset is
revalued at lower cost than
its original cost, the
balance amount will be
treated
as loss on revaluation of fixed assets
and it is shown in the profit &
loss account of that year in
which
asset
was revalued.
149
Table of Contents:
- Introduction to Financial Accounting
- Basic Concepts of Business: capital, profit, budget
- Cash Accounting and Accrual Accounting
- Business entity, Single and double entry book-keeping, Debit and Credit
- Rules of Debit and Credit for Assets, Liabilities, Income and Expenses
- flow of transactions, books of accounts, General Ledger balance
- Cash book and bank book, Accounting Period, Trial Balance and its limitations
- Profit & Loss account from trial balance, Receipt & Payment, Income & Expenditure and Profit & Loss account
- Assets and Liabilities, Balance Sheet from trial balance
- Sample Transactions of a Company
- Sample Accounts of a Company
- THE ACCOUNTING EQUATION
- types of vouchers, Carrying forward the balance of an account
- ILLUSTRATIONS: Ccarrying Forward of Balances
- Opening Stock, Closing Stock
- COST OF GOODS SOLD STATEMENT
- DEPRECIATION
- GROUPINGS OF FIXED ASSETS
- CAPITAL WORK IN PROGRESS 1
- CAPITAL WORK IN PROGRESS 2
- REVALUATION OF FIXED ASSETS
- Banking transactions, Bank reconciliation statements
- RECAP
- Accounting Examples with Solutions
- RECORDING OF PROVISION FOR BAD DEBTS
- SUBSIDIARY BOOKS
- A PERSON IS BOTH DEBTOR AND CREDITOR
- RECTIFICATION OF ERROR
- STANDARD FORMAT OF PROFIT & LOSS ACCOUNT
- STANDARD FORMAT OF BALANCE SHEET
- DIFFERENT BUSINESS ENTITIES: Commercial, Non-commercial organizations
- SOLE PROPRIETORSHIP
- Financial Statements Of Manufacturing Concern
- Financial Statements of Partnership firms
- INTEREST ON CAPITAL AND DRAWINGS
- DISADVANTAGES OF A PARTNERSHIP FIRM
- SHARE CAPITAL
- STATEMENT OF CHANGES IN EQUITY
- Financial Statements of Limited Companies
- Financial Statements of Limited Companies
- CASH FLOW STATEMENT 1
- CASH FLOW STATEMENT 2
- FINANCIAL STATEMENTS OF LISTED, QUOTED COMPANIES
- FINANCIAL STATEMENTS OF LISTED COMPANIES
- FINANCIAL STATEMENTS OF LISTED COMPANIES