 |

Financial
Management MGT201
VU
Lesson
08
CAPITAL
BUDGETING AND CAPITAL BUDGETING
TECHNIQUES
Learning
Objective:
After
going through this lecture,
you would be able to have an
understanding of the following
concepts.
·
Capital
Budgeting
·
Techniques
of Capital Budgeting
Today,
we will discuss Capital
Budgeting--one of the most important
topics in financial
management.
Capital
budgeting is about investment in
fixed assets. In addition, another
type of investment
could
be
in working capital, which we
would study later. Fixed
assets are the part of
long-term assets in
the
balance
sheet and working capital is
net position of current assets
and current liabilities on the
balance
sheet.
We
need to understand why capital
budgeting is so important and why do we
have to invest in fixed
assets?
The answer is simple; the
equipment or machinery and
other fixed assets depreciate
over a
period,
they lose their productivity
and get obsolete after sometime.
These assets need to be
replaced
with
new assets. This replacement
involves investment in fixed
assets.
Moreover,
if a company intends to start a new
project, Capital Budgeting techniques
are employed
to
assess the financial viability of the
project. Suppose, for
instance, a company wants to introduce
a
new
soap and launching of the new
product demands changes in the
manufacturing process, the
company
will have to purchase new
equipment in the form of fixed
assets. Capital budgeting is
a
technique
used to evaluate the value of
investment and projects in fixed
assets. It is also used to
assess
the
working capital requirements. Combined
together it helps the company management
to decide
whether
the new venture should be
taken up or not.
Capital
budgeting is a decentralized function. In
big corporations, this
function is not an
individual's
job,
rather, different departments and
teams are assigned to work
on different aspects of
capital
budgeting.
Department managers prepare the budget
for fixed assets in coming
years, which is quite
helpful
in capital budgeting. Besides, there
are project managers who
make the budget for a new
project;
the
cost accountants `count the
cost' and assess the
expenses to be incurred; the market
researches
provide
their input about the
consumer psychology and
sales potential. There may be as
many
departments
involved in capital budgeting, as there
are present in an
organization.
The
biggest challenge in capital
budgeting is to keep finding the valuable
projects, i.e., projects that
may
add to the value of the firm. You
must be familiar with the
basic objective of financial
management
by
now, which is to maximize shareholders'
wealth. This is possible only by
investing in the projects,
which
have positive net present value,
which in effect will
increase the shareholders' wealth.
Most
of the developed companies operate in an
efficient market environment. We
will discuss
efficient
markets at length after
studying the concept of risk
akin to financial decisions. However,
to
give
you an idea, efficient
markets can
be described as highly competitive
markets where good
business
ideas are taken up
immediately.
For
instance, in Pakistan, about ten to
fifteen years ago there was
a video game craze. It was
initially
a
good business idea, as it
required a very low-level
investment, good profit margins, and
short payback
periods.
However, since the markets
in Pakistan are quite efficient, the
information about the
business
spread
quickly. More and more
people started entering into
the business and as a result, the
profit
margins
started shrinking and the lucrative
business opportunity faded
out in three or four
years.
The
same situation comes across
the departmental heads of different
companies. They may start
a
new
lucrative project, which may
sound more than feasible at a
given time. However, the
competitors
get
to know the new business
opportunity, and because of market
efficiency, those lucrative
profits do
not
remain lucrative
anymore.
39

Financial
Management MGT201
VU
Techniques
of capital budgeting:
Capital
budgeting is a mathematical concept in the
sense that we have to use
different
quantitative
investments criteria to evaluate whether
an opportunity is worth investing in or
not.
Some
of these techniques of capital budgeting
are as under
1.
Pay back period
2.
Return on investment
(ROI)
3.
Net Present Value
(NPV)
4.
Profitability Index
(PI)
5.
Internal Rate of Return
(IRR)
We
will assume that the interest rate, or
the discount rate, or the required of
return, which we use
in
calculating
the net present value is given,
later on, when we will
discuss the concept of risk, we
would
see
how the discount rate is calculated
.
For
now, let us talk about the
pay back period.
Pay
back period:
In
this technique, we try to
figure out how long it
would take to recover the invested
capital
through
positive cash flows of the
business.
Reverting
back to the cafe example, an initial
investment of Rs. 200,000 is
required to start the
business;
Rs 10,000 per month are expected to be
earned for the first year,
and Rs 20,000 would
be
earned
every month in the second
year.
Now
according to the aforementioned
assumptions, in the first year,
you earn Rs.10, 000
per
month,
which make Rs. 120,000 for
the year (twelve months). Since you had
invested Rs. 200,000
initially
of which Rs. 120,000 have
been recovered in the first year,
you are still Rs.80,
000 short of
recovering
your initial investment. In the
second year, you would be
earning Rs. 20,000 per
month, so
the
remaining Rs. 80,000 can be
recovered in the next four months. We can
say that the initial
invested
capital
can be recovered in 16 months, or the payback
period for this investment
is 16 months. The
shorter
the payback period of a project, the more
an investor would be willing to
invest his money in
the
project.
While
the payback period is a simple and
straightforward method for analyzing a
capital
budgeting
proposal, it has certain
limitations. First and the foremost
problem is that it does not
take into
account
the concept of time value of
money. The cash flows
are considered regardless of the time
in
which
they are occurring. You must
have noticed that we have not
used any interest rate while
making
calculation.
Now,
let us talk about the next
budgeting criteria called
return on investment.
Return
on Investments:
The
concept of return on investment
loosely defined, as there are a number of
ratios that can be
used
to analyze return on investment. However,
in capital budgeting it implies the
annual average cash
flow
a business is making as a percentage of
investment. In other words, it is an
average percentage of
investment
recovered in cash every
year.
The
formula for return on
investment is as follows:
ROI=
(∑CF/n)/IO
Dividing
the average annual cash flow
by the initial investment, we can
calculate the return on
investment.
Example:
Taking
the same example of a café, the
initial investment of Rs.200,000, Rs
10,000 per month
profit
in the 1st year in Rs 20,000 per month
profit for the second year,
we can easily calculate the
ROI.
40

Financial
Management MGT201
VU
ROI=
((120,000+240,000)/2)/200,000= 0.90 =
90%
Where,
Rs 120,000=cash flow for 1st year
at Rs 10,000 per month
Rs
240,000=cash flow for the 2nd year at Rs 20,000 per
month.
n=2
years
Return
on Investment is also very
easy to calculate, but like
payback period, it does not
take into
account
the time value of money
concept.
A
high ROI ratio is considered
better and 90% is a very
good rate of return but
before
deciding
whether or not this project
should be taken up, we
should compare this project
with the
alternative
opportunities on hand. It is also
important to take into
consideration the prevailing rate
of
inflation
in the country so that the returns could
be adjusted accordingly. However, we
would talk about
the
inflation rate and market interest rate
in more detail later.
The
next and the most important
criteria for evaluating a
capital budgeting proposal is net
present value.
Net
Present Value
(NPV):
NPV
is a mathematical tool which uses the
discounting process, something that we
have found
missing
in the aforementioned capital budgeting
techniques. Net Present Value is
defined as the value
today
of the Future
Incremental After-tax Net Cash Flows
less
the initial investment.
The
formula for calculating NPV
is as follows:
NPV=-IO+∑CFt/
(1+i) t
Where,CFt=cash flows occurring in
different time
periods
-IO=
Initial cash outflow
i=discount
/interest rate
t=year
in which the cash flow takes
place
Initial
cash outflow, being an
outflow, is always expressed as a
negative figure.
NPV
is considered one of the most popular
capital budgeting criteria.
The disadvantage with the
NPV
is that it is difficult to calculate
since these calculations are
based on too many
estimates.
In
order to calculate the NPV we need to
forecast the future cash
flows and sales; the discount
factor is
also
an estimate. If the NPV of a project is
more than zero, it should be
accepted. If two or more projects
under
contemplation, then the one with the
higher NPV, should be
accepted. When a company invests
in
projects
with positive NPV, they
raise the shareholders' wealth or
company's value. This would
also
increase
the market value added and the economic
value added for the
firm.
Example:
Taking
the same example of a café, an
initial investment of Rs.200, 000, Rs
10,000 per month
profit
in the 1st year in Rs 20,000 per month
profit for the second year.
However, for the calculation
of
the
NPV we would be requiring another
important input--the discount rate.
Assume the discount rate is
10
percent. Ten percent is what you at
least expect to earn from the
business. This is the rate of
return,
which
you can get by simply
putting your money with a
bank. If the business cannot yield more
than 10
percent,
then it is pointless to take unnecessary
headache of setting up a business and
running it, since
ten
percent can be earned with a
no-sweat-effort of placing the money
with a bank.
Where,CFt=cash flows occurring in
different time periods, i.e., Rs
120,000 in the first year and
Rs
240,000
in the second year
-IO=
Initial cash outflow =
-200,000
i=discount
/interest rate = 10 percent
t=
2 years
Putting
in the values in the formula
41
Financial
Management MGT201
VU
NPV=-IO+∑CF/i
=-200,000+120,000/(1+0.10)+240,000(1+0.10)2
=
- 200,000 +
109,091
+
198,347
=+Rs.107438
At
the end of 2nd year, the NPV is +ve,
you can also solve
this example by
monthly
compounding
if you want to have a more precise
answer.
The
cash flows at the end of the first
year and second year will
have to be brought back to the
present.
The
present value of the cash
flows occurring at the end of the first
year can be calculated by
dividing
the
cash flows by 1 plus
discount factor as
under.
120000/(1+0.10)
= 109,091
The
cash flow occurring at the end of the
second year can be calculated by
dividing the cash
flow
by one plus discount factor
squared.
240,000/1+(0.10)2 =
198,347
NPV=-2000000+120000/(1+0.10)+240000/(1+0.10)2
=-200000+109091+198347
=+Rs.107438
at the end of second year
NPVis +ve
In
other words, according to your
cash flow forecast and
required return, two years
of running this
business
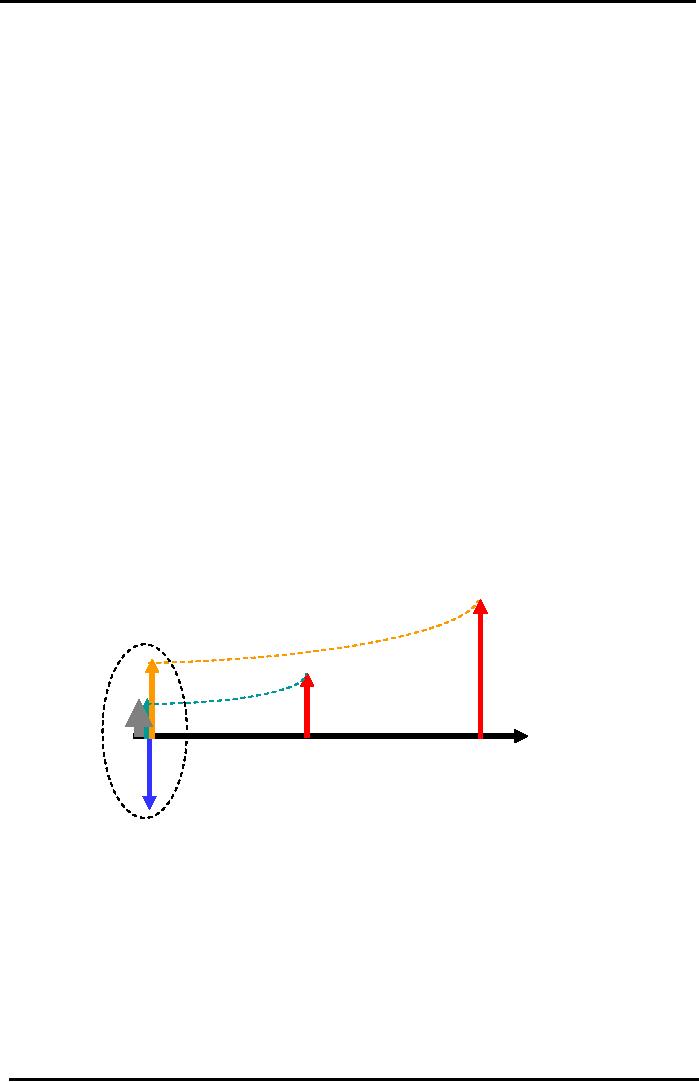
is worth Rs 107,438 in cash to
you today. The following
diagram can explain the
point further.
Investment
Criteria
N.P.V
(Café Example Cash Flow
Diagram)
CF2
= Rs
240,000
Rs
198,347
CF1=Rs
120,000
Rs
109,091
NPV
= Rs
107,438
i
= 10%
i
= 10%
Yr
0 (Today)
Yr
1
Yr
2
Io
= Rs
200,000
The
next criterion that we would
talk about here is the
profitability index, or the cost-benefit
ratio.
Probability
Index:
It
is quite similar to the NPV in
terms of concept and calculation.
Profitability index
may
be defined as the ratio of the present
value of future cash flows
to the initial investment.
The
profitability index can be
calculated using the following
formula.
PI
= [Σ
CFt /
(1+ i) t
]/
IO
42

Financial
Management MGT201
VU
Those
projects with a profitability index
ratio of more than one (PI
>= 1.0) are considered
acceptable.
Here it is important to mention
that those projects, which
are ranked as acceptable
using the
NPV
method, would also be
acceptable on the profitability index
criteria.
Example:
The
profitability index for the
café example can be
calculated as under.
PI
= [120,000]/ (1+ 0.1) +
[240,000 / (1+ 0.1)2]/200,000
=
(109,091 + 198,347) / 200,000 = 1.
54
PI
= 1.54 > 1.0
Therefore,
the project is acceptable. Notice
that we have taken into
consideration the annualized
return.
The same can be calculated
using the monthly returns with a
slight adjustment in the formula
as
we
have studied in the previous lectures. If there were
two or more projects that need
ranking, the one
with
the highest profitability index
would be acceptable.
Let
us now talk about the fifth
and the final capital budgeting
criteria of our course,
known as Internal
Rate
of Return (IRR).
Internal
Rate of Return (IRR):
IRR
is a widely used and an
important measure, which is more common
in practice than the
NPV.
IRR, unlike NPV that is
expressed in dollar amounts, is
always quoted in terms of
percentage,
which
makes it comparable to the other market
interest rates or the inflation
rate.
RR
calculation involves the same
equation that we have earlier
used for the calculation of
NPV.
The
only difference is that
while calculating IRR we
would set the value of NPV
equal to zero and
then
solve
the equation for the value if
`i'. In other words, the value of
`i', at which the net present
value of
the
project equals zero would be
considered as the internal rate of return of the
project.
his
is important to remember that
unlike NPV calculation, the
value of IRR is constant in
every
year
for the life of the project.
While working out the NPV,
we can change the discount
rate for every
single,
but for IRR you
would come up with a rate
that is constant and fixed
for every single year in
the
life
of the project. Another simplistic
explanation of IRR can be
that it is the break-even rate of
return.
In
other words, at this rate of return, we
would be able to recover the initial
investment in project's
lifetime.
RR
is calculated by a trial and error method
or iteration. Finding the value of an
unknown
variable
may involve solving of
higher degree polynomial equations and
the easiest way to go about it
is
to
use trial and error
method.
n
a trial-and-error method, we tryout a
value of `i', and see if the
equation comes to the value
of
zero;
if it does not, try another
value, even if the second value
does not bring the equation
down to zero
and
so on. The higher the IRR,
the better it is considered, however,
which value of the IRR can
be
considered
as acceptable is difficult to measure. We
would discuss more details of it in the
coming
lectures.
Another
important distinction needs to
clarification here is that the
internal rate of return is
different
from the discounting rate that we
use in the calculation of the NPV. In the
NPV formula, we
used
the discount rate as the required rate of
return that we expected the project to
generate. In case of
IRR,
we used the existing cash
flows to find the forecasted
return. These two different
interpretations of
`i'
should be kept in mind while
calculating NPV and
IRR.
We
can calculate the IRR for the
café project in the following manner.
Using the same formula of
NPV,
we
can put the values in the
formula
IRR
Equation:
NPV=
-IO +CF1/
(1+IRR) + CF2/
(1+IRR) 2
=
0= -200,000 + 120,000/ (1+0.1) +
240,000/ (1+0.1)2
Solving
the equation assuming IRR to be 10
percent, we have obtained a figure of
107,483, which was
calculated
as our NPV for the café
project. However, in order to
bring the NPV down to zero,
we need
43

Financial
Management MGT201
VU
to
apply a higher rate as an
assumed IRR. If we assume
IRR to be 50 percent the equation can be
solved
as
follows.
NPV=
-IO +CF1/
(1+IRR) + CF2/
(1+IRR) 2
=
0= -200,000 + 120,000/(1+0.5) +
240,000/(1+0.5)2
The
calculation gives us a figure of
-13,333, which is lesser
than zero. In order to bring
the value equal
to
zero we would use a rate
lesser than 50 percent.
Trying
out various IRR rates, we
can finally reach a rate of
43.6 percent at which the value
of
NPV
would come down to -48
which is close to zero. If we
try out IRR with more
decimal places, we
can
bring the value of NPV equal
to zero. However, with approximation,
43.6 percent is the actual IRR
of
the project.
Send
you query to
registrar.
More
details about the IRR and the
NPV would be discussed in the
next chapter.
44
Table of Contents:
- INTRODUCTION TO FINANCIAL MANAGEMENT:Corporate Financing & Capital Structure,
- OBJECTIVES OF FINANCIAL MANAGEMENT, FINANCIAL ASSETS AND FINANCIAL MARKETS:Real Assets, Bond
- ANALYSIS OF FINANCIAL STATEMENTS:Basic Financial Statements, Profit & Loss account or Income Statement
- TIME VALUE OF MONEY:Discounting & Net Present Value (NPV), Interest Theory
- FINANCIAL FORECASTING AND FINANCIAL PLANNING:Planning Documents, Drawback of Percent of Sales Method
- PRESENT VALUE AND DISCOUNTING:Interest Rates for Discounting Calculations
- DISCOUNTING CASH FLOW ANALYSIS, ANNUITIES AND PERPETUITIES:Multiple Compounding
- CAPITAL BUDGETING AND CAPITAL BUDGETING TECHNIQUES:Techniques of capital budgeting, Pay back period
- NET PRESENT VALUE (NPV) AND INTERNAL RATE OF RETURN (IRR):RANKING TWO DIFFERENT INVESTMENTS
- PROJECT CASH FLOWS, PROJECT TIMING, COMPARING PROJECTS, AND MODIFIED INTERNAL RATE OF RETURN (MIRR)
- SOME SPECIAL AREAS OF CAPITAL BUDGETING:SOME SPECIAL AREAS OF CAPITAL BUDGETING, SOME SPECIAL AREAS OF CAPITAL BUDGETING
- CAPITAL RATIONING AND INTERPRETATION OF IRR AND NPV WITH LIMITED CAPITAL.:Types of Problems in Capital Rationing
- BONDS AND CLASSIFICATION OF BONDS:Textile Weaving Factory Case Study, Characteristics of bonds, Convertible Bonds
- BONDS VALUATION:Long Bond - Risk Theory, Bond Portfolio Theory, Interest Rate Tradeoff
- BONDS VALUATION AND YIELD ON BONDS:Present Value formula for the bond
- INTRODUCTION TO STOCKS AND STOCK VALUATION:Share Concept, Finite Investment
- COMMON STOCK PRICING AND DIVIDEND GROWTH MODELS:Preferred Stock, Perpetual Investment
- COMMON STOCKS RATE OF RETURN AND EPS PRICING MODEL:Earnings per Share (EPS) Pricing Model
- INTRODUCTION TO RISK, RISK AND RETURN FOR A SINGLE STOCK INVESTMENT:Diversifiable Risk, Diversification
- RISK FOR A SINGLE STOCK INVESTMENT, PROBABILITY GRAPHS AND COEFFICIENT OF VARIATION
- 2- STOCK PORTFOLIO THEORY, RISK AND EXPECTED RETURN:Diversification, Definition of Terms
- PORTFOLIO RISK ANALYSIS AND EFFICIENT PORTFOLIO MAPS
- EFFICIENT PORTFOLIOS, MARKET RISK AND CAPITAL MARKET LINE (CML):Market Risk & Portfolio Theory
- STOCK BETA, PORTFOLIO BETA AND INTRODUCTION TO SECURITY MARKET LINE:MARKET, Calculating Portfolio Beta
- STOCK BETAS &RISK, SML& RETURN AND STOCK PRICES IN EFFICIENT MARKS:Interpretation of Result
- SML GRAPH AND CAPITAL ASSET PRICING MODEL:NPV Calculations & Capital Budgeting
- RISK AND PORTFOLIO THEORY, CAPM, CRITICISM OF CAPM AND APPLICATION OF RISK THEORY:Think Out of the Box
- INTRODUCTION TO DEBT, EFFICIENT MARKETS AND COST OF CAPITAL:Real Assets Markets, Debt vs. Equity
- WEIGHTED AVERAGE COST OF CAPITAL (WACC):Summary of Formulas
- BUSINESS RISK FACED BY FIRM, OPERATING LEVERAGE, BREAK EVEN POINT& RETURN ON EQUITY
- OPERATING LEVERAGE, FINANCIAL LEVERAGE, ROE, BREAK EVEN POINT AND BUSINESS RISK
- FINANCIAL LEVERAGE AND CAPITAL STRUCTURE:Capital Structure Theory
- MODIFICATIONS IN MILLAR MODIGLIANI CAPITAL STRUCTURE THEORY:Modified MM - With Bankruptcy Cost
- APPLICATION OF MILLER MODIGLIANI AND OTHER CAPITAL STRUCTURE THEORIES:Problem of the theory
- NET INCOME AND TAX SHIELD APPROACHES TO WACC:Traditionalists -Real Markets Example
- MANAGEMENT OF CAPITAL STRUCTURE:Practical Capital Structure Management
- DIVIDEND PAYOUT:Other Factors Affecting Dividend Policy, Residual Dividend Model
- APPLICATION OF RESIDUAL DIVIDEND MODEL:Dividend Payout Procedure, Dividend Schemes for Optimizing Share Price
- WORKING CAPITAL MANAGEMENT:Impact of working capital on Firm Value, Monthly Cash Budget
- CASH MANAGEMENT AND WORKING CAPITAL FINANCING:Inventory Management, Accounts Receivables Management:
- SHORT TERM FINANCING, LONG TERM FINANCING AND LEASE FINANCING:
- LEASE FINANCING AND TYPES OF LEASE FINANCING:Sale & Lease-Back, Lease Analyses & Calculations
- MERGERS AND ACQUISITIONS:Leveraged Buy-Outs (LBOs), Mergers - Good or Bad?
- INTERNATIONAL FINANCE (MULTINATIONAL FINANCE):Major Issues Faced by Multinationals
- FINAL REVIEW OF ENTIRE COURSE ON FINANCIAL MANAGEMENT:Financial Statements and Ratios