 |

Financial
Management MGT201
VU
Lesson
15
BONDS
VALUATION AND YIELD ON BONDS
Learning
Objectives:
After
going through this lecture,
you would be able to have an
understanding of the following
topics
·
Bond
Valuation
·
Yield
of Bonds
In
previous lecture, we studied
are bonds are long term
debt instruments. Like Stock
bonds are also
direct
claim securities which means
that the value of these
bonds is determined by the future
cash flows
that
bond holders will receive.
These cash flows are of
two basic types
1.
Cash inflow: in the form of
coupon receipt with regular
interval over the life of the
bond
2.
Other cash flow is the par
value of the bond which you
will receive at the maturity
date of the
bond.
Present
Value formula for the
bond:
n
PV= ∑ CFt
/
(1+rD)t
=CF1/(1+rD)+CFn/(1+rD)2
+..+CFn/
(1+rD)
n
+PAR/
(1+rD)
n
t
=1
NPV
= Intrinsic Value of Bond or
Fair Price (in rupees) paid
to invest in the bond. It is the Expected
or
Theoretical
Value and needs to be
compared to the Market Price. It is
different from the Par (or
Face)
Value
which is printed on the Bond
paper.
rD
= Bondholder's (or Investor's)
Required Rate of Return for
investing in Bond (Debt).
DIFFERENT
from
the Coupon Rate and the Market /
Macroeconomic Interest Rate!
There
are basically 2 kinds of Cash
Flows:
(1)
Annuity from Fixed Regular
Coupon Receipts (CF= Coupon
Rate x Par Value) and
(2)
Single Cash Flow from
Par Value (or Initial
Investment) Returned to the Investor on
maturity.
In
this equation
rD:
It
represents the required rate of
return. It is the return which is
required by the investor based
on
his
opportunity cost. In case of Pakistan,
the investor required a higher
return on bond then the rate
of
markup
offered by the PLS account in
bank. It is different from the
Coupon Rate and the Market
/
Macroeconomic
Interest Rate.
Coupon
or CF:
It
is a fixed rate and it is equal to
(CF=
Coupon Rate x Par
Value)
Par
value of the bond is fixed
but the market price varies
with the change in the supply
and demand,
perception
of investor for that
bond.
Example:
Defense
Savings Certificates: Suppose that
you invest in a Defense Savings
Certificate whose Par
Value
is Rs 100,000. The Bond
Issuer is the Government of Pakistan. The
Certificate has small
detachable
coupons. You (as the Bondholder or
Investor) can present one
Coupon at the end of
every
month and receive Rs 1,000
cash. After 1 year, you
will be repaid your
Principal Investment
(or
Par Value) of Rs 100,000.
Assume your Required Return
(rD) is 10% pa. What is the
Present
Value
of this Investment to
you?
In
the previous lectures, we have solved
simple version of similar
example we solved a
problem
similar
to this where we had to calculate the NPV
of the Defense Savings Certificate with 1
Annual
Coupon
payment after 1 year.
We
arrived at the following approximate
answer:
NPV
=
-Io
+
CF1
/ (1+ i) +
CFI1
/ (1+ i)
=
-100,000 + 12,000/(1+0.10) +
100,000/(1+0.10)
=
-100,000 +
10,909
+
90,909
=
1,818
(NOTE:
PV = NPV + Io = 10,909 + 90,909 =
101,818)
But
this is not the correct exact answer to
our present example because
it ignores monthly compounding.
Accurate
Solution - Monthly
Compounding:
The
Accurate solution to the Savings
Certificate Example with
Monthly Coupons requires us to
use
a monthly cash flow diagram
and do monthly discounting. There is an
Annuity Stream of 12
70
Financial
Management MGT201
VU
Coupons
(Cash Inflows) of Rs 1,000
each at the end of every
month. There is a final Cash
Inflow worth
the
Par Value of Rs 100,000 at the end of the
12th month.
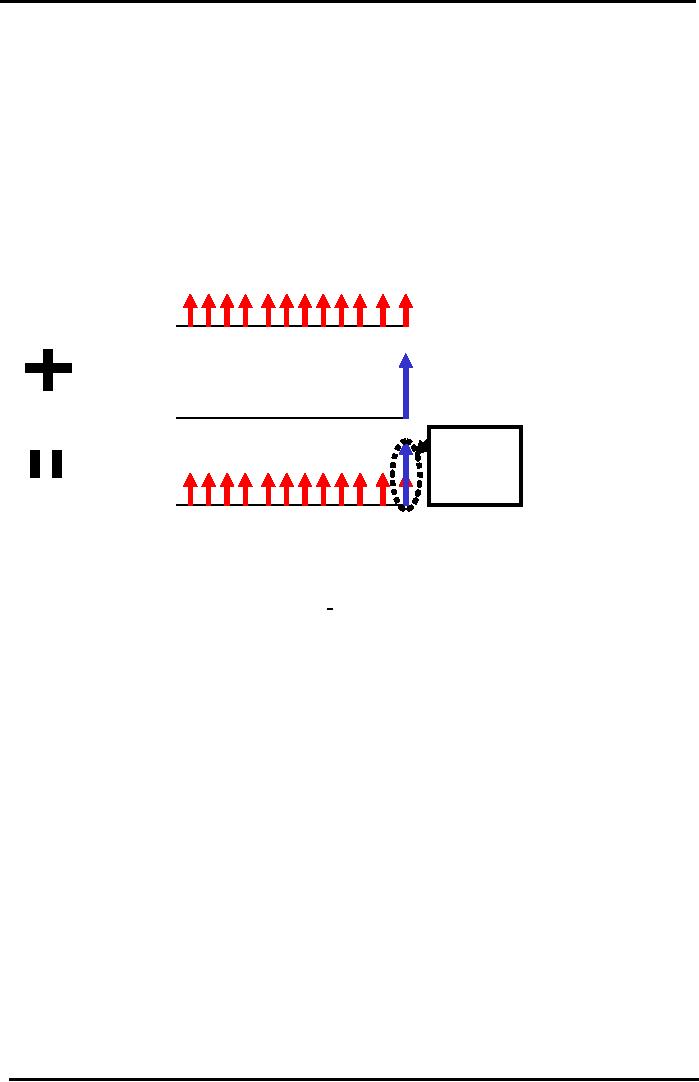
The
Cash Flow Diagram for Bonds
is a Combination of 2 Flows: (1) an
Annuity Stream (of
Coupon
Receipts) every month for 12
months and (2) One Par
Receipt at the end of the 12th
month.
You
can draw their individual
Cash Flow Diagrams and then add them up
later. You can compute
their
PV's
separately and then add them up
later.
Cash
flows from coupons
represents by the upward pointing arrows
which represents cash
inflows.
In
combine diagram, at the end of the
year there are two upward
pointing arrows. One
for
coupon
rate and the other is for the
payment of par value of
bond.
Bond
Cash Flow Diagram
Savings
Certificate Example
Rs
1,000
Coupon
Annuity:
(Monthly)
Time
(Months)
12
01
2
6
Rs
100,000
Par
Receipt :
0
12
(at
Maturity)
2
Cash Flow
Arrows
at
SAME
point in
time
can be
Combined
added.
Time
(Months)
12
Cash
Flow
01
2
6
Diagram
Calculate
the PV of Coupons from the FV Formula for
Annuities (with multiple
compounding
within
1 year):
FV
= CCF (1 + rD/m )nxm -
1/rD/m
Use
Monthly Basis for this
example. n = 1 year m = 12
months
CCF
= Constant Cash Flow = Rs 1,000 =
Monthly Coupon
rD
= Annual Nominal Required
Rate of Return for
investment in Bond (Debt) =
10% pa.
Periodic
Monthly Required Rate of
Return is rD/m = 10/12 =
0.833 % = 0.00833 p.m.
m
= 12 months
Coupon
Annuity Cash Flow
Receipts
FV
= 1,000 x [(1.00833)12- 1] /0.00833 =
+Rs 12,566 (at the end of 1
year)
PV
(Coupons Annuity) = FV / (1 + rD/m)
nxm
=
12,566 / (1.00833)12 = +Rs
11,374
Final
Par Value Cash Flow
Receipt
FV
=
100,000 (at the end of 1
year)
PV
(Par) =
100,000 / (1.00833)12 = +Rs
90,522
PV
= PV (Coupons
Annuity) + PV (Par) = 11,374 +
90,522
=
+ Rs 101,896 (Final
Answer)
So
this Certificate is worth Rs
101,896 to you today. It is
worth more than the Market Price
(Rs
100,000).
So it is a good investment.
NOTE:
Our answer is slightly
higher than what we got
when we used Annual
compounding (Rs
101,818).when
we consider multiple compounding the
present value of the bond
increases. Its NPV is
greater
than zero so on the basis of
our capital budgeting techniques
you should invest in that
project.
Now,
we consider over all rate of return on a
bond. We have studied expected price of
the bond. These
two
are complimentary. When
bonds trader talk about he
overall return on a particular
bond they
referred
to yield to maturity.
71

Financial
Management MGT201
VU
Bond
Yield to Maturity
(YTM):
We
can calculate the Value of our
Investment in Bonds. But how
can we compute its Rate
of
Return?
Both are important whether
you are talking about
Investment in Real Assets or
Securities.
The
most common way to compare the
Overall Rate of Return of
different Bonds is to compare
their
YTM's.
In
capital budgeting, you can
calculate IRR using the NPV
equation. Similarly, you can
calculate it
by
setting the PV Equation for
Bond Valuation equal to the
Present Market Price and
solve for "rD".
Use
Trial and Error or
Iteration. The value of "rD"
that gives PV = Market Price is the YTM
for that
Bond.
PV
=
Bond Market Price =
CFt
/
(1+rD)t
CF1/
(1+rD)
+CF2/(1+rD)2+...+CFn/(1+rD)n+
PAR/(1+rD)n
All
variables are known (ie.
CF, PAR, and n) EXCEPT
rD
.Set
PV equal to the Actual Present
Market
Price
of Bond and solve for
rD
YTM
= rD
Bond
YTM Example:
Term
Finance Certificate (TFC): The
TFC (a kind of Bond) of
Company ABC is traded in the
Karachi
Stock Exchange for Rs 900.
The Par Value of the TFC is
Rs 1,000. The Coupon Rate is
fixed
at
15% pa. Coupons are paid
annually. The TFC will
Mature after exactly 2 Years
(it is a 5 Year Bond
issued
3 Years ago). What is the
Overall Expected Rate of Return
(ie. YTM) offered by this
TFC?
Market
Price (Rs 900) is LESS than
its Par Value (Rs
1,000). This Bond is selling
at a Discount. Why?
Possibly
Interest Rate Risk. Market
Interest Rate rises above
TFC's Fixed Coupon Rate so
Market Price
of
the TFC falls below Par.
Note: when Market Interest
Rates rise, Required Rate of
Return (rD) for
Investors
rises. But, Coupon Rate
fixed by Bond Issuer at time
of issue.
The
Expected (or Promised) Rate of Return
for Investors is the Yield to
Maturity (or YTM).
Compute
the Overall Return (or YTM)
for the TFC using the Old
IRR-like Approach:
PV
= Market Price = Rs 900
Par
Value =Rs 1,000. Receive
this after 2 Years
(remaining life)
Annual
Coupons =Coupon Rate x Par
=15%x1, 000 = Rs 150
rD
=
Minimum Return Required by the
Investors investing in
The
Bond Market = YTM.
This
is unknown in the equation.
PV
= 900 = 150 / (1+ rD) +
150 / (1+rD)2
+
1,000 / (1+rD)2
900
= 150 / (1+ rD) +
1,150 / (1+rD)2
. Use
Trial & Error
rD
> 15%:
Try
rD = 20%: PV = 924 (close)
Try
rD = 21%: PV = 909 (closer)
YTM
= 21.7%: (Gives
PV=Rs 900)
YTM:
YTM is the expected rate of return for
which the bond holder holds
the bond until maturity but
if
the
bond holder before maturity
is called by the issuer or if the holder
of the bond decides to sell
the
bond
before maturity then your
answer will change .all the
calculation will remain the
same only par
value
is replaced as
n
PV=∑ CFt /
(1+rD)t
=CF1/(1+rD)+CF2/(1+rD)2+...+CFn/(1+rD)n+CALL/(1+rD)n
t=1
Where
CALL = PAR Value + 1 Year's
Worth of Coupon
Receipts
YTM
=Total or Overall Yield = Interest
Yield + Capital Gains
Yield
TFC
Example Total Yield = YTM =
+21.7%
Interest
Yield or Current Yield = Coupon /
Market Price
TFC
Example Interest Yield = Rs
150 / Rs 900 = +16.7%
pa
Capital
Gains Yield = YTM - Interest
Yield
TFC
Example Capital Gains Yield
= 21.7% - 16.7% = +5 %
n
=
Maturity or Life of Bond (in
years)
FV=CCF[(1+rD/m)n*m-1]/rD/m
N=1
year ,m= no. of intervals in
a year =12
CCF=constant
cash flow =1000=monthly
copoun .we can plug the
values in this formula to know
what
the
future value of annuity is
going to be ?take a look at the copoun
annuity :
72

Financial
Management MGT201
VU
FV=1000[(1-0.00833)12-1]/0.0083=+12566
at the end of one year what
is the present value of
this
copoun
annuity
PV=FV/(1+rD/m
)n*m
=12566(1.00833)12
=+11374
This
is the present value of cash
flow from coupon. Now we
need to calculate the present
value of face
value
at maturity suppose face
value =100,000 then
PV(PAR)=100,000/(1.00833)12
=+90,522
Now,
we combine the present value of
coupon interest and present
value of par both
i.e.=11374+90522=
Rs.101896.
When
we compare the answer with
annual cash flows where
coupon was not
compounded
monthly
.it is grater because monthly
compounding increase future
cash flows as well as the
present
value
.2nd thing is that this
NPV is grater than the initial
investment which is Rs.100,000so, we
should
under
take this project because
the NPV is grater .now, the next
area is the rate of return
so, the
important
thing in this regard is yield to
maturity .this is abbreviated as
YTM.it is easy to understand
because
we have discussed IRR in capital
budgeting .where we set NPV=0 and
calculated for r .here
market
price is the YTM of the bond and
then solving for the
variable rD=required
rate of return .so,
let's
try to understand YTM using a very
simple example ,the example
that we will pick out is
that of
term
finance certificate or TFC
which is by the stock exchanges of Pakistan
for Rs.900.let's assume
that
its
par value is Rs.1000fixed or coupon
interest rate is 15 p.a. and it is paid annually
,total life of the
TFC
is 5 years 3 years have already
passed and it will mature 2
years from now what
will be over all
expected
rate of return .So, let's
see the equation if we compute the over
all yield here we can
equate
PV=market
value is the YTM for the bond the
PV=900 which is market price
PAR=1000.
Annual
coupon rate =coupon rate *par
=15/100*1000=150
rD=minimum return required by
the investor in the bond market =YTM it
is unknown ?
PV=
900=150/(1+rD )+150/
(1+rD)2+1000/(1+rD)2
we
also know that the value of
rD should be more than 15%
you will try different
values for example if
you
try 20% you will
come up with PV=24
(close),try rD=21.7% PV=900
so,
YTM
=21.7% =900
Therefore
21.7% is the yield to maturity
for this TFC because
rD=YTM .YTM is the expected
rate
of return for which the bond
holder holds the bond until
maturity but if the bond
holder before
maturity
is called by the issuer or if the holder
of the bond decides to sell the
bond before maturity
then
your
answer will change .all the
calculation will remain the
same only par value is replaced as
call value
so,
Call=par
value +I, year copoun
receipts
Another
thing to keep in mind is that YTM
has two components first
is
YTM=interest
yield on bond +capital gain
yield on bond from his
example
YTM=
21.7% so,let's calculate the interest
yield
INTEREST
YIELD =annual copoun interest /market
price
=150/900
=16.7% so,
CAPITAL
YIELD =YTM INTEREST YIELD
=21.7%-16.7%=5%
73
Table of Contents:
- INTRODUCTION TO FINANCIAL MANAGEMENT:Corporate Financing & Capital Structure,
- OBJECTIVES OF FINANCIAL MANAGEMENT, FINANCIAL ASSETS AND FINANCIAL MARKETS:Real Assets, Bond
- ANALYSIS OF FINANCIAL STATEMENTS:Basic Financial Statements, Profit & Loss account or Income Statement
- TIME VALUE OF MONEY:Discounting & Net Present Value (NPV), Interest Theory
- FINANCIAL FORECASTING AND FINANCIAL PLANNING:Planning Documents, Drawback of Percent of Sales Method
- PRESENT VALUE AND DISCOUNTING:Interest Rates for Discounting Calculations
- DISCOUNTING CASH FLOW ANALYSIS, ANNUITIES AND PERPETUITIES:Multiple Compounding
- CAPITAL BUDGETING AND CAPITAL BUDGETING TECHNIQUES:Techniques of capital budgeting, Pay back period
- NET PRESENT VALUE (NPV) AND INTERNAL RATE OF RETURN (IRR):RANKING TWO DIFFERENT INVESTMENTS
- PROJECT CASH FLOWS, PROJECT TIMING, COMPARING PROJECTS, AND MODIFIED INTERNAL RATE OF RETURN (MIRR)
- SOME SPECIAL AREAS OF CAPITAL BUDGETING:SOME SPECIAL AREAS OF CAPITAL BUDGETING, SOME SPECIAL AREAS OF CAPITAL BUDGETING
- CAPITAL RATIONING AND INTERPRETATION OF IRR AND NPV WITH LIMITED CAPITAL.:Types of Problems in Capital Rationing
- BONDS AND CLASSIFICATION OF BONDS:Textile Weaving Factory Case Study, Characteristics of bonds, Convertible Bonds
- BONDS VALUATION:Long Bond - Risk Theory, Bond Portfolio Theory, Interest Rate Tradeoff
- BONDS VALUATION AND YIELD ON BONDS:Present Value formula for the bond
- INTRODUCTION TO STOCKS AND STOCK VALUATION:Share Concept, Finite Investment
- COMMON STOCK PRICING AND DIVIDEND GROWTH MODELS:Preferred Stock, Perpetual Investment
- COMMON STOCKS RATE OF RETURN AND EPS PRICING MODEL:Earnings per Share (EPS) Pricing Model
- INTRODUCTION TO RISK, RISK AND RETURN FOR A SINGLE STOCK INVESTMENT:Diversifiable Risk, Diversification
- RISK FOR A SINGLE STOCK INVESTMENT, PROBABILITY GRAPHS AND COEFFICIENT OF VARIATION
- 2- STOCK PORTFOLIO THEORY, RISK AND EXPECTED RETURN:Diversification, Definition of Terms
- PORTFOLIO RISK ANALYSIS AND EFFICIENT PORTFOLIO MAPS
- EFFICIENT PORTFOLIOS, MARKET RISK AND CAPITAL MARKET LINE (CML):Market Risk & Portfolio Theory
- STOCK BETA, PORTFOLIO BETA AND INTRODUCTION TO SECURITY MARKET LINE:MARKET, Calculating Portfolio Beta
- STOCK BETAS &RISK, SML& RETURN AND STOCK PRICES IN EFFICIENT MARKS:Interpretation of Result
- SML GRAPH AND CAPITAL ASSET PRICING MODEL:NPV Calculations & Capital Budgeting
- RISK AND PORTFOLIO THEORY, CAPM, CRITICISM OF CAPM AND APPLICATION OF RISK THEORY:Think Out of the Box
- INTRODUCTION TO DEBT, EFFICIENT MARKETS AND COST OF CAPITAL:Real Assets Markets, Debt vs. Equity
- WEIGHTED AVERAGE COST OF CAPITAL (WACC):Summary of Formulas
- BUSINESS RISK FACED BY FIRM, OPERATING LEVERAGE, BREAK EVEN POINT& RETURN ON EQUITY
- OPERATING LEVERAGE, FINANCIAL LEVERAGE, ROE, BREAK EVEN POINT AND BUSINESS RISK
- FINANCIAL LEVERAGE AND CAPITAL STRUCTURE:Capital Structure Theory
- MODIFICATIONS IN MILLAR MODIGLIANI CAPITAL STRUCTURE THEORY:Modified MM - With Bankruptcy Cost
- APPLICATION OF MILLER MODIGLIANI AND OTHER CAPITAL STRUCTURE THEORIES:Problem of the theory
- NET INCOME AND TAX SHIELD APPROACHES TO WACC:Traditionalists -Real Markets Example
- MANAGEMENT OF CAPITAL STRUCTURE:Practical Capital Structure Management
- DIVIDEND PAYOUT:Other Factors Affecting Dividend Policy, Residual Dividend Model
- APPLICATION OF RESIDUAL DIVIDEND MODEL:Dividend Payout Procedure, Dividend Schemes for Optimizing Share Price
- WORKING CAPITAL MANAGEMENT:Impact of working capital on Firm Value, Monthly Cash Budget
- CASH MANAGEMENT AND WORKING CAPITAL FINANCING:Inventory Management, Accounts Receivables Management:
- SHORT TERM FINANCING, LONG TERM FINANCING AND LEASE FINANCING:
- LEASE FINANCING AND TYPES OF LEASE FINANCING:Sale & Lease-Back, Lease Analyses & Calculations
- MERGERS AND ACQUISITIONS:Leveraged Buy-Outs (LBOs), Mergers - Good or Bad?
- INTERNATIONAL FINANCE (MULTINATIONAL FINANCE):Major Issues Faced by Multinationals
- FINAL REVIEW OF ENTIRE COURSE ON FINANCIAL MANAGEMENT:Financial Statements and Ratios