 |

Financial
Management MGT201
VU
Lesson
34
APPLICATION
OF MILLER MODIGLIANI AND OTHER CAPITAL
STRUCTURE
THEORIES
Learning
Objectives:
After
going through this lecture,
you would be able to have an
understanding of the following
topics:
·
Applicability
of the Miller Modigliani Capital
Structure theory, Modified Miller
Modigliani
Capital
Structure Theory and other theories to
the Real World to see the Impact of
Debt on Firm
Value
& WACC Graphs
Effect
of Leverage on Cost of Debt & Cost of
Equity:
We
need to know both of these
effects to see the impact of leverage on
WACC.
·
Effect
of Financial Leverage (or Debt) on
Cost of Debt (rD):
At low leverage, increase in
leverage leads to slight
increase in overall risk and
return
of
firm.
At higher leverage, there is risk
of financial distress & bankruptcy.
Therefore, banks
raise
interest rate charges as now company
has become more risky. Cost
of debt raises
faster
and required rate of return (ROR) of
firm's debt holders (rD)
raises faster. So, as
a
result
of leverage financial risk of
firm rises and its cost of
debt also go up.
·
Effect
of Financial Leverage (or Debt) on
Cost of Equity (rE):
Firm's total risk
rises slowly at low leverage
and
Firm's total risk
rises faster when leverage
becomes excessive and risk
of financial
distress
arises. Also, firm's stock
beta rises and firm's stock
required ROR (rE)
rises,
and
cost of equity goes up.
From the Capital asset
pricing model, we know
whenever
the
risk of the firm raises, its
required rate of return also
rises and as a result cost
of
stock
will also go up.
Effect
of Leverage on WACC:
·
WACC
= rDxD +
rExE (assuming
no Preferred Equity) where
xD =
Fraction of Debt
xE =
Fraction of Equity
·
Effect
of Debt on WACC Changes with the
theory choice:
Effect
under Pure MM View (Ideal Efficient
Markets): Its
assumptions are No
Taxes
and No Bankruptcy Costs so Debt
increases Risk BUT is also
cheaper than
Equity.
Change in Debt has no effect
on WACC and Value of the
firm. WACC curve is
flat.
Effect
under Traditionalist View (Tradeoff
Theorists, Real Markets): Combined
Effect
of Taxes and Financial
Distress / Bankruptcy Costs
are a Flat U-Shaped
WACC
Curve
with a Minimum Point which
represents the Optimal Capital Structure
(i.e. Best
Debt
Ratio for the Firm).
Now
we discuss these effects in detail.
First we shall discuss
Effect of Debt on WACC
under
MM
ideal market theory in
detail and then later we
will discuss it under
traditional view.
Effect
of Debt on WACC under MM ideal market
theory:
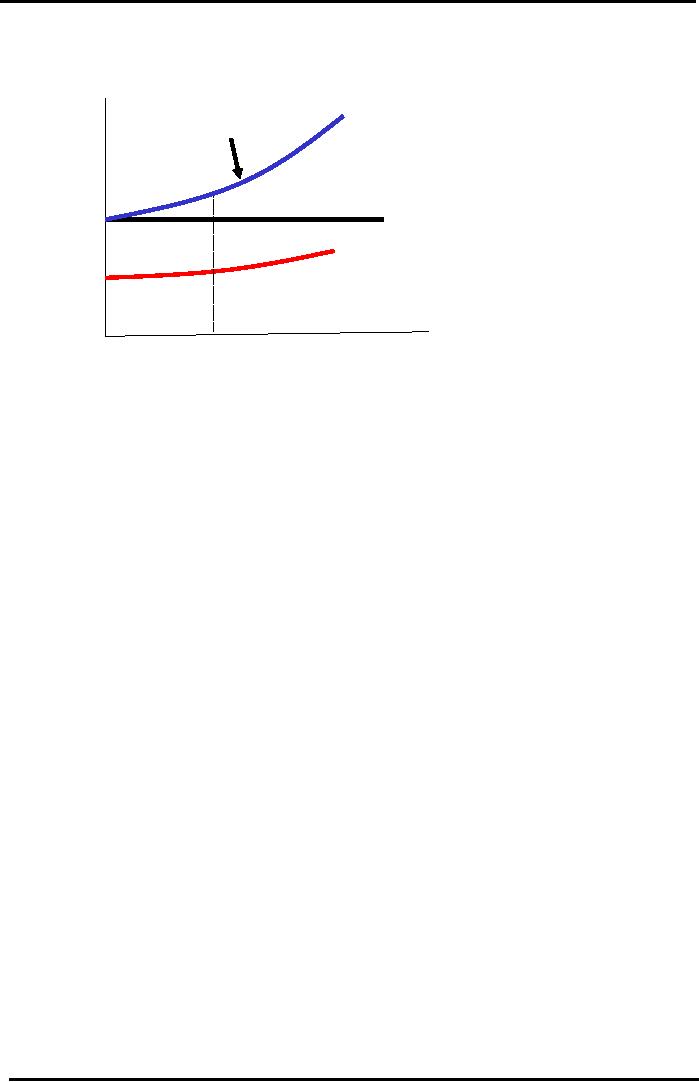
Visualize
the following graph keeping in
view ideal Miller Modigliani
Capital Structure theory
conditions
and assumptions of no taxes and
bankruptcy costs and equal
information available to
all:
146
Financial
Management MGT201
VU
Pure
MM Theory - Ideal Markets
WRisk.CC
Graph
A
Financial
Cost
of
rE =
Cost of Equity
Higher
Required
Capital
Return
on Equity.
=WACC+D/E
(WACC-rD)
Higher
rE
(%)
WACC
=
rE
rDxD
+ rExE
rD =
Cost
rD
of
Debt
Debt
/ Equity =
100%
D/E
= xD / ( 1- xD
)
Equity
Firm
On
the Y-axis we have cost of capital
and on the X-axis Debt to
equity ratio is proportional
to
financial
leverage. WACC is constant shown by
WACC line starting from
point rE on
Y-axis and going
straight
flat along X-axis. We know
WACC
= rDxD +
rExE.
When Debt to equity ratio is
zero at the
origin,
the firm is un levered or 100%
equity firm. As there is no debt the
cost of equity of the firm
is
equal
to its WACC at this point.
The straight line WACC
curve shows there is no change in
WACC
even
after debt under pure MM
ideal markets. As the leverage increases,
cost of debt and cost of
equity
rises
but WACC remains
unaffected.
MM
View - Ideal Markets
Numerical Example:
Now
we do a numerical example to calculate
these impacts just discussed
above:
·
A 100% Equity Firm (or
Un-levered) has Total Assets
of Rs.1000. It has a weighted
average
cost
of capital for un levered
firm (WACCU)
of 21% and Cost of debt for
un levered firm
(
rD,U ) of 10%. It then adds
Rs.400 of Debt. Financial
Risk increases Cost of debt
(rD,L
) of
Levered
Firm to 13%. What is the
Levered Firm's cost of
equity rE,L and WACCL
?
·
Assuming
Pure MM View - Ideal Markets:
Total
Market Value of Assets of
Firm (V) is
UNCHANGED.
Value of un levered firm =
Value of levered firm. Also,
WACC remains
UNCHANGED
by Capital Structure and Debt.
·
WACCU =
WACCL
=
21%
·
Now
we come to the cost of equity of
levered firm
rE,L =WACC
+ Debt/Equity (WACCL -
rD,L)
=
21% + 400/600 (21% -
13%)
=
26.3%
rE,L=
(WACC - rD,L
xD)/
xE
=
(21% - 13% (400/1000)) /
(600/1000)
=
26.3%
·
Cost
of Equity for Levered
Firm
=
rE,L = Risk Free Interest
Rate + Business Risk Premium +
Financial Risk Premium.
rE,L increases
because required ROR for stock
increased because of financial
risk.
147

Financial
Management MGT201
VU
This
is the case of pure MM theory where there
are no taxes and bankruptcy
costs. But in case of
trade
off
theory in reality initially
value of the firm rises as there is
interest tax saving but
with excessive
leverage,
value of the firm starts
declining as interest cost goes
very high due to bankruptcy
risk. This
can
be shown in the following graph:
Tradeoff
Theory Graph
Linked
to Traditionalist Theory of
Leverage
& Optimal Capital Structure
Slightly
Leveraged Firm: Interest
Tax
Shield
Benefit. Total Return to Investors
Excessively
Leveraged Firm:
Rises
so Stock Value Rises.
Total
Return
Threat
of Bankruptcy has Real
=
Net Income (paid to Shareholders)
+
Value
of
Costs.
Less Investor
Interest
(paid to Debt Holders)
Firm
or
Confidence
and Lower Share
Price.
Price
of
Stock
Firm
Remains 100%
Equity
(Un-Levered)
Financial
Leverage =
OPTIMAL
Capital
Debt
/ Assets =
Structure
- MAXIMUM
D/(D+E)
VALUE
& MINIMUM
WACC
Here
maximum value point of the
firm is also the minimum
point of WACC. It is the
best
capital
structure for the firm to operate.
Pure
MM Ideal Markets
Example:
We
know the basic objective of the
firm is to maximize shareholder's
worth.
·
Example: Assuming Pure MM
Theory with Ideal Efficient
Markets where Total
MARKET
VALUE
of Assets of Firm (V =Debt +
Equity) is UNCHANGED by the Capital
Structure (and
Leverage).
Given the following Data on Leverage and
Cost of Capital:
Debt
(D)
Interest
(rD)
Equity
Cost
of Equity
(E
= V-D)
(rE =
(WACC- rD
xD)/
xE)
Rs.0
(=V)
0
Rs.1000
21%
(=WACC) Un-Levered
Rs.200
10%
(rRF)
Rs.800
(21%
- 10% (0.2))/0.8 =
23.75%
Rs.300
11%
Rs.700
(21%
- 11% (0.3))/0.7 =
25.3%
Rs.400
13%
Rs.600
(21%
- 13% (0.4))/0.6 =
26.3%
Rs.500
15%
Rs.200
(21%
- 15% (0.8))/0.2 =
45%
As
the level of debt increases
from Rs.0 to Rs.500 the cost
of equity rises from 21% to
45%.
Consider
the graph we discussed above
again:
148

Financial
Management MGT201
VU
Pure
MM Theory - Ideal Markets
WRisk.CC
Graph
A
Financial
Cost
of
rE =
Cost of Equity
Higher
Required
Capital
Return
on Equity.
=WACC+D/E
(WACC-rD)
Higher
rE
(%)
WACC
=
rE
rDxD
+ rExE
rD =
Cost
rD
of
Debt
Debt
/ Equity =
100%
D/E
= xD / ( 1- xD
)
Equity
Firm
On
the Y-axis we have cost of capital
and X-axis Debt to equity
ratio= Financial leverage.
When
Debt
to equity ratio is zero at the
origin, the firm is un levered or
100% equity firm. As there is no
debt
the
cost of equity of the firm is
equal to its WACC. The
straight line WACC curve
shows there is no
change
in WACC after debt under
pure MM ideal markets. As firm
takes more debt, the line slope at
top
in
the graph increases at an accelerating rate,
this is due to very high
debt that has raised
bankruptcy risk
of
the firm.
·
Problem
of the theory: In Real
Markets, Total Market Value
of Firm (V) DOES CHANGE
as
Leverage
Increases. We have made above
calculations very simply
under ideal
conditions.
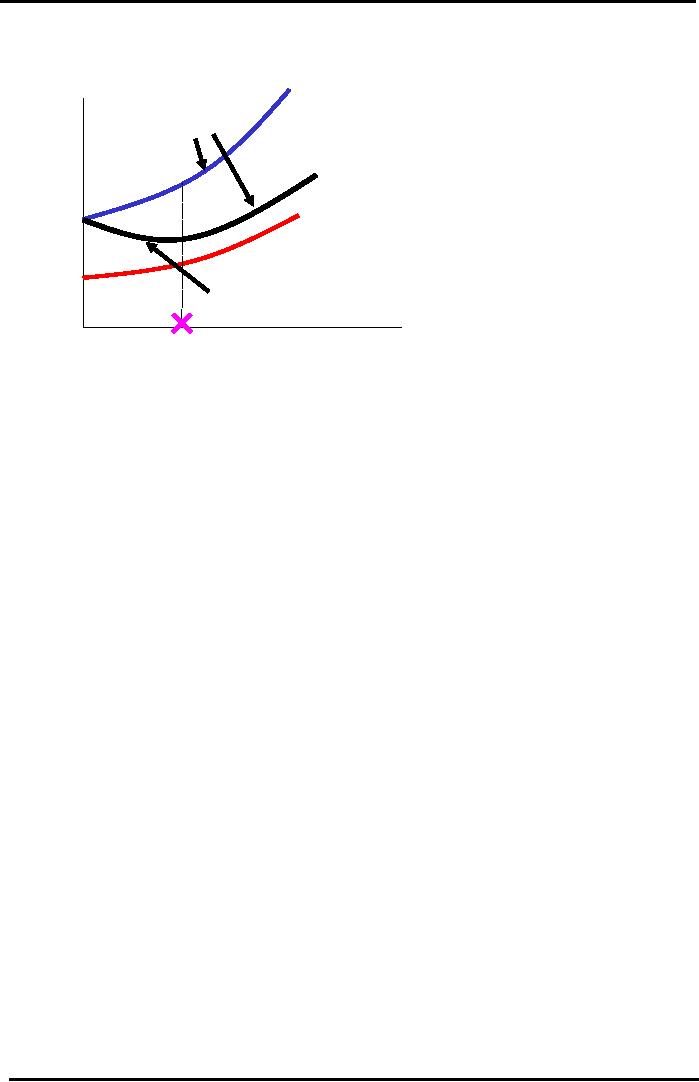
So
we have a traditional view to take
real effects into account. The
following is the same graph
with
traditional
views. Here cost of equity
for a levered firm rises
very fast. Also cost of debt
rises. Another
point
to note is that WACC line
has become curve with a
minimum point at its lowest.
Initially it comes
down
s it moves away from Y-axis
and then after reaching
its minimum it starts going
up. The
minimum
point is the best optimal
point for firm to operate
for it capital structure.
149
Financial
Management MGT201
VU
Traditionalist
Theory - Real Markets
Bankruptcy
Risk
& ACC
Graph
W
Costs.
Higher
Cost
of
Required
Return on
Capital
rE,L =
Cost of Equity =
Equity.
Steeper Rise.
(%)
WACCU +
xD(WACCU
-rD)
(1-TC)
WACCL =
rD(1-Tc)xD + rExE
rE
rD =
Cost of Debt
rD
Interest
Tax Shield
Advantage
100%
Debt
/ Equity =
Optimal
Equity
Capital
D/E
= xD / ( 1- xD
)
Firm
Structure
Note:
xD = D / (D+E)
Traditionalist
View Example:
·
We are using same
example with some additional
information to incorporate the effects of
real
world:
A 100% Equity Firm (or
Un-levered) had total assets of Rs.1000.
It had a WACCU
(Weighted
average cost of capital of un
levered firm) of 21%. It
then added Rs.400 at a cost
of
debt
rD,L (for Levered Firm) of
13%. What is the Levered
Firm's rE,L and
WACCL
(Weighted
average
cost of capital of levered
firm)? Given Data for
rE,
Corporate
tax rate of 30% on Earnings before
Tax, and EBIT = Rs.300.
·
Traditionalist View is based on
Practical Reality. Leverage provides
interest tax savings (or
shield)
but also increases financial
risk. Excessive leverage
leads to bankruptcy risk.
Increases
in
risk will change value of
firm and WACC.
·
Now rE is based on Observed Data and
Equity Value (E) is based on
Simple Income
Statement
Formulas.
·
Traditionalists Formulas for
Equity:
E
= Net Income (NI)/ Cost of
Equity for levered firm
(rE,L)
Note
that
NI
= EBIT - Interest - Tax =
EBT Tax
NI
= (EBIT - xD rD) (1 -
Tc)
rE,L =
WACCU
+ xD (WACCU
- rD ) (1 -
Tc).
·
Traditionalists Formula for
WACC:
WACCL =
xD rD
(1 - Tc) +
xE rE.
(1-Tc)
is the Tax Discount
Factor.
Note:
Value
of firm = Debt +
Equity
xD =
Debt /Value = Debt/ (Debt +
Equity)
xD +
xE = 1
V
= Market Value of Firm D =
Market Value of Debt
E
= Market Value of
Equity
xD =
Fraction of Debt = A Measure of
Leverage
In
the next lecture we shall
continue this discussion and
do more examples to see the impact
of
capital
structure on value of firm.
150
Table of Contents:
- INTRODUCTION TO FINANCIAL MANAGEMENT:Corporate Financing & Capital Structure,
- OBJECTIVES OF FINANCIAL MANAGEMENT, FINANCIAL ASSETS AND FINANCIAL MARKETS:Real Assets, Bond
- ANALYSIS OF FINANCIAL STATEMENTS:Basic Financial Statements, Profit & Loss account or Income Statement
- TIME VALUE OF MONEY:Discounting & Net Present Value (NPV), Interest Theory
- FINANCIAL FORECASTING AND FINANCIAL PLANNING:Planning Documents, Drawback of Percent of Sales Method
- PRESENT VALUE AND DISCOUNTING:Interest Rates for Discounting Calculations
- DISCOUNTING CASH FLOW ANALYSIS, ANNUITIES AND PERPETUITIES:Multiple Compounding
- CAPITAL BUDGETING AND CAPITAL BUDGETING TECHNIQUES:Techniques of capital budgeting, Pay back period
- NET PRESENT VALUE (NPV) AND INTERNAL RATE OF RETURN (IRR):RANKING TWO DIFFERENT INVESTMENTS
- PROJECT CASH FLOWS, PROJECT TIMING, COMPARING PROJECTS, AND MODIFIED INTERNAL RATE OF RETURN (MIRR)
- SOME SPECIAL AREAS OF CAPITAL BUDGETING:SOME SPECIAL AREAS OF CAPITAL BUDGETING, SOME SPECIAL AREAS OF CAPITAL BUDGETING
- CAPITAL RATIONING AND INTERPRETATION OF IRR AND NPV WITH LIMITED CAPITAL.:Types of Problems in Capital Rationing
- BONDS AND CLASSIFICATION OF BONDS:Textile Weaving Factory Case Study, Characteristics of bonds, Convertible Bonds
- BONDS VALUATION:Long Bond - Risk Theory, Bond Portfolio Theory, Interest Rate Tradeoff
- BONDS VALUATION AND YIELD ON BONDS:Present Value formula for the bond
- INTRODUCTION TO STOCKS AND STOCK VALUATION:Share Concept, Finite Investment
- COMMON STOCK PRICING AND DIVIDEND GROWTH MODELS:Preferred Stock, Perpetual Investment
- COMMON STOCKS RATE OF RETURN AND EPS PRICING MODEL:Earnings per Share (EPS) Pricing Model
- INTRODUCTION TO RISK, RISK AND RETURN FOR A SINGLE STOCK INVESTMENT:Diversifiable Risk, Diversification
- RISK FOR A SINGLE STOCK INVESTMENT, PROBABILITY GRAPHS AND COEFFICIENT OF VARIATION
- 2- STOCK PORTFOLIO THEORY, RISK AND EXPECTED RETURN:Diversification, Definition of Terms
- PORTFOLIO RISK ANALYSIS AND EFFICIENT PORTFOLIO MAPS
- EFFICIENT PORTFOLIOS, MARKET RISK AND CAPITAL MARKET LINE (CML):Market Risk & Portfolio Theory
- STOCK BETA, PORTFOLIO BETA AND INTRODUCTION TO SECURITY MARKET LINE:MARKET, Calculating Portfolio Beta
- STOCK BETAS &RISK, SML& RETURN AND STOCK PRICES IN EFFICIENT MARKS:Interpretation of Result
- SML GRAPH AND CAPITAL ASSET PRICING MODEL:NPV Calculations & Capital Budgeting
- RISK AND PORTFOLIO THEORY, CAPM, CRITICISM OF CAPM AND APPLICATION OF RISK THEORY:Think Out of the Box
- INTRODUCTION TO DEBT, EFFICIENT MARKETS AND COST OF CAPITAL:Real Assets Markets, Debt vs. Equity
- WEIGHTED AVERAGE COST OF CAPITAL (WACC):Summary of Formulas
- BUSINESS RISK FACED BY FIRM, OPERATING LEVERAGE, BREAK EVEN POINT& RETURN ON EQUITY
- OPERATING LEVERAGE, FINANCIAL LEVERAGE, ROE, BREAK EVEN POINT AND BUSINESS RISK
- FINANCIAL LEVERAGE AND CAPITAL STRUCTURE:Capital Structure Theory
- MODIFICATIONS IN MILLAR MODIGLIANI CAPITAL STRUCTURE THEORY:Modified MM - With Bankruptcy Cost
- APPLICATION OF MILLER MODIGLIANI AND OTHER CAPITAL STRUCTURE THEORIES:Problem of the theory
- NET INCOME AND TAX SHIELD APPROACHES TO WACC:Traditionalists -Real Markets Example
- MANAGEMENT OF CAPITAL STRUCTURE:Practical Capital Structure Management
- DIVIDEND PAYOUT:Other Factors Affecting Dividend Policy, Residual Dividend Model
- APPLICATION OF RESIDUAL DIVIDEND MODEL:Dividend Payout Procedure, Dividend Schemes for Optimizing Share Price
- WORKING CAPITAL MANAGEMENT:Impact of working capital on Firm Value, Monthly Cash Budget
- CASH MANAGEMENT AND WORKING CAPITAL FINANCING:Inventory Management, Accounts Receivables Management:
- SHORT TERM FINANCING, LONG TERM FINANCING AND LEASE FINANCING:
- LEASE FINANCING AND TYPES OF LEASE FINANCING:Sale & Lease-Back, Lease Analyses & Calculations
- MERGERS AND ACQUISITIONS:Leveraged Buy-Outs (LBOs), Mergers - Good or Bad?
- INTERNATIONAL FINANCE (MULTINATIONAL FINANCE):Major Issues Faced by Multinationals
- FINAL REVIEW OF ENTIRE COURSE ON FINANCIAL MANAGEMENT:Financial Statements and Ratios