 |

Corporate
Finance FIN 622
VU
Lesson
20
CAPITAL
STRUCTURE AND FINANCIAL
LEVERAGE
In this hand
out we shall cover the
following topics:
When
to use WACC?
Pure
Play
Capital
Structure and Financial
Leverage
WHEN TO
USE WACC:
As we
have covered in our lecture
that using WACC as discount
rate for discounting the cash
flow of
intended project,
is only feasible if the proposed
project fall within the firms existing
activities circle. For
example
if a Oil manufacturing concern plans to
establish another production facility
then the existing
WACC
of the firm can be used as discount
rate. However, if the same
firm is thinking to set up a
new
spinning
unit, then using existing
WACC would be fatal and
inappropriate.
WACC
of a company reflects the level of risk
and WACC is only appropriate discount
rate if the intended
investment is
replica of company's existing activities having
same level of risk.
Using
WACC as discount rate when the
intended project has
different risk level as of company then
it will
lead
to incorrect rejections and/or incorrect
acceptance.
For
example, a company having two
strategic units and one unit
having lower risk than the other,
using
WACC
to allocate resource will
end up putting lower funds to
high risk and larger funds to
low risk
division.
The
other side of this issue
emerges from the situation when a
firm is having more than one
line of
business.
For example a firm has
two divisions: one of these
has relatively low risk and the
other has high
risk.
In this
case, the firm's overall
WACC would be the sum of two
different costs of capital,
which is one for
each
business division. If two of
these are contenders for the
resources, the riskier division would
tend to
have
greater returns so it would be having the
major chunk. The other one
might have huge profit
potential
ends
up with insufficient resources
allocated.
Pure
Play
Using
WACC blindly can lead to
severe problems for a firm.
Because we cannot observe the returns
of
these
investment, there generally is no direct
way of coming up with the
beta. The approach must be
to find
a
project or another firm in the industry in
which our proposed project
falls. We can use the beta
of that
firm
along with the D/E ration prevalent in
that industry.
Once
we have the beta and D/E of the
firm or industry that resembles to
our project we can estimate
the
exact
beta and D/E of proposed project.
For example, if the industry (in
which our intended project
will
fall)
has a beta of 1.7 and D/E
ratio of 40:60, and we
intend to finance the new project
through equity only,
we can
calculate the exact beta of intended
project which, in turn will be
used to calculate the new
project
WACC
or discount rate to evaluate the project
cash flow. This process
may involve un-gearing and
re-
gearing.
Gbeta
x (E / E + D(1-t))
Formula
to un-gear equity Beta
=
Gbeta
= Geared beta (1.7 in our
example)
E
=
Weight of equity in capital
structure
D
=
Weight of debt in capital
structure
T
=
Tax rate
In this
example we need to un-gear the
beta. Why? Note that the
beta of the industry in which the
proposed
project
falls has D/E ratio of 40:60
but the new project shall be
all equity financed. We un-gear the
beta
that
means the financial risk element needs to
be removed from the geared beta of
1.7.
If we
plug in values in the above equation we
get the value of un-geared
beta of 1.3296, which is
also
WACC
as there is no debt. This should be used
as discount rate to evaluate future
cash flow of proposed
project.
66
Corporate
Finance FIN 622
VU
Pure
play refers to what has been
described above. We need to
gauge the systematic risk of the new
project
in
order to calculate the beta
and WACC to be used for
discounting cash flow.
Capital
Structure & Financial
Leverage:
FOR
the most part, a firm may
choose any capital
structure. Capital structure refers to
the combination of
financing
through equity and loans or debt. If
management might decided to
issue new shares and
pay off
bond
debt in order to reduce the
debt-equity ratio. Activities
like this are known as
capital restructuring.
This
is in fact a change of investment source
leaving the firm's assets
unchanged.
In the
last 4/5 lectures we
discussed the concept of WACC. It is simply the
firm's overall cost of
capital and
comprised
of weighted average of the costs of
various components of firm's
capital structure. Now
the
question
arises that what happens to
cost of capital when we change the
relative weights of debt or
equity?
The
value of firm is maximized
when WACC is at its lowest
level. As you know that WACC
is the discount
rate
appropriate to evaluate the cash flow,
the lower the discount rate the higher the
present value of cash
flow.
In other words, present
value and discount rate move in opposite
direction, lower WACC will
ensure
maximizing the
cash flow of the
firm.
Thus,
a firm must choose the
capital structure so that the
WACC is minimized. A capital structure
that
minimizes
the WACC would be better than the
other one which with higher
WACC.
Financial
Leverage
The
amount of debt in capital structure of a
firm is known as financial leverage. In
other words, how a
firm
utilizes
the amount of debt. The more debt in
capital structure, there is
greater financial leverage.
Financial
leverage magnifies the payoffs to
shareholders. It means that it
increases the profit and
loss with
more
percentage than a percentage
change in sales. It may be
possible that financial
leverage does not
affect
the
cost of capital. It is true then
firm capital structure
becomes irrelevant.
For
example, a firm is all
equity financed. Total
assets are Rs. 6.0
million which are finance by
200,000
shares
of Rs. 20 each. It is assumed
that EBIT (Earning before
Interest & Tax) is Rs. 800,000 in
first year
and
Rs. 1.20 million in second
year. In this case, EPS
(Earning per share) will be
Rs. 2.67 & Rs.4 per
share
respectively
in first and second year.
The ROE (Return on Equity) is
13.33% and 20% respectively
for year
1 &
2.
Now
consider that the firm
decides to employ debt in it capital
structure. The asset side
will remain
constant
at Rs. 6.0 million. In the
proposed restructuring the D/E ratio of 1 is applied.
It means that Rs. 3
million
will be invested from equity
and Rs. 3 million of debt is
employed. Interest rate is
assumed at 10%.
Assuming
the same level of EBIT in both
years, the EPS is now Rs.
3.33 and Rs.6 and
ROE has jumped to
16.67%
and 30% in first and second
year respectively.
This
magic is played by the financial
leverage. It has increased
both EPS AND ROE after debt
was mixed
up in the
capital structure.
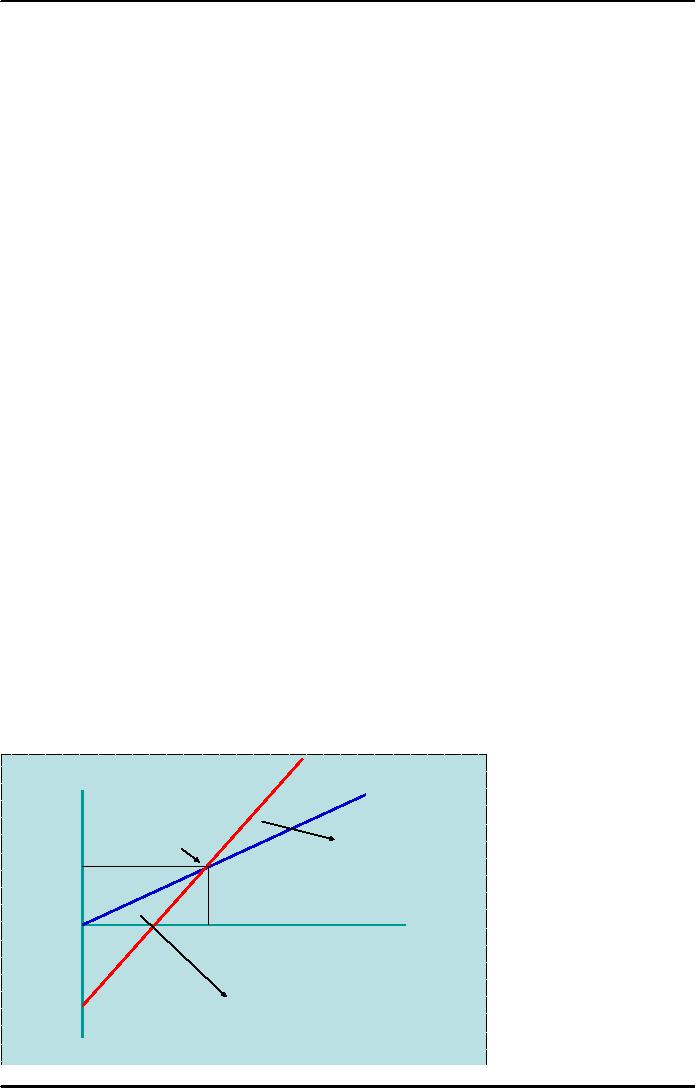
Y
DEBT
EPS
NO
DEBT
BE
+ FIN
LEVERAGE
2
X
300000
600,000
EBIT
-2
-IVE FIN
LEVERAGE
67

Corporate
Finance FIN 622
VU
Financial
leverage can also increase
the losses as well. Looking at the graph
above, if the EBIT is
not
enough
then it magnifies the losses. At
EBIT of Rs. 600,000 the EPS
is Rs. 2/-. If the EBIT is
less than
point
BE it represents the negative impact of
debt. If the EBIT is falling right to the
BE point it increase
the
return, the positive financial
leverage.
68
Table of Contents:
- INTRODUCTION TO SUBJECT
- COMPARISON OF FINANCIAL STATEMENTS
- TIME VALUE OF MONEY
- Discounted Cash Flow, Effective Annual Interest Bond Valuation - introduction
- Features of Bond, Coupon Interest, Face value, Coupon rate, Duration or maturity date
- TERM STRUCTURE OF INTEREST RATES
- COMMON STOCK VALUATION
- Capital Budgeting Definition and Process
- METHODS OF PROJECT EVALUATIONS, Net present value, Weighted Average Cost of Capital
- METHODS OF PROJECT EVALUATIONS 2
- METHODS OF PROJECT EVALUATIONS 3
- ADVANCE EVALUATION METHODS: Sensitivity analysis, Profitability analysis, Break even accounting, Break even - economic
- Economic Break Even, Operating Leverage, Capital Rationing, Hard & Soft Rationing, Single & Multi Period Rationing
- Single period, Multi-period capital rationing, Linear programming
- Risk and Uncertainty, Measuring risk, Variability of returnHistorical Return, Variance of return, Standard Deviation
- Portfolio and Diversification, Portfolio and Variance, RiskSystematic & Unsystematic, Beta Measure of systematic risk, Aggressive & defensive stocks
- Security Market Line, Capital Asset Pricing Model CAPM Calculating Over, Under valued stocks
- Cost of Capital & Capital Structure, Components of Capital, Cost of Equity, Estimating g or growth rate, Dividend growth model, Cost of Debt, Bonds, Cost of Preferred Stocks
- Venture Capital, Cost of Debt & Bond, Weighted average cost of debt, Tax and cost of debt, Cost of Loans & Leases, Overall cost of capital WACC, WACC & Capital Budgeting
- When to use WACC, Pure Play, Capital Structure and Financial Leverage
- Home made leverage, Modigliani & Miller Model, How WACC remains constant, Business & Financial Risk, M & M model with taxes
- Problems associated with high gearing, Bankruptcy costs, Optimal capital structure, Dividend policy
- Dividend and value of firm, Dividend relevance, Residual dividend policy, Financial planning process and control
- Budgeting process, Purpose, functions of budgets, Cash budgetsPreparation & interpretation
- Cash flow statement Direct method Indirect method, Working capital management, Cash and operating cycle
- Working capital management, Risk, Profitability and Liquidity - Working capital policies, Conservative, Aggressive, Moderate
- Classification of working capital, Current Assets Financing Hedging approach, Short term Vs long term financing
- Overtrading Indications & remedies, Cash management, Motives for Cash holding, Cash flow problems and remedies, Investing surplus cash
- Miller-Orr Model of cash management, Inventory management, Inventory costs, Economic order quantity, Reorder level, Discounts and EOQ
- Inventory cost Stock out cost, Economic Order Point, Just in time (JIT), Debtors Management, Credit Control Policy
- Cash discounts, Cost of discount, Shortening average collection period, Credit instrument, Analyzing credit policy, Revenue effect, Cost effect, Cost of debt o Probability of default
- Effects of discountsNot effecting volume, Extension of credit, Factoring, Management of creditors, Mergers & Acquisitions
- Synergies, Types of mergers, Why mergers fail, Merger process, Acquisition consideration
- Acquisition Consideration, Valuation of shares
- Assets Based Share Valuations, Hybrid Valuation methods, Procedure for public, private takeover
- Corporate Restructuring, Divestment, Purpose of divestment, Buyouts, Types of buyouts, Financial distress
- Sources of financial distress, Effects of financial distress, Reorganization
- Currency Risks, Transaction exposure, Translation exposure, Economic exposure
- Future payment situation hedging, Currency futures features, CF future payment in FCY
- CFfuture receipt in FCY, Forward contract vs. currency futures, Interest rate risk, Hedging against interest rate, Forward rate agreements, Decision rule
- Interest rate future, Prices in futures, Hedgingshort term interest rate (STIR), ScenarioBorrowing in ST and risk of rising interest, Scenariodeposit and risk of lowering interest rates on deposits, Options and Swaps, Features of opti
- FOREIGN EXCHANGE MARKETS OPTIONS
- Calculating financial benefitInterest rate Option, Interest rate caps and floor, Swaps, Interest rate swaps, Currency swaps
- Exchange rate determination, Purchasing power parity theory, PPP model, International fisher effect, Exchange rate system, Fixed, Floating
- FOREIGN INVESTMENT: Motives, International operations, Export, Branch, Subsidiary, Joint venture, Licensing agreements, Political risk