 |
Waiting Lines:Queuing Analysis, System Characteristics, Priority Model |
| << PROJECT MANAGEMENT:Computing Algorithm, Project Crashing, Risk Management |
Production
and Operations Management
MGT613
VU
Lesson
45
Waiting
Lines
Learning
Objectives
After
completing the lecture, we should be
able to explain the formation of
waiting lines in
unloaded
systems,
identify the goal of queuing (
waiting line) analysis, list the
measures of system performance
that
are used in queuing analysis. We
should be able to understand the
importance of simulation and at
the
same time we should look
beyond the Production Operations
Management class as
business
graduate
professionals adding value to the
society.
Visit
to a Cricket Stadium
1.
Waiting in lines does not
add enjoyment
2.
Waiting in lines does not
generate revenue
3.
Waiting
Lines
4.
Waiting lines are non-value
added occurrences
5.
Are formed at airports,
cricket stadiums, post
offices.
6.
Formed due to non scheduled random
arrivals
7.
Often regarded as poor service
quality
Waiting
Line Examples
1.
Orders
waiting to be filled
2.
Trucks
waiting to be loaded or
unloaded
3.
Job
waiting to be processed
4.
Equipment
waiting to be loaded
5.
Machines
waiting to be repaired.
Service
Station as a Waiting Line
Example
Service
station is usually designed to provide
service on average service time. At macro
level system is
unloaded
at micro level the system is
overloaded a Paradox
Customers
arrive at random rate
Service
requirements vary only oil
change or even tuning or maintenance
activity in order to change
oil
Waiting
Lines
Queuing
theory: Mathematical approach to the analysis of
waiting lines.
1.
Goal of queuing analysis is to minimize
the sum of two costs
Customer waiting costs
and
Service
capacity costs.
2.
Waiting lines are non-value
added occurrences
Implications
of Waiting Lines
1.
Cost to provide waiting
space
2.
Loss of business
a.
Customers leaving
b.
Customers refusing to
wait
3.
Loss of goodwill
4.
Reduction in customer
satisfaction
5.
Congestion may disrupt other
business operations
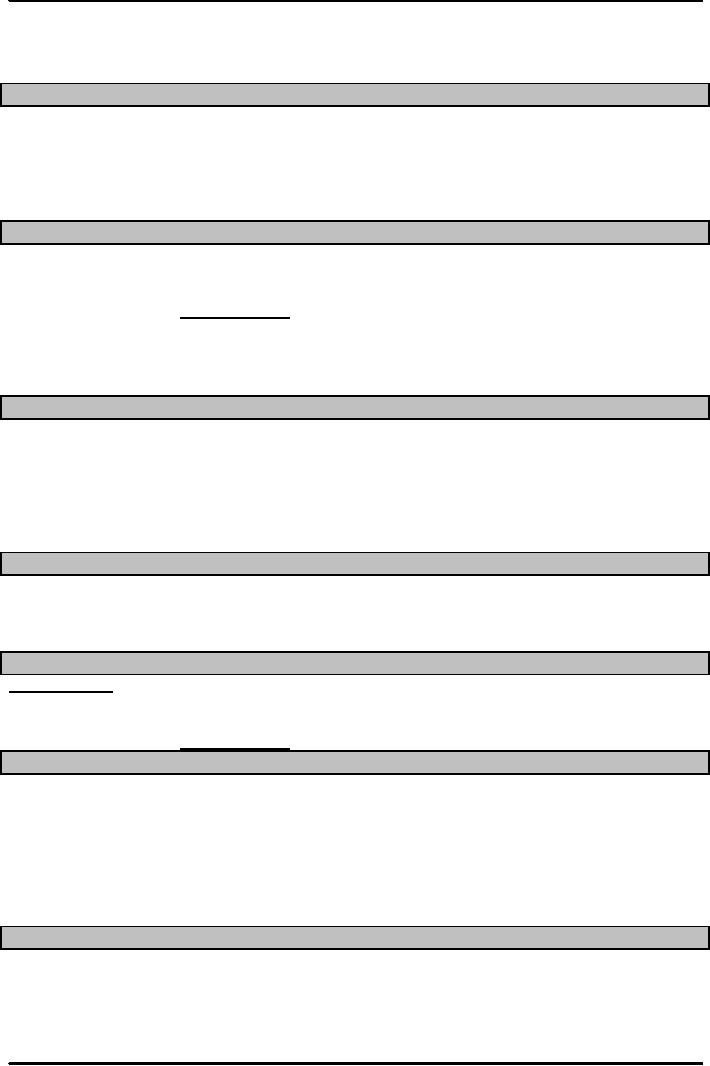
Queuing
Analysis
Organizations
carry out queuing analysis to
ensure that they are
able to balance the service levels
with
costs
which the organization can
incur. The ultimate goal of
queuing analysis is to minimize the sum
of
213
Production
and Operations Management
MGT613
VU
two
costs that is the service capacity
cost ( represented on x axis) and
customer waiting
Capacity
Total
Customer
=
+
waiting
cost
cost
cost
Cost
Total
cost
Cost
of
Service
Capacity
Cost
of
Customers
Waiting
Service
capacity
Optimum
costs.
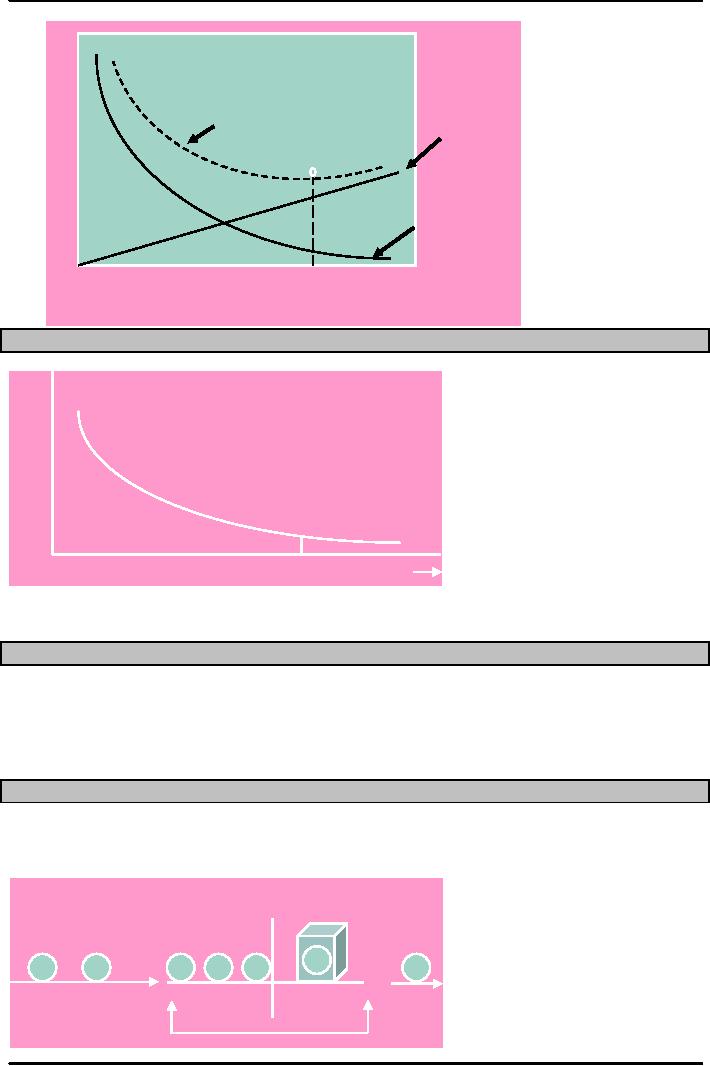
Negative
Exponential Distribution: Another
example of Common Queuing
System
F(t)
Pt≥T)=.RN
(
0
T
t
Queue
discipline is considered to be a primary
requirement in service systems. However
hospital
emergency
rooms, rush orders in a
factory and main frame computer
processing of jobs do not
follow
Queue
Discipline.
System
Characteristics
1.
Population Source
a.
Infinite source: customer
arrivals are unrestricted
b.
Finite source: number of potential
customers is limited
2.
Number of observers (channels)
3.
Arrival and service patterns
4.
Queue discipline (order of
service)
Elements
of Queuing System
Population
Source, Arrivals, Waiting
Lines, Processing Order, Service,
System and Exit are
the
common
identifiable elements of a Queuing
System.
Processing
Order
Waiting
Arrivals
Service
Exit
Line
System
214
Production
and Operations Management
MGT613
VU
Queuing
Systems
The
System characteristics
are
1.
Population Source
2.
Number of Servers( Channels)
3.
Arrival and Service
Patterns
4.
Queue Discipline
Multiple
Channels
Multiple
Phases
Channel:
A
server in a service system
Poisson
Distribution
Poisson
distribution is a
discrete probability distribution
and expresses the probability of a number
of
events
occurring in a fixed period of
time if these events occur
with a known average rate, and
are
independent
of the time since the last
event.
0.25
0.2
0.15
0.1
0.05
0
0
1
2
3
4
5
6
7
8
9
10
11
12
Waiting
Line Models
As
a student of Operations Management we can
identify the following types of Waiting
Line Models in
our
day to day routine
activities.
1.
Patient
:Customers enter the waiting
line and remain until
served
2.
Reneging:
Waiting customers grow
impatient and leave the
line
3.
Jockeying:
Customers may switch to another
line
4.
Balking:
Upon arriving, decide the line is
too long and decide not to
enter the line
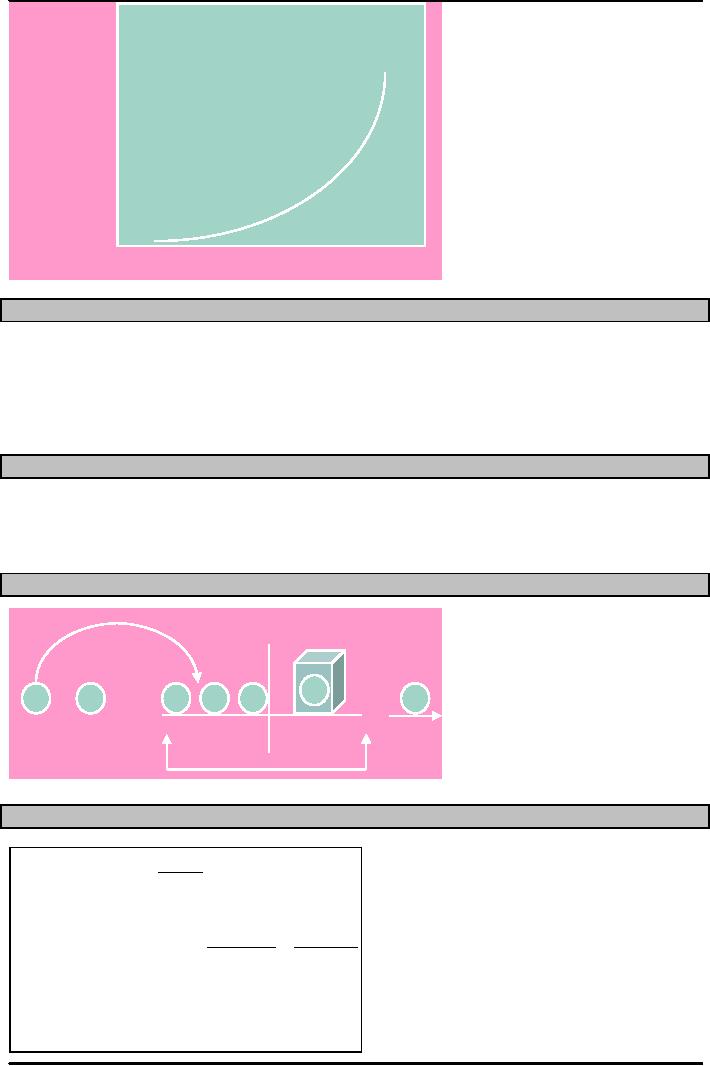
Waiting
Time vs. Utilization
The
figure represents an increase in
system utilization at the expense of
increase in both length of
the
waiting
line and average waiting
time. These values increase as the
utilization approaches 100
percent.
The
implication is that under
normal circumstances, 100 percent
utilization is not a realization
goal.
215
Production
and Operations Management
MGT613
VU
Average
number
on
time waiting
in
line
0
100
System
Waiting
Time vs. Utilization
System
Performance
1.
Average number of customers
waiting
2.
Average time customers
wait
3.
System utilization
4.
Implied cost
5.
Probability that an arrival
will have to wait
Example
Service Station
Queuing
Models: Infinite-Source
1.
Single channel, exponential service
time
2.
Single channel, constant service
time
3.
Multiple channel, exponential service
time
4.
Multiple priority service, exponential
service time
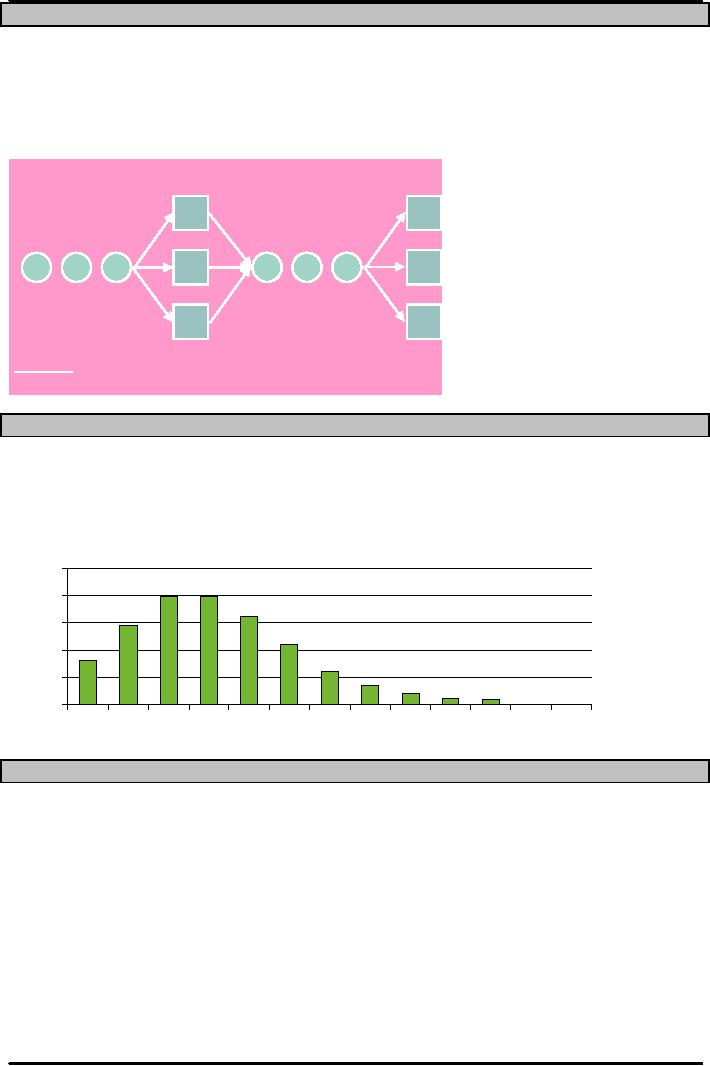
Priority
Model
Processing
order
1
3
2
1
1
Waiting
Arrival
Exit
Service
line
Arrivals
are assigned
System
a
priority as they
arrive
Finite-Source
Formulas
T
Service
Factor X =
T
+U
Average
Number Waiting L =
N
(1
-
F
)
L(T +
U
)
T
(1
-
F
)
AverageWaiting
TimeW =
=
N
-L
XF
Average
Number Running J =
NF
(1
-
X
)
Average
Number being Served H =
FNX
Number
in Population N =
J
+
L
+
H
216
Production
and Operations Management
MGT613
VU
Finite-Source
Queuing
Not
waiting or
Being
Waiting
being
served
served
J
L
H
U
W
T
Where
we use the
formula
Other
Approaches Non Mathematical
Approaches
1.
Reduce
perceived waiting
time
J
+H
F=
2.
Magazines
in waiting rooms
J
+L+H
3.
Radio/television
4.
In-flight
movies
5.
Filling
out forms
6.
Derive
benefits from waiting
7.
Place
impulse items near checkout
8.
Advertise
other goods/services
Simulation
Simulation:
a descriptive technique that
enables a decision maker to evaluate the
behavior of a model
under
various conditions.
1.
Simulation models complex
situations
2.
Models are simple to use and
understand
3.
Models can play "what if"
experiments
4.
Extensive software packages
available
Simulation
Process
1.
Identify the problem
2.
Develop the simulation
model
3.
Test the model
4.
Develop the experiments
5.
Run the simulation and evaluate
results
6.
Repeat 4 and 5 until results
are satisfactory
Monte
Carlo Simulation
Monte
Carlo method: Probabilistic
simulation technique used
when a process has a random
component
1.
Identify a probability
distribution
2.
Setup intervals of random numbers to
match probability
distribution
3.
Obtain the random numbers
4.
Interpret the results
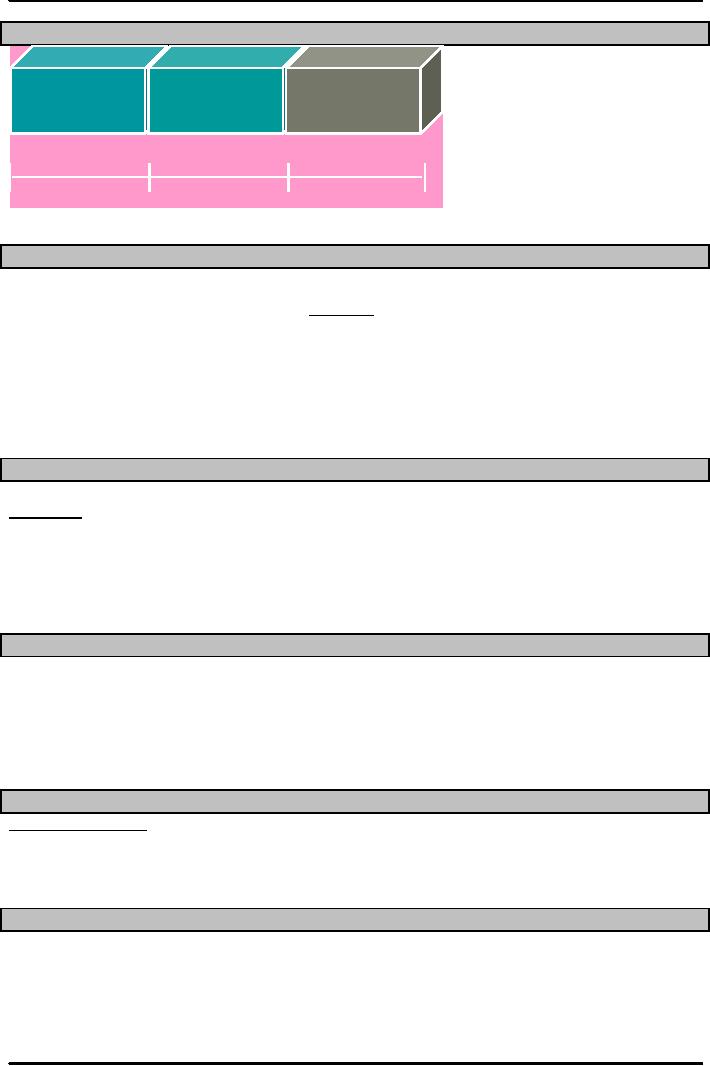
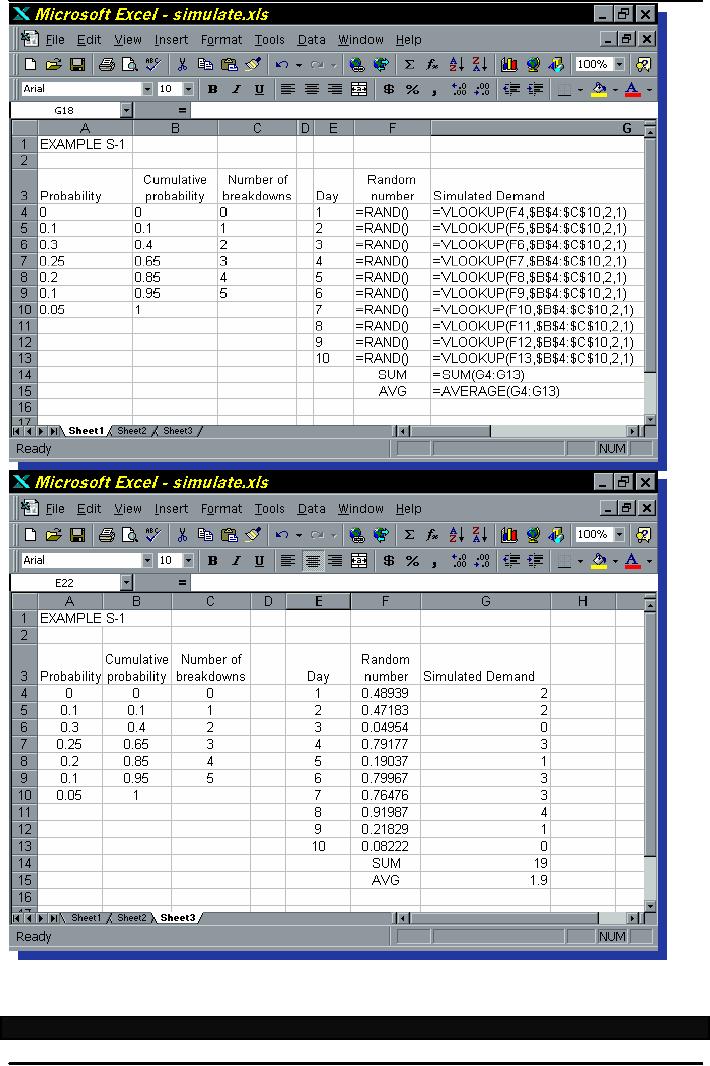
Example
Showing the use of Microsoft
Excel
An
Operations Manager makes best
use of the power of Microsoft
Excel by carrying out
simulation.
The
first picture below shows a
snapshot which carries the
formulae and the second
picture represents
the
actual values.
217
Production
and Operations Management
MGT613
VU
Simulating
Distributions commonly used
are the Poisson and Normal
Distributions.
Poisson
Distribution: Mean of distribution is
required
Normal
Distribution: Need to know the
mean and standard
deviation
Stimulated
Value= Mean + Random Number
X Standard Deviation
218

Production
and Operations Management
MGT613
VU
Uniform
Distribution
F(x)
0
a
b
x
Stimulated
Value= a+ (b-a)(Random number as a
percentage)
Computer
Simulation
Simulation
languages
1.
SIMSCRIPT II.5
2.
GPSS/H
3.
GPSS/PC
4.
RESQ
Advantages
of Simulation
1.
Solves problems that are difficult or
impossible to solve
mathematically
2.
Allows experimentation without
risk to actual system
3.
Compresses time to show long-term
effects
4.
Serves as training tool for
decision makers
Limitations
of Simulation
1.
Does not produce optimum
solution
2.
Model development may be
difficult
3.
Computer run time may be
substantial
4.
Monte Carlo simulation only
applicable to random systems
Why
Simulation is necessary
1.
Mathematics involved is too
complicated
2.
Easier to manipulate than
reality
3.
Software and hardware permit
modeling
Simulation
Steps
1.
Problem formulation
2.
Model building
3.
Data acquisition
4.
Model translation
5.
Verification & validation
6.
Experiment planning &
execution
7.
Analysis
8.
Implementation & documentation
Operations
Strategy
1.
The central idea for
formulating an Operations Strategy for
Waiting Line concept is
designing a
service
system to achieve a balance between service
capacity and customer
waiting time.
219

Production
and Operations Management
MGT613
VU
2.
The operations strategy should be able to
identify an appropriate and
acceptable level of service
capacity
as well as quality so waiting
lines are not formed or
formed which are manageable
and
acceptable
to the customers.
3.
Often Organizations when
challenged by lack of practical
solutions or space constraints opt
for
a
more tangible quality based
solutions by engaging the waiting
customers in activities
which
give
the customers not only an
opportunity to make use of the
time but also to make the
waiting
time
less painful and more
pleasant.
Summary
Analysis
of waiting lines can be an
important milestone in the design of
improved service systems.
Waiting
lines have a tendency to form in even
those systems which in a
macro sense are under
loaded or
unloaded.
The
arrival of customers at random times and
variability of service times combine to
create temporary
overloads.
When this happens, waiting
lines appear.
A
major consideration in the analysis of the
queuing systems is whether the number of
potential
customers
is limited (finite source) or
whether entry to the system is
unrestricted (infinite source).Of the
5
models we studied, 4 dealt with
infinite source and 1 with
finite source
population.
As
a rule, the models assume that
customer arrival rates are
described by Poisson distribution
and
service
time can be described by a
negative exponential
distribution.
220

Production
and Operations Management
MGT613
VU
POMA
Strategies beyond the final
exam
1.
In the long run (when factors of
production change, any or
combination of the factors of
labor,
land,
technology), productivity growth is
almost everything if not
everything.
2.
Do not create artificial non
operational management strategies
means to balance capacity
to
demand
(It can cause competitive
advantage to shift towards your
competitor and your
organization
losing the competition.
3.
How much does it really
cost to manufacture a product or develop
a service ( refer to the
concept
of total costs, which we
learnt in our discussions on
inventory management,
alternative
capacity,
quality, maintenance and waiting
lines)
4.
Competitive advantage in operational and
organization strategy creates a win
win situation for
the
organization.
5.
Operations Manager should learn to
think at the margin (an addition in
cost by 1 Rupee(unit
cost)
would increase or decrease the revenue by
1 Rupee(unit revenue/benefit)).
6.
How we as Operations Manager can
play a part in minimization of
costs of most important
of
services
in Pakistan i.e. education and medical.
Trade off between Effectiveness and
quality.
7.
How and why Project
Management concepts are
equally important to Production
Operations
Management
and vice versa.
8.
The importance of coordinating,
planning, controlling, budgeting
operations and project
activities
in achieving our firms short and
long term objectives.
9.
The concepts of strategy, competitiveness
and productivity, design of product and
services,
design
of work systems and facilities,
concept of quality and system
improvement as applicable
in
organizations be applied to
Pakistan.
10.
How as Operations Manager we can
communicate to masses the importance of
Pakistani
domestic
markets and how they help in
capital formation. If we say no to
foreign goods
consumption,
foreign good would not
come to our place and we can
generate a well
deserved
saving.
That saving can be channelized to
provide clean and drinkable
water, better health
care,
education
or even used for infrastructural
issues. e.g. if 1 % of Pakistani
population saves Rs.
10
per
week for 1 year alone we
would have almost 780 million
rupees or 12 to 13 Million US
dollars
by which we can set biogas plants or
waste incinerator boiler
based power generation
or
clean
drinking waters or even institutions of
higher learning.
221
Table of Contents:
- INTRODUCTION TO PRODUCTION AND OPERATIONS MANAGEMENT
- INTRODUCTION TO PRODUCTION AND OPERATIONS MANAGEMENT:Decision Making
- INTRODUCTION TO PRODUCTION AND OPERATIONS MANAGEMENT:Strategy
- INTRODUCTION TO PRODUCTION AND OPERATIONS MANAGEMENT:Service Delivery System
- INTRODUCTION TO PRODUCTION AND OPERATIONS MANAGEMENT:Productivity
- INTRODUCTION TO PRODUCTION AND OPERATIONS MANAGEMENT:The Decision Process
- INTRODUCTION TO PRODUCTION AND OPERATIONS MANAGEMENT:Demand Management
- Roadmap to the Lecture:Fundamental Types of Forecasts, Finer Classification of Forecasts
- Time Series Forecasts:Techniques for Averaging, Simple Moving Average Solution
- The formula for the moving average is:Exponential Smoothing Model, Common Nonlinear Trends
- The formula for the moving average is:Major factors in design strategy
- The formula for the moving average is:Standardization, Mass Customization
- The formula for the moving average is:DESIGN STRATEGIES
- The formula for the moving average is:Measuring Reliability, AVAILABILITY
- The formula for the moving average is:Learning Objectives, Capacity Planning
- The formula for the moving average is:Efficiency and Utilization, Evaluating Alternatives
- The formula for the moving average is:Evaluating Alternatives, Financial Analysis
- PROCESS SELECTION:Types of Operation, Intermittent Processing
- PROCESS SELECTION:Basic Layout Types, Advantages of Product Layout
- PROCESS SELECTION:Cellular Layouts, Facilities Layouts, Importance of Layout Decisions
- DESIGN OF WORK SYSTEMS:Job Design, Specialization, Methods Analysis
- LOCATION PLANNING AND ANALYSIS:MANAGING GLOBAL OPERATIONS, Regional Factors
- MANAGEMENT OF QUALITY:Dimensions of Quality, Examples of Service Quality
- SERVICE QUALITY:Moments of Truth, Perceived Service Quality, Service Gap Analysis
- TOTAL QUALITY MANAGEMENT:Determinants of Quality, Responsibility for Quality
- TQM QUALITY:Six Sigma Team, PROCESS IMPROVEMENT
- QUALITY CONTROL & QUALITY ASSURANCE:INSPECTION, Control Chart
- ACCEPTANCE SAMPLING:CHOOSING A PLAN, CONSUMERS AND PRODUCERS RISK
- AGGREGATE PLANNING:Demand and Capacity Options
- AGGREGATE PLANNING:Aggregate Planning Relationships, Master Scheduling
- INVENTORY MANAGEMENT:Objective of Inventory Control, Inventory Counting Systems
- INVENTORY MANAGEMENT:ABC Classification System, Cycle Counting
- INVENTORY MANAGEMENT:Economic Production Quantity Assumptions
- INVENTORY MANAGEMENT:Independent and Dependent Demand
- INVENTORY MANAGEMENT:Capacity Planning, Manufacturing Resource Planning
- JUST IN TIME PRODUCTION SYSTEMS:Organizational and Operational Strategies
- JUST IN TIME PRODUCTION SYSTEMS:Operational Benefits, Kanban Formula
- JUST IN TIME PRODUCTION SYSTEMS:Secondary Goals, Tiered Supplier Network
- SUPPLY CHAIN MANAGEMENT:Logistics, Distribution Requirements Planning
- SUPPLY CHAIN MANAGEMENT:Supply Chain Benefits and Drawbacks
- SCHEDULING:High-Volume Systems, Load Chart, Hungarian Method
- SEQUENCING:Assumptions to Priority Rules, Scheduling Service Operations
- PROJECT MANAGEMENT:Project Life Cycle, Work Breakdown Structure
- PROJECT MANAGEMENT:Computing Algorithm, Project Crashing, Risk Management
- Waiting Lines:Queuing Analysis, System Characteristics, Priority Model