 |
Lecture-23
Total
DQM
TDQM in a
DWH
Many DW
projects do not deliver to full potential
because they treat data
quality as a one
-time
undertaking as
part of user acceptance
testing (UAT) and then
forgetting a out it. It is
very
b
important that
data quality management is
undertaken as a continuous improvement
process...not
a one-shot
deal!
Use an
iterative approach to achieve
data quality. Start by defining
the quality measurements,
and
then
take the measurements. Go
through the cycle as shown in
Figure 23.1, this will
drive you to
the
stable stage i.e. CMM -5,
where you have a small amount of
acceptable data quality
defects.
Here acceptable
is based on cost vs. the
value.
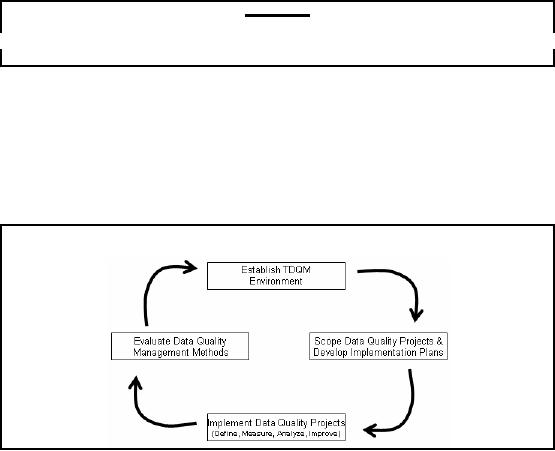
Data
Quality Management Process
Figure-23.1:
Data Quality Management
Process
1.
Establish Data Quality
Management Environment
Securing a
commitment to the Data Quality
Management process is accomplished by
establishing
the
data quality management
environment between information system
project managers and
establishing
conditions to encourage team
work between functional and
information system
development
professionals. Functional users of legacy
information systems know
data quality
problems of
the current systems but do not know
how to systematically improve existing
data.
Information
system developers know how to
identify data quality
problems but do not know
how
to change
the functional requirements
that drive the systemic
improvement of data. Given
the
existing barriers to
communication, establishing the
data quality environment
involves
participation of both
functional users and
information system
administrators.
2. Scope
Data Quality Projects & Develop
Implementation Plan
For
each data quality analysis
project selected, the data
quality project manager defines
the scope
of the project
and defines the level of
analysis that will be the
most beneficial for the
project
under question.
Draft an initial plan that
addresses the following
elements.
180
�
Task
Summary: Project
goals, scope, and potential
benefits
�
Task
Description: Describe
data quality analysis
tasks
�
Project
Approach: Summarize
tasks and tools used to
provide a baseline of existing
data
quality
�
Schedule:
Identify
task start, completion dates,
and project milestones
�
Resources:
Identify
resources required to complete the
data quality assessment. Include
costs
connected with tools acquisition,
labor hours (by labor
category), training,
travel,
and
other direct and indirect
costs
3.
Implement Data Quality Projects
(Define, Measure, Analyze,
Improve)
A data
quality analysis project consists of
four activities. The data
quality project manager
performs these
activities with input from
the functional users of the
data, system developers,
and
database
administrators of the legac y
and target database
systems.
� Define:
Identify
functional user data quality
requirements and establish
data quality
metrics.
� Measure:
Measure
conformance to current business
rules and develop exception
reports.
� Analyze:
Verify,
validate, and assess poor d
ta quality causes. Define
improvement
a
opportunities.
� Improve:
Select/prioritize
data quality improvement
opportunities.
Improving
data quality may lead to
changing data entry procedures, updating
data validation
rules, and/or
use of company data
standards to prescribe a uniform
representation of data
used
throughout the
company.
4. Evaluate
Data Quality Management
Methods
The
last step in the Data
Quality Management process is to evaluate
and assess progress made
in
implementing
data quality initiatives and/or
projects. All participants in
the Data Quality
Management
process (functional users, program
managers, developers, and
the Office of Data
Management)
should review progress with
respect to: (1) modifying or
rejuvenating existing
methods to
data qualit y management and/or
(2) determining whether data quality
projects have
helped to
achieve demonstrable goals and
benefits. Evaluating and
assessing data quality
work
reinforces the
idea that Data Quality
Management is not a program, but a new
way of doing
business.
The
House of Quality
In 1972
the Mitsubishi Shipyards in Kobe developed a
technique in which customer
wants were
linked to
product specifications via a matrix
format as shown in Figure
23.2. This technique
is
known
today as The House of
Quality and is one of many
techniques of Quality Function
Deployment,
which can briefly be defined
as "a system for translating
customer requirements
into
appropriate
company requirements".
The
purpose of the technique is to
reduce two types of risk.
First, the risk that the
product
specification
does not comply with the
wants of the predetermined
target group of
customers.
Secondly,
the risk that the final
product does not comply with the product
specification.
181
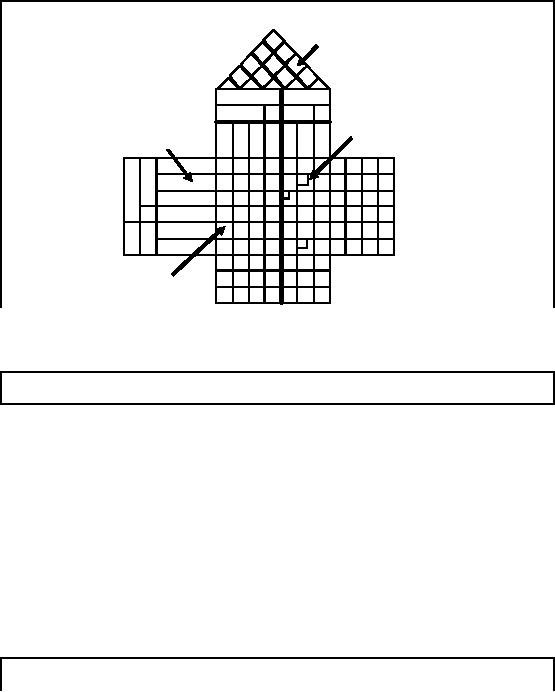
The
House of Quality Matrix
Technical
Correlation
Matrix
Customer
Technical
Design
Requirements
Requirements
Interrelationship
Matrix
Figure-23.2:
The House of Quality
Matrix
The
House of Quality Data
Model
The
House of Quality concept was
used and introduced with
reference to data quality in
1988.
The
idea is that the end
user applications and the
data characteristics for
those applications
such
as date of
birth etc are tied together,
such that for each
application tolerances on data quality
are
placed,
including no needs. If the
tolerances are not within
(say) x%, then the
corresponding data
can not be
used. So we are looking
at:
�
Establishing
specifications for data in
the data warehouse.
�
Establishing
applications for data in the
data warehouse.
�
Establishing
tolerances for conformity to
specifications for each combination
of
applications
and data
specifications.
If it costs more
to deliver th e tolerance than
the value of the application
then the company is
not
ready to do
the application yet. It means
the company has to make a
business decision not to do
the application
with dirty data, or to do
the application and pretend
that the data is of high
quality.
The
House of Data Quality: Next
Step
Getting more
sophisticated, we can say
that if you give me data
withx% data quality,
the value of
the application
will be y millions of
dollars. If you give me 2x% data quality,
then the value of
the
application is
3y
millions of
dollars. Why? Because now
the predictive model is more
accurate.
If you give me
date of birth 90% of the
time, then I can make you a
million dollars on better
customer
retention. But if you give me
date of birth 95% of the
time, then the accuracy
goes
182

much
higher, and how much is
that worth to you? The
question is. What is the
value of the
application,
relative to the specific
data quality specifications?
How to
improve Data
Quality?
The
four categories of Data Quality
Imp rovement
�
Process
�
System
�
Policy &
Procedure
�
Data
Design
Process
Improvement: Improve
the functional processes
used to create, manage,
access, and use
data. Functional
process changes may
encourage centralized data
entry, eliminate non -value
added
activities, and place data
quality responsibilities where data is
entered into the data
set
(e.g.,
certification of data)
System
Improvement: Software,
hardware, and telecommunication
changes can improve
data
quality. For
example, security software can
minimi ze damage done by malicious
updates to
databases by
unauthorized users. Hardware improvements
may make batch loads
faster and
thereby
make it unnecessary to turn
off edit and validation
constraints when loading data to a
database.
Telecommunications improv ements
(e.g. increasing bandwidth) may
provide easier
access to
data and improve both the
accuracy and timeliness of
data. Other system improvements
may include
updating end user, operation,
and maintenance manuals, and
providing additional
user
training.
Policy
and Procedure Improvement:
Resolve
conflicts in existing policies and
procedures and
institutionalize behaviors
that promote good data quality.
Develop Standard Operating
Procedures
for
the information system to
document the data quality
rule sets/filters used to
measure data
quality. Perform
periodic data quality checks
as part of the Standard Operating
Procedures to
increase
data quality.
Data
Design Improvement: Improve
the overall data design
and use data standards.
Adding
primary
key constraints, indexes, unique
key constraints, triggers, stored
functions and
procedures,
controlling administration of user privileges,
enforcing security features,
and
referential
integrity constraints can
improve database
design.
183
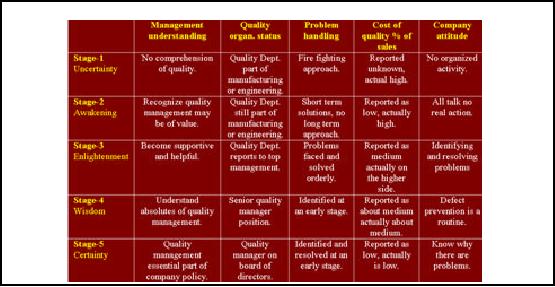
Quality
Management Maturity
Grid
Table-23.1:
Quality Management Maturity
Grid
Table
23.1 shows the quality
management maturity grid. Each of
the five stages will be
discussed
in
detail.
Stage 1:
Uncertainty
Stage-1 is
denial. People don't think
data quality is an issue. It is
the responsibility of the people
collecting the
data. It is their problem. There is no
data quality inspection; nobody actually
cares
about
the data quality in the
processes. The problems are
handled on a fire fighting
basis, you
discover problems
(or they pop up) and you
fix them using a band aid
approach and the
problems
are rarely
resolved. There are a large
number of companies in this
stage. Some may not even
have
a quality
department, or even when they have one,
not paying enough attention
and committin g
resources.
Stage 2:
Awakening
People
think that data quality
management does have a value. Management
talks about it, but
does nothing.
This is like all talk and no
action stage. People go around
giving presentations, but
really
there is no action, just
motivational stuff and not
doing any thing. If there is a
major
problem, the
approach is to put together an ad hoc
team, that team will
attack and resolve
the
problem. In the
end they say that
somebody messed up.
Stage 3:
Enlightenment
A light
goes on, may be there is a
problem. The quality department starts
reporting instead of
hiding
the problems in the closet.
You actually start to
measure data quality and
are reasonably
close. Actually
the management is now
committed, and have invested
resources.
Stage 4:
Wisdom
Value of quality is
seen as something that is needful
and meaningful. Data quality starts
coming
on the
performance evaluation of employees i.e. what
are they doing for
data quality. There is a
184

14 step program
for continuous improvement. They
actually start going through it,
and start
taking proactive
actions to prevent data quality
defects from happening. So
rather than fixing
problems
AFTER they have occurred, you
start taking steps BEFORE
the problems occur
i.e.
practicing
prevention. Quality comes
from prevention. And
prevention is a result of
training,
discipline,
example, leadership, and
more. So there is a fundamental shift.
Now you are looking
at
organizational
processes, and changing
them.
How do you
know an organization is in stage 4? They
should have looked at their
data quality
processes
and found out why data
quality problems are reoccurring
and fixed them. If they
are
still
discovering data quality problems, then
certainly they are not in stage
-4.
There
are actually a very small
number of organizations in stage-4. Usually
they have a DW in
place
and discovered how bad the
quality of their data is
before they start moving on
this maturity
grid.
Stage 5:
Certainty
The
approach is "I know about
the quality of my data" and/or "I am
measuring it for real".
Quality
improvement is NOT something
that is done on ad-hoc
basis, but is part of everything.
People
know why they are
doing it, and why they do
not have data quality problems.
Misconceptions
on Data Quality
1. You
Can Fix Data
2. Data Quality
is an IT Problem
1. You
Can Fix Data
Fixing implies
that there was something
wrong with the original
data, and you can fix it
once and
be done
with it. In reality, the
problem may have been not
with the data itself, but rather in
the
way it was
used. When you manage
data you manage data
quality. It's an ongoing process.
Data
cleansing is
not the answer to data
quality issues. Yes, data
cleansing does address
some
important data
quality problems has and
offers a solid business value
ROI, but it is only one
element of
the data quality puzzle. Too
often the business purchases
a data cleansing tool
and
thinks the
problem is solved. In other cases,
because the cost of data
cleansing tools is high, a
business
may decide that it is too
expensive for them to deal
with the problem.
2. Data
Quality is an IT Problem
Data quality is
a company
problem
that costs a business in
many ways. Although IT can
help
address
the problem of data quality, the
business has to own the
data and the business
processes
that
create or use it. The
business has to define the
metrics for data quality -
its completeness,
consistency,
relevancy and timeliness. The
business has to determine
the threshold between
data
quality
and ROI. IT can enable
the processes and manage
data thro ugh technology, but
the
business
has to define it. For an enterprise-wide
data quality effort to be initiated and
successful
on an ongoing
basis, it needs to be truly a
joint business and IT
effort.
Misconceptions
on Data Quality
3. All)
Problem is in the Data
Sources or Data Entry
4. The
Data Warehouse will provide
a single source of truth
5. Compare
with the master copy
will fix the problem
185
3. The
Problem is in the Data
Sources or Data
Entry
Data entry or operational
systems are often blamed for
data quality problems.
Although
incorrectly
entered or missing data is a problem, it
is far from the only
data quality problem. Also,
everyone blames
their data quality problems
on the systems that they
sourced the data
from.
Although
some of that may be true, a
large part of the data quality
issue is the
consistency,
relevancy and
timeliness of the data. If
two divisions are using
different customer identifiers
or
product numbers,
does it mean that one of
them has the wrong
numbers or is the problem on e
of
consistency
between the divisions? If the
problem is consistency, then it is an
enterprise
issue,
not a
divisional
issue.
The long-term solution may be for
all divisions to use the
same codes, but
that
has to be an enterprise
decision.
4. The Data
Warehouse will provide a
Single Version of the
Truth
In an ideal
world, every report or analysis
performed by the business exclusively
uses data
sourced
from the data warehouse -
data that has gone through
data cleansing and
quality
processes
and includes constant
interpretations such as profit or
sales calculations. If everyone
uses
the data warehouse's data
exclusively and it meets
your data quality metrics
then it is the
single
version of the truth.
However,
two significant conditions lessen
the likelihood that the
data warehouse solves
your
data
quality issues by itself. First,
people get data for
their reports and analysis
from a variety of
data
sources - data warehouse
(sometimes there are
multiple data warehouses in an
enterprise),
data
marts and cubes (that you
hope were sourced from the
data warehouse). They also
get data
from
systems such as ERP, CRM,
and budgeting and planning
systems that may be sourced
into
the
data warehouse themselves. In
these cases, ensuring data
quality in the data
warehouse alone
is not enough.
Multiple data silos mean
multiple versions of the truth and
multiple interpretations
of the
truth. Data quality has to be
addressed across these data
silos, not just in the
data
warehouse.
Second,
data quality involves the
source data and its
transformation into information. That
means
that even if
every report and analysis
gets data from the
same data warehouse, if the
business
transformations
and interpretations in these reports
are different then there
still are significant
data quality
issues. Data quality
processes need to involve
data creation; the staging
of data in
data
warehouses, data marts,
cubes and data shadow
systems; and information
consumption in the
form of
reports and business
analysis. Applying data
quality to the dat a itself
and not its usage as
information is
not sufficient.
Normally
source system reconciliation is used to
check if the ETL is working
properly. This
technique is
useful when you are doing test
and validation of the ETL,
but is not recommended
on
a long term
basis. This will only be
done when major changes
are made in the ETL.
Since the
process is
manual, it is human intensive, so it
will be very expensive and
inefficient.
All
the other four techniques
discussed in the previous
sections can be automat ed by
writing
scripts,
and running them every month
to collect statistics, generating
reports, and
identifying
problems
and subsequently noting the
progress of quality control. But
one has to be very clever
to
write
scripts for source system
reconciliation . It can turn out to be a nightmare.
The main
problems
are that you may have
garbage in the DWH, garbage
in the legacy system, and
that does
not really
tell you about the
data quality. Recall Orr's
Law #4 - "Data quality problems
increase
with
the age of t he system!"
186
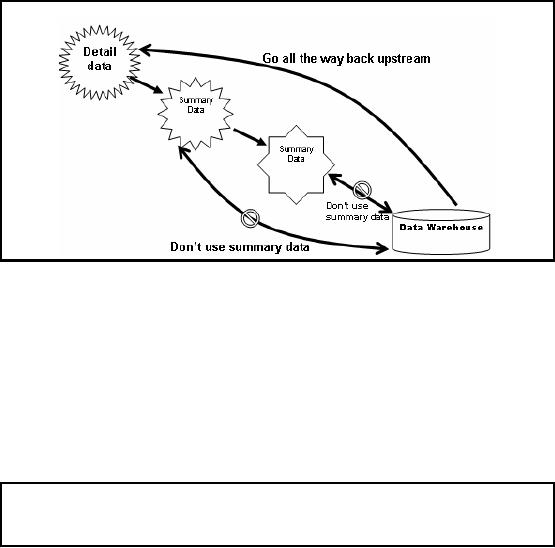
TDQM:
Successful Data
Sourcing
Figure-23.3:
TDQM: Successful Data
Sourcing
If you take
data from downstream data
sources it's likely that
not only you are going
to
accumulate
the data quality defects of
the upstream sources, but
also the compromises that
the
downstream
may have added, especially
the summarizations. Once you
summarize, you can not
trace
back to detailed data. Go as high
upstream for the gold
copy of the data as possible
as
shown in Figure
23.3.
You
also h ave to be aware of
the synchronization issues.
You take the transaction
data and the
accounts
data and there are
some transactions that don't
exist in the accounts yet,
so you have to
be careful of
the order in which you
take the data for
synchronization. Synchronization is
probably the
biggest reason we have referential
integrity problems in a DWH
i.e. lack of
synchronization
between different extracts of
the source system.
Misconceptions
on Data Quality
It came
from the legacy system so
must be correct.
Another
misconception is, "It came
from the production transaction
processing environment, so it
must be
correct." However the reality
is, the elements required
for decision support are
often
quite different
than those required for
transaction process ing. The objective of
OLTP systems is
to ensure
that all the sales
data is in, the numbers
sum up correctly, accounts are
balanced etc. If
the
gender data for some
(or even most) sales is not
present, it does not change
the sales dollars.
Why
bother? Why not enter
some junk data in the
gender field? This may be
fine from the
operational
point of view, but critical for
decision support, when you are
interested in determining
your
market segmentation.
Redefines and
other embedded logic in legacy
programs often puts data
quality delivered to
data
warehouse in
severe question. Y2K is a good
example.
187
Table of Contents:
- Need of Data Warehousing
- Why a DWH, Warehousing
- The Basic Concept of Data Warehousing
- Classical SDLC and DWH SDLC, CLDS, Online Transaction Processing
- Types of Data Warehouses: Financial, Telecommunication, Insurance, Human Resource
- Normalization: Anomalies, 1NF, 2NF, INSERT, UPDATE, DELETE
- De-Normalization: Balance between Normalization and De-Normalization
- DeNormalization Techniques: Splitting Tables, Horizontal splitting, Vertical Splitting, Pre-Joining Tables, Adding Redundant Columns, Derived Attributes
- Issues of De-Normalization: Storage, Performance, Maintenance, Ease-of-use
- Online Analytical Processing OLAP: DWH and OLAP, OLTP
- OLAP Implementations: MOLAP, ROLAP, HOLAP, DOLAP
- ROLAP: Relational Database, ROLAP cube, Issues
- Dimensional Modeling DM: ER modeling, The Paradox, ER vs. DM,
- Process of Dimensional Modeling: Four Step: Choose Business Process, Grain, Facts, Dimensions
- Issues of Dimensional Modeling: Additive vs Non-Additive facts, Classification of Aggregation Functions
- Extract Transform Load ETL: ETL Cycle, Processing, Data Extraction, Data Transformation
- Issues of ETL: Diversity in source systems and platforms
- Issues of ETL: legacy data, Web scrapping, data quality, ETL vs ELT
- ETL Detail: Data Cleansing: data scrubbing, Dirty Data, Lexical Errors, Irregularities, Integrity Constraint Violation, Duplication
- Data Duplication Elimination and BSN Method: Record linkage, Merge, purge, Entity reconciliation, List washing and data cleansing
- Introduction to Data Quality Management: Intrinsic, Realistic, Orr’s Laws of Data Quality, TQM
- DQM: Quantifying Data Quality: Free-of-error, Completeness, Consistency, Ratios
- Total DQM: TDQM in a DWH, Data Quality Management Process
- Need for Speed: Parallelism: Scalability, Terminology, Parallelization OLTP Vs DSS
- Need for Speed: Hardware Techniques: Data Parallelism Concept
- Conventional Indexing Techniques: Concept, Goals, Dense Index, Sparse Index
- Special Indexing Techniques: Inverted, Bit map, Cluster, Join indexes
- Join Techniques: Nested loop, Sort Merge, Hash based join
- Data mining (DM): Knowledge Discovery in Databases KDD
- Data Mining: CLASSIFICATION, ESTIMATION, PREDICTION, CLUSTERING,
- Data Structures, types of Data Mining, Min-Max Distance, One-way, K-Means Clustering
- DWH Lifecycle: Data-Driven, Goal-Driven, User-Driven Methodologies
- DWH Implementation: Goal Driven Approach
- DWH Implementation: Goal Driven Approach
- DWH Life Cycle: Pitfalls, Mistakes, Tips
- Course Project
- Contents of Project Reports
- Case Study: Agri-Data Warehouse
- Web Warehousing: Drawbacks of traditional web sear ches, web search, Web traffic record: Log files
- Web Warehousing: Issues, Time-contiguous Log Entries, Transient Cookies, SSL, session ID Ping-pong, Persistent Cookies
- Data Transfer Service (DTS)
- Lab Data Set: Multi -Campus University
- Extracting Data Using Wizard
- Data Profiling