 |
SUMMARY OF FINDGINS |
| << ANALYSIS OF BALANCE SHEET & INCOME STATEMENT |
Financial
Statement Analysis-FIN621
VU
Lesson-45
SUMMARY
OF FINDGINS
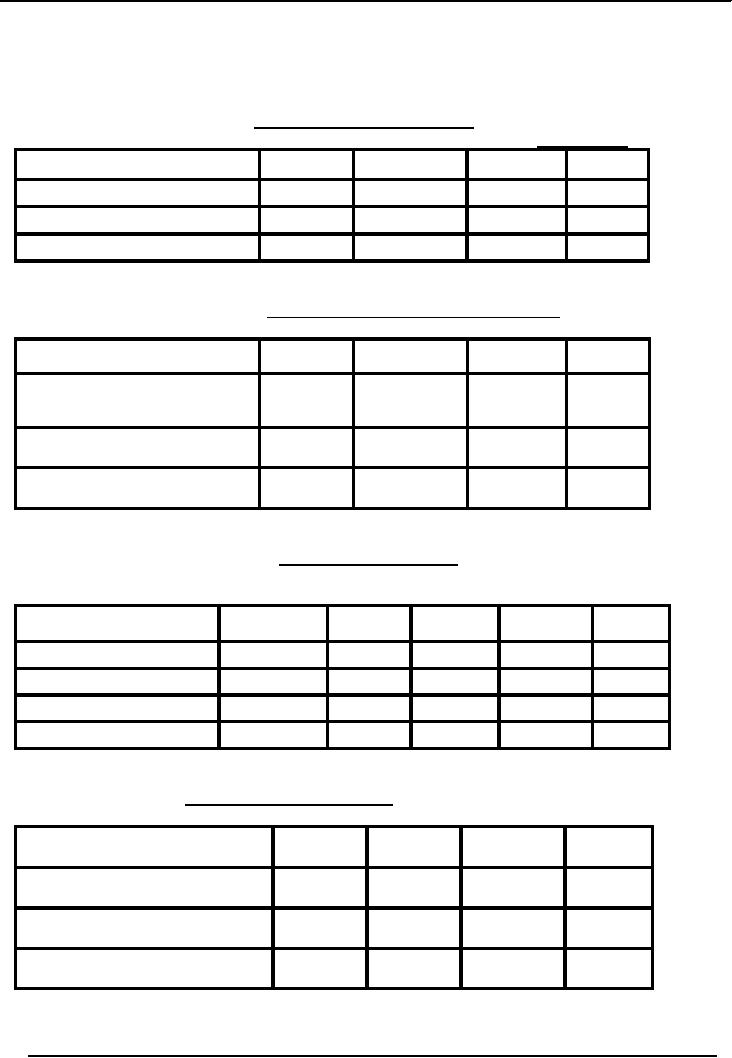
Table-9
COST OF
TRANSPORTATION
Rs.
in million
1976-77
1977-78
1978-79
1979-80
Cost
of cane purchased
22.26
24.51
13.81
2.60
Carriage
& incidentals
2.15
3.48
1.95
0.23
Carriage
as % of cost
10%
14%
14%
9%
Table-10
PER
TON COST OF TRANSPORTATION
1976-77
1977-78
1978-79
1979-80
Carriage
and incidentals (Rs. in
2.15
3.48
1.95
0.23
million)
Cane
procured (Tons)
140,292
166,271
93,731
14,375
Average
per ton cost (Rs)
15.32
20.92
20.80
16.00
Table-11
EMPLOYEE
STRENGTH
Actual
strength during the years
As per
PC1
1976-77
1977-78
1978-79
1979-80
Permanent
185
605
625
615
495
Seasonal
556
639
655
590
638
Total
741
1244
1280
1205
1133
%
increase
68%
73%
63
%
53%
Table-12
COST OF
ESTABLISHMENT
1976-77
1977-78
1978-79
1979-80
Cost
(Rs. in million)
7.72
9.11
8.90
8.51
Sugar
produced (tons)
11344
14015
8007
1206
Cost
per ton of sugar (Rs)
681
650
1112
7053
162
Financial
Statement Analysis-FIN621
VU
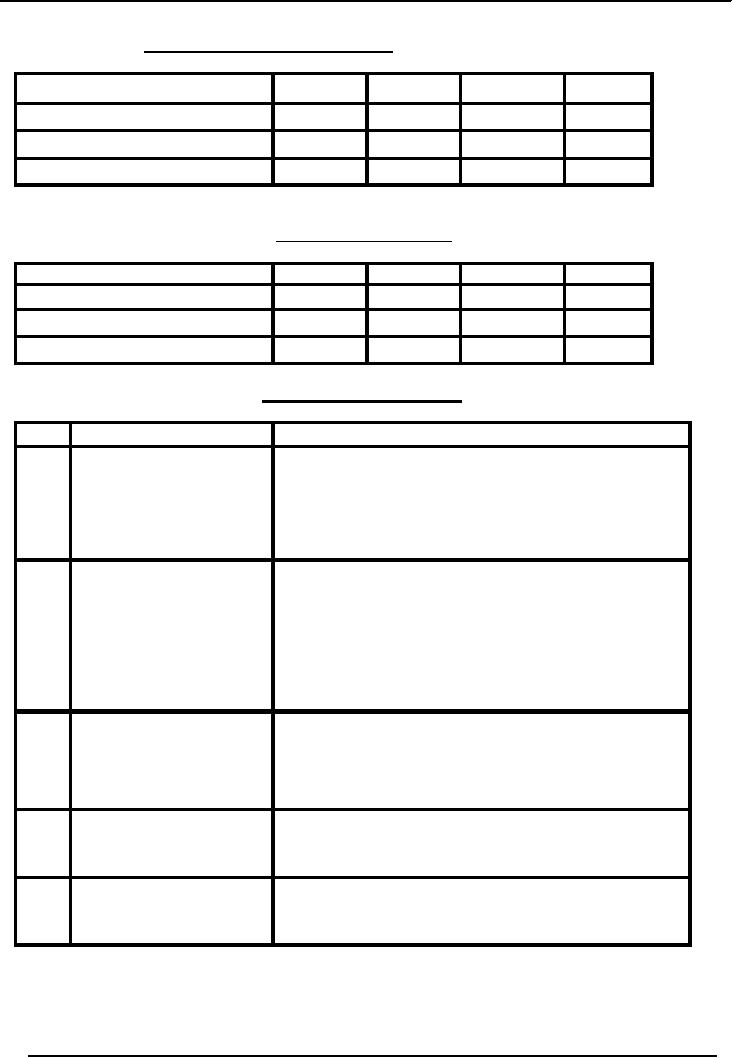
Table-13
PRODUCTIVITY
PER EMPLOYEE
1976-77
1977-78
1978-79
1979-80
Sugar
produced (Tons)
11344
14015
8007
1206
Employee-strength
1244
1280
1205
1133
Productivity
per person (Tons)
9.1
10.9
6.6
1.1
Table-14
FINANCIAL
EXPENSES
Rs.
in million
1976-77
1977-78
1978-79
1979-80
Financial
expenses
4.5
4.6
5.5
8.0
Sales
58
52
42
20
Financial
expenses as % of sales
8%
9%
13%
40%
SUMMARY
OF FINDGINS
No.
Area
Findings
1.
Finance:
·
Financial
position poor
·
Equity
eroded
·
Debt
burden: Rs.57 m
·
Financial
Charges: Rs.8 m
·
Poor
Liquidity
2.
Profitability:
·
Constantly
losing.
·
Losses
understand.
Reasons:
·
not
enough cane
·
high
transportation cost.
·
heavy
fixed costs.
·
vicious
circle of financial
charges
3.
Raw
Material:
·
Requires
185,000 tons cane.
·
Cane
from local area: 5-44%
only.
·
Bringing
cane from far off
places.
·
erroneous
PC1
4.
Production:
·
sugar
production capacity: 15,000
ton
·
Never
met target.
·
High
fixed cost of
production.
5.
Administration:
·
Excess
employees.
·
Excess
per ton cost of establishment.
·
Low
productivity.
163

Financial
Statement Analysis-FIN621
VU
OVERALL
ASSESSMENT
1.
The
unit has been a losing
concern over since 1965
when it became
operational.
Accumulated
loss as on June 30, 1980
was over Rs.114 million as
against equity of Rs.81
million.
Equity
thus stood completely eroded. The
unit is consequently dependent entirely on
debt, which
amounted to
Rs.57 million as on June 30,
1980. This involved annual
financial charges of Rs.8
million.
2.
The
feasibility of this unit had
been projected on the clear assurance
that abundant
sugar-cane
will be available in the vicinity.
These assurances proved
entirely erroneous. Supplies of
sugar-cane
from the vicinity were very inadequate.
The company has had to supplement procurement
by
additional
purchases from distant
areas. This involved
excessive cost of transportation.
Even then the
unit
could not manage to procure the
required quantity of cane.
Below capacity operations of the
plant
has,
therefore, been a crippling
constraint.
3.
A number of
steps are being taken at
unit and government level to
improve sugar-cane
availability.
This includes loans to growers for
seeds and fertilizers, and award of a
higher purchase
price
for sugar-cane above the controlled rate.
These measures are expected to
aid the project but it
may
not,
however, still be able to overcome
its financial
difficulties.
4.
The
unit could in fact procure
only 8% of its cane
requirement during 1979-80,
of
which
only 5% was procured locally, despite
award of a higher purchase price
for sugar-cane above the
controlled
rate. Inadequate cane availability
and heavy fixed costs (due
to excessive employee-strength
and
increasing burden of financial charges)
remain serious constraints.
5.
The
project therefore does not
seem to be a viable one. Prospects of
its dis-investment
and
privatization may be seriously
looked into.
164
Table of Contents:
- ACCOUNTING & ACCOUNTING PRINCIPLES
- Dual Aspect of Transactions
- Rules of Debit and Credit
- Steps in Accounting Cycle
- Preparing Balance Sheet from Trial Balance
- Business transactions
- Adjusting Entry to record Expenses on Fixed Assets
- Preparing Financial Statements
- Closing entries in Accounting Cycle
- Income Statement
- Balance Sheet
- Cash Flow Statement
- Preparing Cash Flows
- Additional Information (AI)
- Cash flow from Operating Activities
- Operating Activities portion of cash flow statement
- Cash flow from financing Activities
- Notes to Financial Statements
- Charging Costs of Inventory to Income Statement
- First-in-First - out (FIFO), Last-in-First-Out (LIFO)
- Depreciation Accounting Policies
- Accelerated-Depreciation method
- Auditors Report, Opinion, Certificate
- Management Discussion & Analyses (MD&A)
- TYPES OF BUSINESS ORGANIZATIONS
- Incorporation of business
- Authorized Share Capital, Issued Share Capital
- Book Values of equity, share
- SUMMARY
- SUMMARY
- Analysis of income statement and balance sheet:
- COMMON SIZE AND INDEX ANALYSIS
- ANALYSIS BY RATIOS
- ACTIVITY RATIOS
- Liquidity of Receivables
- LEVERAGE, DEBT RATIOS
- PROFITABILITY RATIOS
- Analysis by Preferred Stockholders
- Efficiency of operating cycle, process
- STOCKHOLDERS EQUITY SECTION OF THE BALANCE SHEET 1
- STOCKHOLDERS EQUITY SECTION OF THE BALANCE SHEET 2
- BALANCE SHEET AND INCOME STATEMENT RATIOS
- Financial Consultation Case Study
- ANALYSIS OF BALANCE SHEET & INCOME STATEMENT
- SUMMARY OF FINDGINS