 |
Financial Consultation Case Study |
| << BALANCE SHEET AND INCOME STATEMENT RATIOS |
| ANALYSIS OF BALANCE SHEET & INCOME STATEMENT >> |

Financial
Statement Analysis-FIN621
VU
Lesson-43
CASE
STUDY
Assumption
The
company you have chosen has
hired you as a financial
consultant.
Assignment
Based
on your analysis of the firm's financial
statements and any
relevant
supplementary
information you can obtain
about the firm and its
operating environment, identify
areas
in
which the company is performing well
(strengths) and problem areas
(weaknesses); Also advise
management
of corrective measures for
improvement.
Data
The
time period for the analysis
should include five full
years or four years plus
interim
statements
for the most recent year. In
addition to the financial statements and
other material in the
annual
reports, you should review
relevant materials from outside
sources such as
newspapers,
periodicals
and investment resources.
Outline
The
following outline is provided
for guidance, but the analysis should be
adjusted, as
appropriate,
to conform to the individual
characteristics of the firm.
Suggested
Outline for the Financial
Statement Analysis
I.
Introduction
A.
Objective
of paper
B.
Summary of
Findings
II.
Firm,
Industry, and Environment
A.
Description
of firm and its
management
B.
Discussion of
competitive environment
C.
Economic
climate and outlook
D.
Other
factors, e.g. governmental regulations,
Labour relations,
Litigations.
III.
Evaluation
of Financial Statements
A.
Overview
B.
Short-term
liquidity
C.
Operating
efficiency
D.
Capital
structure and long-term
solvency
E.
Profitability
F.
Market
measures
IV.
Outlook,
Summary, and Conclusions
A.
Outlook
for performance, earnings
projection
B.
Summary and
Conclusions
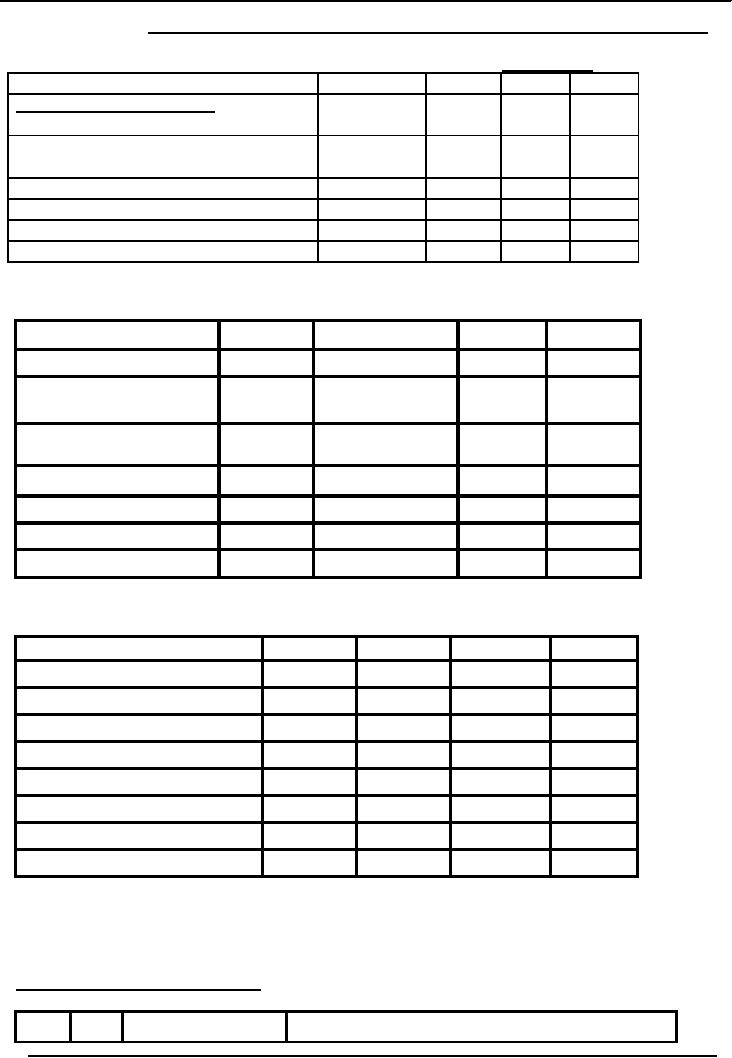
Table-1
XYZ
SUGAR
MILLS
154
Financial
Statement Analysis-FIN621
VU
BALANCE
SHEET
AS
ON
JUNE
30,
.
Rs.
in million
Year
1977
1978
1979
1980
CAPITAL
& LIABILITIES
Owners'
equity
Original
Investment by the
Controlling
10
10
10
10
Corporation
(CC)
Current
A/C with CC
55
59
65
71
Total
equity
65
69
75
81
Less
accumulated losses
66
82
94
114
(1)
(13)
(19)
(33)
Net
equity
Current
Liabilities
1977
1978
1979
1980
Short-term
borrowing
25
26
29
37
Trade
creditors (liabilities for
7
12
11
4
expenses)
Liabilities
for other finances 8
17
13
10
40
55
53
51
Fixed
Liabilities
Long-term
loans
10
13
15
20
49
55
49
38
Total
capital & Liabilities
Assets
Fixed
assets
16
15
14
14
Current
assets
-
Cash
5
4
3
2
-Receivable
from Bibo
12
13
15
17
-Other
Receivables
2
2
3
3
-Pre-paid
1
1
1
1
-
Inventory
13
20
13
1
Total
current assets
33
40
35
24
Total
Assets
49
55
49
38
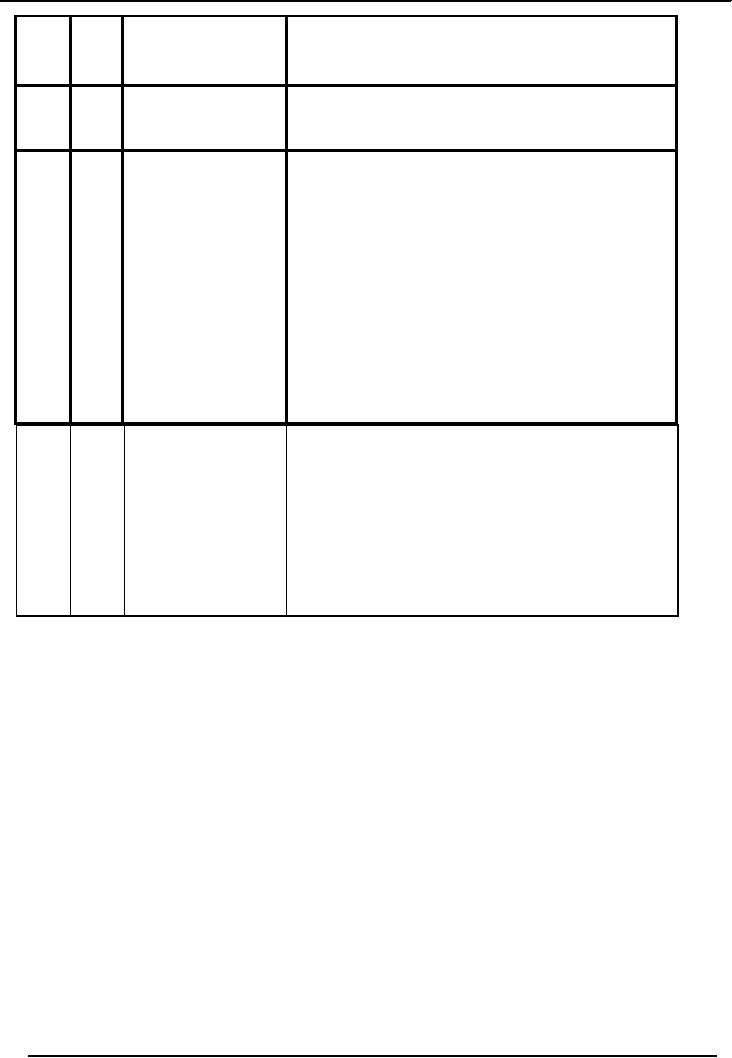
ANALYSIS
OF BALANCE SHEET
No.
Table
Data/Facts
Findings
155
Financial
Statement Analysis-FIN621
VU
1
1
Balance
Sheets for the
·
Accumulated
losses (Rs.114 million as at
June
year
1976-80
30,
1980)
·
Constantly
losing enterprise.
2
2
Accumulated
losses
·
Losses
increasing over the years.
over
the period.
3
1
Balance
Sheet
a)
Capital cost of the project
was Rs.26
million,
met
through:
-
Equity Fund from CC
Rs.10 million.
- Loans
from CC: Rs.16
million
b)
"Current account with "CC"
comprises, funds
given
by CC over the years as working
capital.
c)
Total equity as on
30.06.1980
=
Rs.81 million.
d)
Equity completely eroded by accumulated
loss of
Rs.114
million.
e)
Equity eroded since
1976-77
4
1
Borrowing
(short-
a) Increased
from Rs.35 million in
1976-77 to
term &
long term)
Rs.57
million in 1979-80.
b)
Debt burden increasing because of
unit's
inability
to repay the principal owing
to
persistent
losses.
c)
Vicious circle.
d)
Huge financial charges (Rs.8
million during
1979-80)
156
Table of Contents:
- ACCOUNTING & ACCOUNTING PRINCIPLES
- Dual Aspect of Transactions
- Rules of Debit and Credit
- Steps in Accounting Cycle
- Preparing Balance Sheet from Trial Balance
- Business transactions
- Adjusting Entry to record Expenses on Fixed Assets
- Preparing Financial Statements
- Closing entries in Accounting Cycle
- Income Statement
- Balance Sheet
- Cash Flow Statement
- Preparing Cash Flows
- Additional Information (AI)
- Cash flow from Operating Activities
- Operating Activities portion of cash flow statement
- Cash flow from financing Activities
- Notes to Financial Statements
- Charging Costs of Inventory to Income Statement
- First-in-First - out (FIFO), Last-in-First-Out (LIFO)
- Depreciation Accounting Policies
- Accelerated-Depreciation method
- Auditors Report, Opinion, Certificate
- Management Discussion & Analyses (MD&A)
- TYPES OF BUSINESS ORGANIZATIONS
- Incorporation of business
- Authorized Share Capital, Issued Share Capital
- Book Values of equity, share
- SUMMARY
- SUMMARY
- Analysis of income statement and balance sheet:
- COMMON SIZE AND INDEX ANALYSIS
- ANALYSIS BY RATIOS
- ACTIVITY RATIOS
- Liquidity of Receivables
- LEVERAGE, DEBT RATIOS
- PROFITABILITY RATIOS
- Analysis by Preferred Stockholders
- Efficiency of operating cycle, process
- STOCKHOLDERS EQUITY SECTION OF THE BALANCE SHEET 1
- STOCKHOLDERS EQUITY SECTION OF THE BALANCE SHEET 2
- BALANCE SHEET AND INCOME STATEMENT RATIOS
- Financial Consultation Case Study
- ANALYSIS OF BALANCE SHEET & INCOME STATEMENT
- SUMMARY OF FINDGINS