 |
Lecture-22
DQM:
Quantifying Data Quality
Background
How good is a
company's data quality? Answering this
question requires usable
data quality
metrics.
Studies have confirmed data
qua lity is a multi-dimensional concept.
Companies must
deal
with both the subjective perceptions of
the individuals involved
with the data, and
the
objective
measurements based on the
data set in question.
Subjective data
quality assessments reflect
the needs and experiences of
stakeholders: the
collectors,
custodians, and consumers of
data products. This was
the approach adopted
for
assuring
the quality of products
too.
More on
Characteristics of Data
Quality
Data
Quality Dimensions
Believability
Appro priate
Amount of Data
Timeliness
Accessibility
Objectivity
Interpretability
Uniqueness
Data
Quality Assessment Techniques
§
Ratios
§
Min-Max
When
performing objective assessments,
companies follow a set of principles to
develop metrics
specific to
their needs, there is hard to
have "one size fits
all" approach. Three
pervasive
functional forms
are (i) simple ratio, (ii)
min or max operation, and
(iii) weighted average.
Refinements of
these functional forms, such as
addition of sensitivity parameters, can
be easily
incorporated. Often,
the most difficult task is
precisely defining a dimension, or
the aspect of a
dimension that
relates to the company's specific
application. Formulating the metric
is
straightforward
once this task is
complete.
173

Data
Quality Assessment Techniques
§
Simple
Ratios
§
Free-of-error
§
Completeness
§
Consistency
Simple
Ratios
The
simple ratio measures the ratio of
desired outcomes to total
outcomes. Since most
people
measure
exceptions, however, a preferred
form is the number of undesirable
outcomes divided by
total outcomes
subtracted from 1. This
simple ratio adheres to the
convention that 1 represents
the
most
desirable and 0 the least
desirable score. Although a
ratio illustrating undesirable
outcomes
gives
the same information as one
illustrating desirable outcomes, but
experience suggests
managers
prefer the ratio showing
positive outcomes, since
this form is useful for
longitudinal
comparisons
illustrating trends of continuous improvement.
Many traditional data quality
metrics,
such as
free-of-error, completeness, and
consistency
take
this form. Other dimensions
that can be
evaluated
using this form include
concise representation, relevancy, and
ease of manipulation.
The
free-of-error dimension
represents data correctness. If
one is counting the data
units in error,
the metric is
defined as the number of data
units in error divided by
the total number of data
units
subtracted
from 1. In practice, determining what
constitutes a data unit and
what is an error
requires a set of clearly
defined criteria. For example, the
degree of precision must be
specified. It
is possible
for an incorrect character in a text
string to be tolerable in one circumstance but not
in
another.
The
completeness dimension can be
viewed from many pe
rspectives, leading to different
metrics.
At the
most abstract level, one
can define the concept of
schema completeness, which is
the
degree to
which entities and
attributes are not missing
from the schema. At the
data level, one
can
define column
complete ness as a function of
the missing values in a column of a
table. A third
type is
called population completeness. If a column
should contain at least one
occurrence of all
34 districts of
Punjab, for example, but it
only contains 30 districts,
then we have population
incompleteness.
Each of the three types
(schema completeness, column
completeness, and
population
completeness) can be measured by taking
the ratio of the number of incomplete
items
to the
total number of items and
subtracting from 1.
The
consistency dimension
can also be viewed from a
number of perspectives, one being
consistency of
the same (redundant) data values
across tables. Codd's
referential Integrity
constraint is an
instantiation of this type of
consistency. As with the
previously discussed
dimensions, a
metric measuring consistency is
the ratio of violations of a specific
consistency
type to
the total number of consistency checks
subtracted from one.
Data
Quality Assessment Techniques
§
Min-Max
§ Believability
§
Appropriate Amount of
Data
174
Min or Max
Operation
To handle
dimensions that require the
aggregation of multiple data quality
indicators (variables),
the
minimum or maximum operation can be applied.
One computes the minimum
(or maximum)
value
from among the normalized values of th
individual data quality indicators.
The min
e
operator is
conservative in that it assigns to
the dimension an aggregate value no
higher than the
value of
its weakest data quality
indicator (evaluated and normalized to
between 0 and 1). The
maximum
operation is used if a liberal
interpretation is warranted. The
individual variables may
be measured
using a simple ratio. Two
interesting examples of dimensions
that can make use
of
the
min operator are
believability and appropriate
amount of data. The max
operator proves
useful in more
complex metrics applicable to
the dimensions of timeliness
and accessibility.
Believability
is
the extent to which data is
regarded as true and
credible. Among other
factors, it
may reflect an
individual's assessment of the
credibility of the data source,
comparison to a
commonly
accepted standard, and
previous experience. Each of
these variables is rated on a
scale
from 0 to 1,
and overall believability is
then assigned as the minimum
value of the three.
Assume
the
believability of the data
source is rated as 0.6;
believability against a common
standard is 0.8;
and
believability based on experience is
0.7. The overall
believability rating is then
0.6 (the
lowest number). As indicated
earlier, this is a conservative assessment. An
alternative is to
compute
the believability as a weighted average
of the individual
components.
A working
definition of the appropriate
amount of data should reflect
the data quantity being
neither too
little nor too much. A
general metric that embeds
this tradeoff is the minimum
of two
simple
ratios: the ratio of the
number of data units provided to
the number of data units
needed,
and
the ratio of the number of
data units needed to the
number of data units
provided.
Data
Quality Assessment Techniques
§
Min-Max
§
Timeliness
§
Accessibility
Timeliness
reflects
how up-to-date the data is
with respect to the task
it's used for. A
general
metric to
measure timeliness is to measure
the maximum of one of two
terms: 0 and one
minus
the
ratio of currency to volatility i.e.
Max(0, 1-C/V) . Here, currency (C) is
defined as the age
(A)
plus
the delivery time (Dt) minus
the input time (It) C = A + Dt -
It. Volatility refers to the
length
of time data
remains valid; delivery time refers to
when data is delivered t o the
user; input time
refers to when
data is received by the
system, and age refers to
the age of the data
when first
received by the
system.
A similarly
constructed metric can be
used to measure accessibility, a dimension
reflecting ease
of data
attainability. The metric emphasizes the
time aspect of accessibility and is
defined as the
maximum value of
two terms: 0 or one minus
the time interval from
request by user to delivery
to
user
divided by the time interval
from request by user to the
point at which data is no longer
useful. Again, a
sensitivity factor in the form of an
exponent can be
included.
175

Data
Quality Validation
Techniques
§
Referential
Integrity (RI).
§
Attribute
domain.
§
Using
Data Quality Rules.
§
Data
Histograming.
Some of
the data validation
techniques have been listed.
We will discuss each of the
technique in
detail.
Referential
Integrity Validation
Example:
How
many outstanding payments in
the DWH without a
corresponding customer_ID in the
customer
table?
While
doing total quality measurement, you
measure RI every week (or
month) and hopefully
the
number of orphan
records will be going down,
as you will be fine tuning
the processes to get
rid
of the RI
problems. Remember, RI problem is
peculiar to a DWH, this will not
happen in a
trad
itional OLTP system.
Business
Case for RI
Not
very interesting to know
number of outstanding payments
from a business point of
view.
Interesting to
know the actual amount
outstanding, on per year basis, per
region basis...
It is important
to measure the actual (i.e.
business) impact of the data
quality problem. Knowing
how
many claims are orphan might be
interesting from an analysis
point of view. But
knowing
how
many dollars are associated
with orphan claims has a
business value. If there are
too many
orphan claims,
but too many dollars are not associated
with those claims, then it
does not have a
business
impact. We are always trying
to relate with the business
impact.
Performance
Case for RI
Cost of
enforcing RI is very high
for large volume DWH imp
lementations, therefore:
§
Should RI
constraints be turned OFF in a data
warehouse? or
§
Should
those records be "discarded"
that violate one or more RI
constraints?
Cost of
transactional RI enforcement is very high
for large volume DWH
implementations.
Assume a
company with a multi million
row customer table i.e.
n
rows.
Checking for RI using
a
naive
approach would take O(n) time, using a
smart technique with some
kind of a tree data
structure
would require O(log n)
time,
ignoring RI altogether will
take O(1)
time.
Therefore, for a
chain
store with several million
transactions per day, every time
spending O(log n)
time
will turn
out to be
extremely expensive.
176

Another point
worth noting is, are you
willing to "throw away" rows that
violate one or more
constraints?
May be not, because this
will result in losing more information
without gaining
anything in
return.
The
bottom line is, most
DWH implementations today do
not use RI constraints enforced by
the
database, but as
TQM methods improve overall
data quality and database
optimizers become
more
sophisticated in the use of
constraints, this will
become a more attractive option.
3 steps of
Attribute Domain
Validation
The
occurrences of each domain
value within each coded
attribute of the
database.
Actual content
of attributes against set of
valid values.
Exceptions to
determine cause and impact
of the data quality
defects.
Step-1:
This
will be done for every
single table. Run a script by table, by
column and collect all
the
values in that column and do a
count on them, so that you
know for each domain value
how
many
values do you have of that particular
domain.
Example
from a real life scenario:
In a
health care company,
diagnostic codes were put in
the
medical claims.
The codes had to correspond
to different healthcare plans.
People were losing so
much
productivity due to error
check messages that they
turned off the checks so as to
get more
claims
processed! That was a very
bad decision, as they were
now putting in junk data.
This was
quite alright
with the operations manager,
as he was not measured on the
quality of the data,
but
on how
many claims per hour were
put in.
Step-2:
For
each table, column and column
value look at how many
values are not in my valid
domain
table. The meta data should
specify the data dictionary
for every column i.e. the
valid
values for
that column. Any data that
is not as per the valid value is a
data quality problem
either
in the
meta data or in the data
itself.
Step-3:
Once
the defects are found, go
and track them down
back to source
cause(s).
Point to be
noted is that, if at all
possible, fix the problem in
the source system. People
have the
tendency of
applying fixes in the DWH.
This is a wrong i.e. if you
are fixing the problems in
the
DW; you
are not fixing th e root
cause. A crude analogy would
clarify the point. If you
keep
cleaning
the lake, and keep on
flushing the toilet in the
lake, you are not solving
the problem. The
problem is not being
fixed at the source system,
therefore, it will persist.
Attribute
Domain Validation: What
next?
What to do
next?
§ Trace
back to source
cause(s).
§
Quantify
business impact of the
defects.
§
Assess
cost (and time frame) to fix
and proceed
accordingly.
Easier
said than done, this
unfortunately is a big problem, as it
invo lves office politics in
most
organizations.
The reason being, operational people do
not care about the DWH,
they are not
177
measured on
data quality, nobody cares. The
requirement is to apply pressure on the
operational
source
system personnel to fix the
data quality problems, and turn ON
the error checks
etc.
So what is the
solution? The best way of
applying pressure is to publish. Publish what is
the
quality of
the data you get from
the source system. You
will be amazed at the
results, how fast
people
start fixing their data. You
can beg all you can behind
closed doors, but when it
becomes
public knowledge
activity starts. But have to
be careful because of office politics.
However,
before taking
any actions quantify
business impact of the
defects, and subsequently
assess cost
(and time frame)
for fix and proceed
accordingly.
Data
Quality Rules
Table-22.1:
Data Quality
Rules
Specific data
problems are linked to business
rules, and then generic
and specific rule sets
are
established to
measure how good the data is
within an information system.
Table 22.1
illustrates
several rule
sets and an acceptable
method of documenting known data
quality problems.
Establish a
set of rule sets and
measurements to execute as SQL
statements or as data quality
filters in an
automated data quality assessment tool.
The rule sets represent
the data quality
metrics
used to judge conformance of data to
business rules. Data quality
project managers use
established
and relevant data standards
as the basis for
establishing rule sets.
These data standards
provide
valid values for many common
data elements such as
Country Code, Country Name,
and
City
Abbreviation.
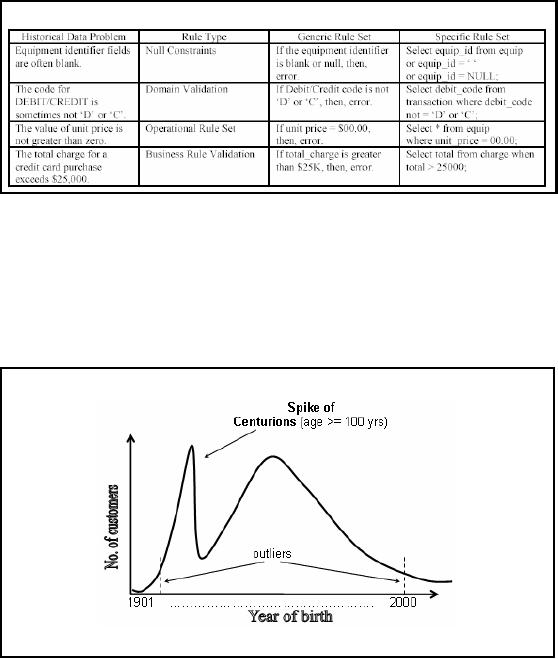
Statistical
Validation using Histogram
NOTE:
For a certain environment,
the above distribution may be perfectly
normal.
178
Figure-22.1:
Statistical Validation using
Histogram
To check
the accuracy of the date of
birth, construct a histogram of
date of births. This
histogram
could be of year
of birth or date of birth excluding
the year. If the year of
birth is missing in a
claim, or
someone would not like to
disclose it while registering online,
usually the year of
choice
is 1901 ("magic"
value) or date of birth as
"1st Jan". This will
result in a huge spike
for
centurions or
New Year birthdays. While you
expected an even distribution of
birthdays across
the
year, you will get a spike
as shown in Figure22.1.
The
approach should be to try
all the different ways of
constructing histograms and
look for large
spikes. If
there is somet hing wrong,
then based on reasonable
business knowledge, you are
likely
to detect
it. Note that this is NOT
data mining. In data mining
you are looking for patterns
that
you don't
expect to exist or checking a
hypothesis. Over here you
know what you are lo oking
for.
179
Table of Contents:
- Need of Data Warehousing
- Why a DWH, Warehousing
- The Basic Concept of Data Warehousing
- Classical SDLC and DWH SDLC, CLDS, Online Transaction Processing
- Types of Data Warehouses: Financial, Telecommunication, Insurance, Human Resource
- Normalization: Anomalies, 1NF, 2NF, INSERT, UPDATE, DELETE
- De-Normalization: Balance between Normalization and De-Normalization
- DeNormalization Techniques: Splitting Tables, Horizontal splitting, Vertical Splitting, Pre-Joining Tables, Adding Redundant Columns, Derived Attributes
- Issues of De-Normalization: Storage, Performance, Maintenance, Ease-of-use
- Online Analytical Processing OLAP: DWH and OLAP, OLTP
- OLAP Implementations: MOLAP, ROLAP, HOLAP, DOLAP
- ROLAP: Relational Database, ROLAP cube, Issues
- Dimensional Modeling DM: ER modeling, The Paradox, ER vs. DM,
- Process of Dimensional Modeling: Four Step: Choose Business Process, Grain, Facts, Dimensions
- Issues of Dimensional Modeling: Additive vs Non-Additive facts, Classification of Aggregation Functions
- Extract Transform Load ETL: ETL Cycle, Processing, Data Extraction, Data Transformation
- Issues of ETL: Diversity in source systems and platforms
- Issues of ETL: legacy data, Web scrapping, data quality, ETL vs ELT
- ETL Detail: Data Cleansing: data scrubbing, Dirty Data, Lexical Errors, Irregularities, Integrity Constraint Violation, Duplication
- Data Duplication Elimination and BSN Method: Record linkage, Merge, purge, Entity reconciliation, List washing and data cleansing
- Introduction to Data Quality Management: Intrinsic, Realistic, Orrs Laws of Data Quality, TQM
- DQM: Quantifying Data Quality: Free-of-error, Completeness, Consistency, Ratios
- Total DQM: TDQM in a DWH, Data Quality Management Process
- Need for Speed: Parallelism: Scalability, Terminology, Parallelization OLTP Vs DSS
- Need for Speed: Hardware Techniques: Data Parallelism Concept
- Conventional Indexing Techniques: Concept, Goals, Dense Index, Sparse Index
- Special Indexing Techniques: Inverted, Bit map, Cluster, Join indexes
- Join Techniques: Nested loop, Sort Merge, Hash based join
- Data mining (DM): Knowledge Discovery in Databases KDD
- Data Mining: CLASSIFICATION, ESTIMATION, PREDICTION, CLUSTERING,
- Data Structures, types of Data Mining, Min-Max Distance, One-way, K-Means Clustering
- DWH Lifecycle: Data-Driven, Goal-Driven, User-Driven Methodologies
- DWH Implementation: Goal Driven Approach
- DWH Implementation: Goal Driven Approach
- DWH Life Cycle: Pitfalls, Mistakes, Tips
- Course Project
- Contents of Project Reports
- Case Study: Agri-Data Warehouse
- Web Warehousing: Drawbacks of traditional web sear ches, web search, Web traffic record: Log files
- Web Warehousing: Issues, Time-contiguous Log Entries, Transient Cookies, SSL, session ID Ping-pong, Persistent Cookies
- Data Transfer Service (DTS)
- Lab Data Set: Multi -Campus University
- Extracting Data Using Wizard
- Data Profiling