 |
Dow Theory |
| << Indicators with Economic Justification |
| VALUATION PHILOSOPHIES >> |
Investment
Analysis & Portfolio Management
(FIN630)
VU
Lesson
# 10
TECHNICAL
ANALYSIS Contd...
Dow
Theory:
Charles
Dow was one of the founders of
Dow Jones & Co. (DJ,
NYSE), publisher of
The
Wall
Street Journal. He is sometimes credited
with being the inventor of
the point and
figure
chart. The Dow
Theory holds
that there are three
components in the movement
of
stock
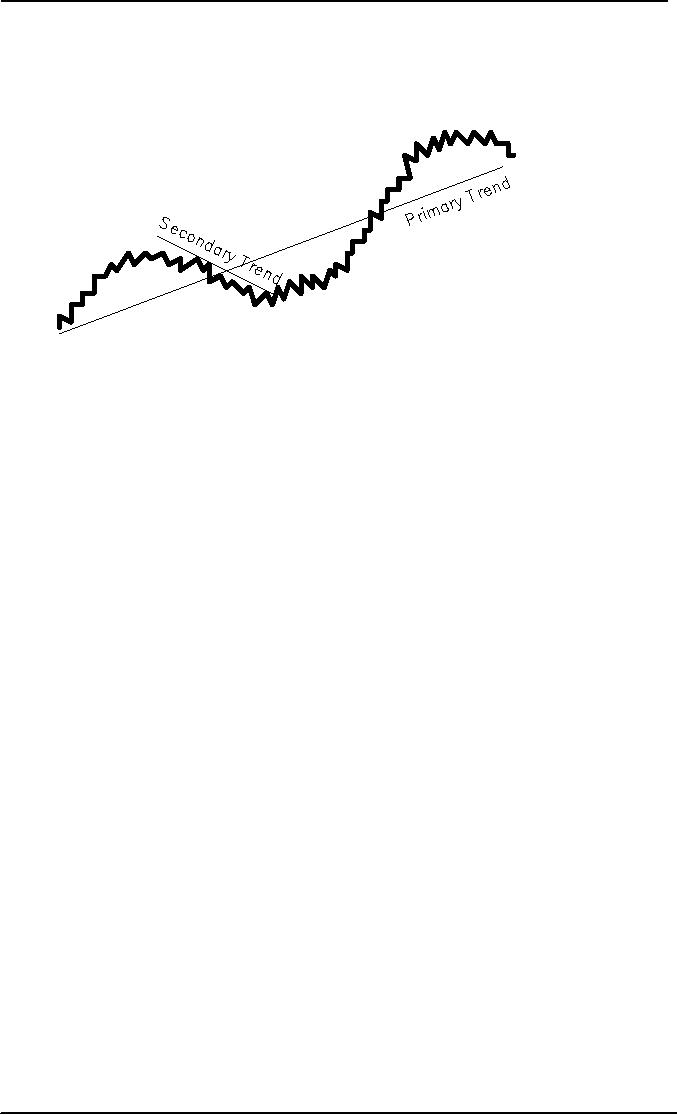
prices. The primary
trend is
the long-term direction of
the market and is the
most
important.
The terms bull and bear
originated with the
direction of Dow Theory
primary
trend.
The secondary
trend refers
to a temporary reversal in the
primary trend, one that
does
not
persist long enough to become
the primary trend. Finally,
daily fluctuations in the
stock
price
are meaningless and contain no useful
information.
The
Dow Theory is often
illustrated by an ocean analogy.
The tide is either is coming
in or
going
out the primary trend.
Even when the tide is
going out, waves still
wash ashore
the
secondary. And as everyone
who has ever spread a
blanket on the beach
knows,
sometimes
for no apparent reason ripples
from the waves reach far up
the sand and soak
your
belongings.
The
Dow Theory is based on the
price movement of the Dow
Jones Industrial
Average
(DJIA).
Changes in the primary trend
of the DJIA are confirmed by
the Dow Jones
Transportation
Average. The logic is that
industrial firms make products, and
transportation
companies
ship them. When both
averages are advancing, the
economy is in good shape. An
explanation
of the technical points of
this famous market technique
is available in the
most
public
libraries.
Surprising,
Charles Dow had little to do
with the development of this
theory. The Wall
Street
Journal, in fact, suggests
that the entire field of
technical analysis may
have
originated
from "the distortion and
selective editing of Mr. Dow's ideas."
While Dow were
believed
highly correlated with the
business cycle.
In
Charles H. Dow and the Dow
Theory, George W. Bishop, a financial
historian, states,
"there
is no evidence that Dow
looked upon the averages as
containing anything more
than
an
indication of statistical nature of
the trend." There is also no
evidence Dow ever
suggested
prices would be predicted by interpreting
charts. The term "Dow
Theory" appears
to
have first been used in a
1902 book by Samuel Armstrong
Nelson entitled the ABC
of
stock
speculation.
68

Investment
Analysis & Portfolio Management
(FIN630)
VU
OLD
PUZZLES & NEW DEVELOPMENT:
Fibonacci
Numbers:
Fibonacci
Numbers have
intrigued mathematics and scientist
for hundreds of years.
Leonard
Fibonacci (1170-1240) was a medieval
mathematician who discovered
the series of
numbers
while studying the
reproductive behavior of rabbits.
The beginning of the
Fibonacci
series is shown
below.
1,1,2,3,5,8,5,13,21,34,55,89,144,233,......
After
the initial pairs of ones,
each succeeding number is simply
the sum of the
previous
two.
The
remarkable thing about these
numbers is the frequency
with which they appear in
the
environment.
Sunflowers have seeds
spirals around the center of
the plant. Some
spirals
contain
seeds leaning counterclockwise,
with other spirals going
the other way. On
most
sunflowers,
the number of clockwise
spirals and the number of
counter clockwise spirals
are
adjacent
Fibonacci numbers. A blossom
might have 34 counterclockwise
spirals and 55
clockwise
spirals. The structure of
pine cones, the number of
chambers in a nautilus
seashell,
the topology of spiraling
galaxies, and the ancestry of
bees all reveal
Fibonacci
numbers.
Even a professional journal,
the Fibonacci quarterly, is
devoted to the study of
this
series.
Technical
Analyst who follows
Fibonacci numbers usually
makes use of the number
1.618.
This
number is called the golden
mean and appears in ancient writings and
architecture.
(The
golden mean features prominently in
the dimensions of the
Parthenon). After the
first
10 or so
numbers in the series, each
Fibonacci number divided by
its immediate
predecessor
equals
1.618. For example,
89/55=1.618; 134/89= 1.618 and so
on. This magic number
is
used
to calculate Fibonacci
ratios.
Many
Fibonacci advocates in the
investment business use the
first two ratios, 0.382
and
0.618,
to "compute retrenchment levels of a
previous move." For
instance, a stock that
falls
from
$50 to $35(a 30 percent drop) will
encounter resistance to further
advances after it
recoups
38.2 percent of its loss
(that is, after it rises to
$40.73).
Some
technical analysts keep close
tabs on resistance and support
levels as predicted by
the
Fibonacci
ratios. Even people who do
not subscribe to this business
know that many
other
people
do, and that when stock
prices approach important Fibonacci
levels, unusual
things
can
occur.
Fibonacci
numbers occur frequently and inexplicably in
nature.
Kondratev
Wave Theory:
Nikolay
Kondratev was a Russian economist and
statistician born in 1892. He
helped
develop
the first soviet five-year
plan. From 1920 to1928 he was
Director of the study
of
business
activity at the Timiriazev
Agriculture Academy. While
there he devoted his
attention
to the study of Western
capitalist economies. In the economies of
Great Bertain
and
United states, he identified
long term business cycles
with a period of 50 to 60
years.
He
became well known after
the U.S. crash of 1870. His
hypothesis of a long-term
business
cycle
is the called Kondratev
wave theory.
69

Investment
Analysis & Portfolio Management
(FIN630)
VU
Note
that the market crashof 1987
occurred 58 years after the crash of
1929, a period
consistent
with Kondratev's theory.
Some modern economists
believe that
significant
macroeconomics
changes, such as floating exchange
rates, the elimination of
the gold
standard, and
the reduction of barriers to
free trade, make the
business cycle less
predictable.
Still, many market analysts
consider Kondratev's work in
their assessment of
the
stock market and its
risks.
Nikolay
Kondratev made the mistake
of criticizing Stalin openly.
For his crimes, he
was
executed
in 1928. He was posthumously cleared of
all charges in 1987, the
year of the most
recent
market crash.
Kondratev
wave theory states there is
a 50- to 60-year business
cycle.
Chaos
Theory:
At
recent finance conferences, a
few researchers have
presented papers on chaos
theory
and
its application to the stock
market. In physics, chaos
theory is a growing field of
study
examining
instances in which apparently random
behavior is, in fact, quite
systematic or
even
deterministic. Scientists apply
this theory to weather
prediction, population
growth
estimates, and
fisheries biology.
As an
example of the later
application, a given volume of
ocean water, left free
from human
interference,
will not necessarily reach an equilibrium
population of the various
species that
inhibit
in it. As fish grow, they
consume the smaller fry (of
their own or different
species) in
increasing
numbers. Fewer young fish
are left to mature; this
couple with the natural
death
of
the older fish, eventually
results in a sudden drastic reduction in
fish population,
causing
dismay
to fisherman and excitement in the
local media. At the same
time, it results in
reduced
predation and food competition by
the surviving fry, so the
population begins to
grow
dramatically, and the cycle
continues. Interactions between
species add complexity
to
the
process.
Investment
analysts have sought a
pattern in stock market
behavior since the origin of
the
exchanges.
Many remains unknown about
how security prices are
determined and chaos
theory
may eventually provide some
partial answers. If the apparent randomness of
security
price
changes can be shown to be nonrandom,
much of the theory of
finance would need
revision.
Chaos
theory sees systematic
behavior amidst apparent
randomness.
Neural
Networks:
A
neural network is a trading
system in which a forecasting
model is trained to find
a
desired
output from past trading
data. By repeatedly cycling
through the data, the
neural net
work
eventually learns the
pattern that produces the
desired output. If the
desired output
remains
elusive, more data is
included until a pattern is
found. Neural networks may
also
include
a feedback mechanism whereby experience
is gained from past
errors.
This
topic is a hot one in the
investment community. National
conferences have been
organized
dealing exclusively with the
topic, and the trade literature
publishes many
articles
on
the topic. A problem with
the concept of a neural
network is that the stock
market is
seldom
deterministic. Situations constantly
change, and what may have
been true a few
years
ago will not necessarily
prevail tomorrow. Financial
academics are especially
leery of
backtests, or
research that tests a
hypothesis using past data.
Mining the data will
almost
70

Investment
Analysis & Portfolio Management
(FIN630)
VU
always
result in some apparent cause and
effect between past events
and stock market
performance.
Research that tests a
hypothesis using a subsequent data is
much more useful.
An
article in the popular press
describes Wall Street's
response to this
criticism:
One
way to get around this
hazard is to build something
called a genetic algorithm
into your
neural
network. A sexy term that
currently causes Wall Street
rocket scientists to
swoon,
genetic
algorithms enable neural nets to adapt to
the future by spawning
schools of baby
nets,
each of which is sent to swim against
the changing flow of data,
Where only the
fittest
survive
to take over the role of the
mother.
No
matter what someone's field
of study, they are
interested in the search for
a better
mousetrap.
Essentially, what all
security analysts seek to do is
find improvements in
their
methodology
for security
selection.
Indicators
of the Witchcraft Variety:
Even
in this era of political correctness,
some indicators are less
worthy than others. If
there
is no
logical connection between
what an indicator measures and
what it purports to
show,
the
indicator probably should
not receive much study
time. A few such indicators
are well
established in
market folklore, and while
they may have no logical
place in the investment
decision-making
process, an awareness of them is
helpful.
The
Super Bowl Indicator:
This
well-known market statistic will
bring a smile to the face of
many investment
professionals
when asked about it.
The super
bowl indicator states
that the stock
market
will advance
the following year if the
super bowl football game is
won by a team from
the
original
National Football League (NFL).
This indicator was correct 28 of 33
times over the
period
1967 through 1999. Such a
percentage might seem
unlikely to have occurred
by
chance.
There
is a statistical problem with
this indicator, however. For
one thing, there are
more
original
NFL teams that there
are teams in the other
conference, the American
Football
Conference
(AFC). The Indianapolis
Clots, Pittsburgh Steelers, and Cleveland
Browns (all
AFC
teams) are original NFL
teams. Couple this
information with the fact
that the stock
market
rises more often than it
falls and the odds favor
the indicator.
Few
people admit to being persuaded by
the super bowl indicator;
most will agree it is
unlikely
that any true cause-and
effect relationship exist
between the game and the
market.
Still,
many professional investment
managers and individual investors
alike subconsciously
root
for the NFL team, just in
case.
Sunspots:
The
public began to associate sunspots
with the stock market
through five works of
William
Stanley
Jevons published between 1862 and 1897.
While the notion of using
the eleven-year
solar
cycle as a forecasting device
has few advocates today, it
was the focus of much
discussion
100 years ago.
Jevons
found that rainfall and
temperature appeared to be related to
solar activity:
The
success of the harvest in
any year certainly depends
upon the weather, especially
that of
the
summer and autumn months.
Now if this weather depends
upon the solar period,
it
71

Investment
Analysis & Portfolio Management
(FIN630)
VU
follows
that the harvest and the
price of grain will depend
more or less the solar
period, and
will go
through periodic fluctuations in periods
of time equal to those of the
sun spots.
The
essence of his history is
that increased sunspot
activity leads to warmer
temperatures
and
more rain, leading to an
improved harvest and a stronger
economy, and finally to
higher
stock
prices. He tested this theory on
English grain prices between 1259 and
1400. Jevons
observed a
ten-to eleven-year cycle in
the money market and
believed this might be, at
least
in
part, because of the solar
influence on crops and the
economy.
Hemline
Indicator:
Like
the super bowl indicator,
the hemline indicator is
market folklore that few
people take
seriously,
but many like to talk
about it. The essence of
the hemline indicator is
this:
As
shorter dresses for women
become the fashion, the
market advances, and vice
versa.
Simultaneously
plotting skirt lengths and
market levels reveals a
remarkable correlation. In
the
1920s the market rose and so
did hemlines. During the
Great Depression, dresses
touched
the ground. There was
gradual rise in the market and in
hemlines through
World
War
II; the rest of the forties and
the fifties peaked in the
go-go days of 1960s
with
miniskirts.
The 1970s saw peasant
dresses and mixiskirts and an economic
recession.
During
the prosperity of the 1980s
things moved back up. During
one stretch in the
early
1990s
the market was nearly flat
for over a year. What was
the dress fashion? Slits on
the
side
of skirts presumably the
marked did not know
what to make of them.
All
these "indicators," of course, are
likely to be purely spurious
correlations. What
economic
cause and effect could
possibly be at work? The
lack of an economic
underpinning
is the reason technical
indicators of this type are
called witchcraft.
Breadth
Indicators:
The
Advance-Decline Line (Breadth of the
Market):
The
advance-decline line measures, on a
cumulative daily basis, the
net difference
between
the
number of stocks advancing in price and
those declining in price for
group of stocks
such
as those on the NYSE. Subtracting
the number of declines from
the number of
advances
produces the net advance for a
given day (which, of course, can be
negative). This
measure
may include thousands of
stocks.
The
advance-decline line, often
referred to as the breadth of
the market, results
from
plotting
a running of these numbers
across time. The line can be
based on daily or
weekly
figures,
which are readily available
from daily newspaper such as
The Wall Street
Journal.
The
advance-decline line is compared to a
stock average, in particular in DJIA in
order to
analyze
any divergence that is, to
determine whether movements in
the market indicator
have
also occurred in the market as a
whole. Technicians believe
that divergence can
signal
that
the trend is about to
change.
The
advance-decline line and the
market averages normally
move together. If both
are
rising
(declining), the overall
market is said to be technically
strong (weak). If the
advance-
decline
line is rising while the
market average is declining,
the decline in the
market
average
should reverse itself. Particular
attention is paid to a divergence between
the two
during
a bull market. If the market
rises while the line weakens
or declines to reverse itself
and
start declining.
72

Investment
Analysis & Portfolio Management
(FIN630)
VU
New
High and Lows:
Part of
the information reported for
the NYSE and other stocks is
the 52-week high and
low
prices
for each stock. Technicians
regard the market as bullish
when a significant number
of
stocks
each day hit 52-week
highs. On the other hand,
technicians see rising
market indexes
and
few stocks hitting new highs
as a troublesome sign.
Volume:
Volume
is an accepted part of technical
analysis. High trading
volume, other things
being
equal,
is generally regarded as a bullish
sign. Heavy volume combined
with rising prices is
even
more bullish.
Sentiment
Indicators:
Short-Interest
Ratio:
The
short interest for a
security is the number of
shares that have been
sold short but not
yet
bought
back. The short interest
ratio can be defined relative to
shares outstanding or
average
daily
volume, as in;
Short
interest ratio = Total
shares sold short / Average
daily trading volume
The
NYSE, Amex and NASDAQ report
the short interest monthly
for each stock.
The
NYSE
and Amex indicate those securities
where arbitrage or hedging
may be important, but
the
significant of these activities
cannot be determined. For
investors interested in th
short
interest,
each month. The Wall Street
Journal reports NYSE and
Amex issues for which
a
short
interest position of at least 100,000
shares existed or for which
a short position change
of 50,000
shares occurred from the
previous month. A list of stocks
with the largest
short
interest
ratios broken down by
exchange can be found at www.trading-ideas.com
In
effect, the ratio indicates
the number of days necessary to
"work off" the current
short
interest.
It is considered to be a measure of investor
sentiment, and many investors
continue
to
refer to it.
Investors
sell short when they
expect prices to decline; therefore, it
would appear the
higher
the
short interest, the more
investors are expecting a
decline. A large short
interest position
for
an individual stock should
indicate strong negative
sentiments against a stock.
Many
technical analysts interpret
this ratio in the opposite
manner as a contrarian
indicator
a
high short interest ratio is
taken as bullish sign,
because the large number of
shares sold
short
represents a large number o
shares that must be repurchased in
order to close out
the
short
sales. In effect, the short
seller must repurchase regardless of
whether or not his or
her
expectations
were correct. The larger
the short interest ratio,
the larger the potential
demand
that
is indicated. Therefore, an increase in
the ratio indicates more
"pent-up" demand for
the
shares
that have been
shorted.
The
short interest ratio for a
given method should be
interrupted in relation to
historical
boundaries,
which historically were in
the range of 1 to 2 for the
NYSE. The problem is
that
the
boundaries keep changing. In
the 1960s, 1970s and 1980s,
a ratio of 2 was bullish.
More
recently,
the ratio has been in
the 3 to 6 range regardless of the
market.
73

Investment
Analysis & Portfolio Management
(FIN630)
VU
Mutual
Fund Liquidity:
Several
indicators are based on the
theory of contrary investing.
The idea is to trade
contrary
to most investors, who
supposedly almost always
lose. This is an old idea on
Wall
Street, and
over the year technicians
have developed several
measures designed to
capitalize
on
this concept. As mentioned above,
the short interest is often
used as a contrarian
indicator,
with high short levels in a
stock viewed as being overly
pessimistic.
Mutual
fund liquidity can be used as a
contrary opinion technique.
Under this scenario,
mutual
funds are viewed I a manner
similar to odd - lotters, that
is, they are presumed to
act
incorrectly
before a market turning
point. Therefore, when
mutual fund liquidity is
low
because
the funds are fully
invested, contrarian believes
that the market is at, or
near a peak.
The
funds should be building up
cash (liquidity); instead, they
are extremely bullish and
are
fully
invested. Conversely, when
funds hold large liquid
reserves it suggests that
they are
bearish.
Contrarians would consider
this a good time to buy,
because the market may be
at,
or
near, its low
point.
The
Opinions of Investment Advisory
Newsletter:
Investors'
intelligence an investment advisory
service, samples weekly the
opinions of
about
150 investments advisory services and
calculates an index of investments
service
opinions.
It has found that on average,
these services are most bearish at
the market bottom
and
last bearish at the market
top. This index, published
since 1963, is now
available
weekly
and is widely quoted in the
investing community.
The
"bearish sentiment index" is
calculated as the ratio of
advisory services that are
bearish
to
the total number with an
opinion. When this index
approaches 55 or 60 percent,
this
would
indicate a bearish indicate a bearish
attitude on the part of
investment advisory
services. As
this ratio approaches 20
percent, the opposite occurs.
Thus, a contrarian
should
react in
the opposite direction of the
sentiment this ratio is
exhibiting. As the ratio
nears 60
percent,
the contrarian becomes
bullish, because a majority of
the investment
advisory
services
are bearish, and around 20 percent
the contrarian becomes bearish,
because most of
the
investment advisory services are
not bearish.
The
reason for this seeming
contradiction to logic that
investment advisory services
are
wrong
at the extremes is attributed to
the fact these services tend
to follow trends rather
than
forecast
them. Thus, they are
reporting and reacting to what
has happened rather
than
concentrating
on anticipating what is likely to
happen.
The
Future of Technical Analysis:
Although
there is much in finance
that we do not completely
understand, technical
analysis
has
persisted from more than 100
years, and it is not likely to
disappear from the
investment
scene
anytime soon. Improved
quantitative methods coupled
with improved
behaviorist
Werner
De Bondt, for instance,
recently reported substantial
evidence that the
public
expects
the continuation of past
price trends. That is,
they are bullish in bull
markets and
pessimistic
in bear markets.
Technical
analysis is a controversial topic.
While it currently has
little standing in
the
academic
literature, a great deal about price
movements has yet to be
discovered.
74

Investment
Analysis & Portfolio Management
(FIN630)
VU
Technical
analysts like to use charts.
They believe that supply and
demand determines
security
prices, that changes in supply and demand
cause prices to change, and that
charts
can be
used to predict changes in
supply and demand and in investor
behavior. Popular
types
of charts are the line
chart, bar chart point and
figure chart, and the
candlestick chart.
Technical
indicators are measure of
economic and non-economic activity
that purportedly
have
a relationship to subsequent market
behavior. Some of these
indicators, such as
the
mutual
fund cash position or short
interest ratio, have
economic underpinnings, while
others
(the
super bowl or hemline indicators) do
not. All are part of market
folklore.
Fibonacci
numbers are inexplicably
common in nature. Some people
believe that the
Fibonacci
series is helpful in predicting
changes in security trading
patterns. Popular
areas
of
research today among
technical analysts include
chaos theory (the search
for patterns in
randomness) and
neural networks (the notion
that computer algorithms can be
taught to look
for
optimum patterns).
Conclusions
about Technical Analysis:
Technical
analysis often appeals to those
who are beginning a study of
investments, because
it is
easy to believe tat stock
prices form repeatable patterns
over time or that
certain
indicators
should be related to future
market price movements. Most
people who look at a
chart
of a particular stock will immediately
see what they believe to be
patterns in the price
changes
and clear evidence of trends
that should have been
obvious to anyone studying
it.
On
the one hand, academicians are
highly skeptical of technical
analysis, to say the
least.
Most
academics discussions at the college
level dismiss, or seriously disparage,
this
concept.
A primary reason is that
thorough tests of technical
analysis techniques
typically
fail
to confirm their value,
given all costs and
considering an alternative, such as a
buy-and-
hold
strategy.
In
addition to these reasons,
other troubling features of
technical analysis remain.
First,
several
interpretations of each technical
tool and chart pattern are
not only possible but
usual.
One or more of the
interpreters will be correct (more or
less), but it is
virtually
impossible
to know beforehand who these
will be. After the fact, we
will know which
indicator
or chart or whose interpretations was
correct, but only those
investors who used
that
particular information will benefit.
Tools such as the Dow
Theory are well known
for
their
multiple interpretations by various
observers who disagree over
how the theory is to
be
interpreted.
75
Table of Contents:
- INTRODUCTION OF INVESTMENT
- THE ROLE OF THE CAPITAL MARKETS
- THE NASDAQ STOCK MARKET
- Blue Chip Stocks, Income Stock, Cyclical Stocks, Defensive Stocks
- MARKET MECHANICS
- FUNDAMENTAL STOCK ANALYSIS
- BEYOND FUNDAMENTAL ANALYSIS
- What is Technical Analysis
- Indicators with Economic Justification
- Dow Theory
- VALUATION PHILOSOPHIES
- Ratio Analysis
- INVESTMENT RATIOS
- Bottom-Up, Top-Down Approach to Fundamental Analysis
- The Industry Life Cycle
- COMPANY ANALYSIS
- Analyzing a Companys Profitability
- Objective of Financial Statements
- RESEARCH PHILOSPHY
- What Is An Investment Company
- Exchange-Traded Funds (ETFs)
- COMMON STOCK: ANALYSIS AND STRATEGY
- THE EFFICIENT MARKET HYPOTHESIS (EMH)
- Behavioral Finance
- MARKET INDEXES
- POPULAR INDEXES
- BOND PRINCIPLES
- BOND PRICING AND RETURNS
- Accrued Interest
- BOND RISKS
- UNDERSTANDING RISK AND RETURN
- TYPES & SOURCES OF RISK
- Measuring Risk
- ANALYZING PORTFOLIO RISK
- Building a Portfolio Using Markowitz Principles
- Capital Market Theory: Assumptions, The Separation Theorem
- Risk-Free Asset, Estimating the SML
- Formulate an Appropriate Investment Policy
- EVALUATION OF INVESTMENT PERFORMANCE
- THE ROLE OF DERIVATIVE ASSETS
- THE FUTURES MARKET
- Using Futures Contracts: Hedgers
- Financial Futures: Short Hedges, Long Hedges
- Risk Management, Risk Transfer, Financial Leverage
- OVERVIEW