 |
Depreciation Accounting Policies |
| << First-in-First - out (FIFO), Last-in-First-Out (LIFO) |
| Accelerated-Depreciation method >> |
Financial
Statement Analysis-FIN621
VU
Lesson-21
NOTES
TO FINANCIAL STATEMENTS
(Continued)
Depreciation
Accounting Policies.
Depreciation
is the expired or used portion of a
fixed asset during an
accounting period.
This
is taken into account to achieve the
matching principle of matching
revenues earned during
an
accounting
period with the expenses
incurred during that period.
Since plant assets have useful
life
spreading
over a number of accounting periods, the
portion used in one accounting
period is charged to
Income
Statement of that accounting
period in the form of Depreciation
Expense.
Land
is recorded at cost, other fixed
assets are recorded at Book
Value i.e. cost
less
accumulated
depreciation. For this,
separate Depreciation Expense
and Accumulated
Depreciation
Accounts
for different plant assets
are maintained. It must also
be noted that depreciation is a
process of
cost
allocation and not a process of
valuation as such.
Computing
Depreciation
Different
methods are available for
computing depreciation of fixed
assets. Different
methods
can be used for different
assets. However, comparison among firms
with different
depreciation
methods
becomes difficult because of the
fact that each firm
uses different methods for
calculating
depreciation,
which ultimately affect its
net income and balance sheet.
Methods of
Computing Depreciation
Straight-line
method: In
this, the depreciation expenses
are spread evenly
over
i)
periods.
Assume that a plant asset is
acquired for Rs.17, 000. It
is estimated that its
useful
life is five years and
residual value (salvage value) at the end
of five years is
Rs.2,
000.
Depreciation
is a systematic allocation of the cost of
a depreciable asset to expense over
its useful life. It
is a
process of charging the cost of
fixed asset to profit &
loss account.
Fixed
Assets are
those assets which
are:
· Of
long life
· To be
used in the business to generate
revenue
· Not
bought with the main purpose
of resale.
Fixed
assets are also called
"Depreciable Assets"
When
an expense is incurred, it is charged to
profit & loss account of the
same accounting period
in
which
it has incurred. Fixed
assets are used for
longer period of time. Now,
the question is how to
charge
a fixed asset to profit &
loss account. For this
purpose, estimated life of the
asset is determined.
Estimated
useful life is the number of years in
which a fixed asset is expected to be
used efficiently. It is
the
life for which a machine is estimated to
provide more benefit than the
cost to run it. Then,
total cost
of the
asset is divided by total number of
estimated years. The value, so
determined, is called
`depreciation
for the year' and is charged to
profit & loss account. The
same amount is deducted from
total
cost of fixed asset in the
financial year in which
depreciation is charged. The net amount
(after
deducting
depreciation) is called `Written
down Value'.
WDV =
Original cost of fixed asset
Accumulated Depreciation
79

Financial
Statement Analysis-FIN621
VU
Accumulated
Depreciation is the depreciation that
has been charged on a
particular asset from the
time
of
purchase of the asset to the present
time. This is the amount
that has been charged to
profit and loss
account
from the year of purchase to the
present year.
Depreciation
accumulated over the years is called
accumulated
depreciation.
Useful
Life
·
Useful Life or Economic
Life is the time period for
machine is expected to operate efficiently.
· It is the
life for which a machine is estimated to
provide more benefit than the
cost to run it.
Grouping
of Fixed Assets
Major
groups of Fixed Assets:
· Land
· Building
· Plant
and Machinery
· Furniture
and Fixtures
· Office
Equipment
· Vehicles
No
depreciation is charged for
`Land'. In case of `Leased
Asset/Lease Hold Land' the amount
paid for it
is
charged over the life of the
lease and is called Amortization.
Journal
entries for recording
Depreciation
Purchase
of fixed asset:
Debit:
Relevant
asset account
Credit:
Cash,
Bank or Payable Account
For
recording of depreciation, following
two heads of accounts are
used:
· Depreciation
Expense Account
· Accumulated
Depreciation Account
Depreciation
expense account contains the depreciation
of the current year. Accumulated
depreciation
contains the
depreciation of the asset from the
financial year in which it
was bought up to the
present
financial
year. . Depreciation of the following
years in which asset was
used is added up in this
account.
In
other words, this head of
account shows the cost of
usage of the asset up to the current
year.
Depreciation
account is charged to profit &
loss account under the heading of
Administrative Expenses.
In the
balance sheet, fixed assets
are presented at written
down value i.e.
WDV =
Actual cost of fixed asset
Accumulated Depreciation.
Journal
entry for the depreciation is
given below:
Debit:
Depreciation
Expenses Account
Credit:
Accumulated
Depreciation Account
Presentation
of Depreciation
Charging
depreciation to any head in
profit & loss account
depends upon the nature of work
performed
by the
asset. Consider an organization has
purchased computers. If computers
are being used by the
management,
this means that
administrative work is done by computers.
So, depreciation of
computers
will
be charged to Administrative Expenses. On
the other hand, if machines working in
the factory are
80

Financial
Statement Analysis-FIN621
VU
computerized.
The value of depreciation of the
computers attached with the
machines will be charged
to
cost
of goods sold. The reason
being, the computers are the
part of manufacturing process
&
depreciation
of computers will be charged to the
cost of production. Again consider the
selling
department of the
business is very large.
Depreciation of computers used in
selling department will be
charged
to selling expenses.
You
can see that computer is a
single asset and its
depreciation is charged in three
different heads
depending
upon the nature of work done by the
computer.
Depreciation
for the year is charged
to:
i.
Cost
of Goods Sold
ii.
Administrative
Expenses
iii.
Selling
Expenses
In
balance sheet Fixed Assets
are shown at Cost less
Accumulated Depreciation i.e.
written Down Value
(WDV).
Methods
of calculating Depreciation
There
are several
methods for calculating
depreciation. At this stage, we
will discuss only two of
them
namely:
· Straight
line method or Original cost method or
Fixed installment method
· Reducing
balance method or Diminishing balance
method or written down
method.
Straight
Line Method
Under
this method, a fixed amount is
calculated by a formula. That
fixed amount is charged every
year
irrespective
of the written down value of the
asset. The formula for
calculating the depreciation is
given
below:
Depreciation
= (cost Residual value) / Expected
useful life of the
asset
Residual
value is the
cost of the asset after the
expiry of its useful
life.
Under
this method, at the expiry of asset's
useful life, its written
down value will become
zero. Consider
the
following example:
·
Cost
of the Asset
=
Rs.100,000
·
Life
of the Asset
= 5
years
·
Annual
Depreciation
= 20 % of
cost or Rs.20,000
Written
down value method
·
Cost
of the Asset
= Rs.
100,000
·
Annual
Depreciation
=
20%
Year
1 Depreciation
= 20 % of
100,000
=
20,000
Year
1 WDV
=
100,000 20,000
=
80,000
Year
2 Depreciation
= 20 % of
80,000
=
16,000
Year
2 WDV
=
80,000 16,000
=
64,000
Illustration:
Cost
of an asset:
Rs.
120,000
Residual
value: Rs. 20,000
Expected
life: Rs. 5 years
81
Financial
Statement Analysis-FIN621
VU
Calculate
depreciation and the written
down value of the asset for
five years.
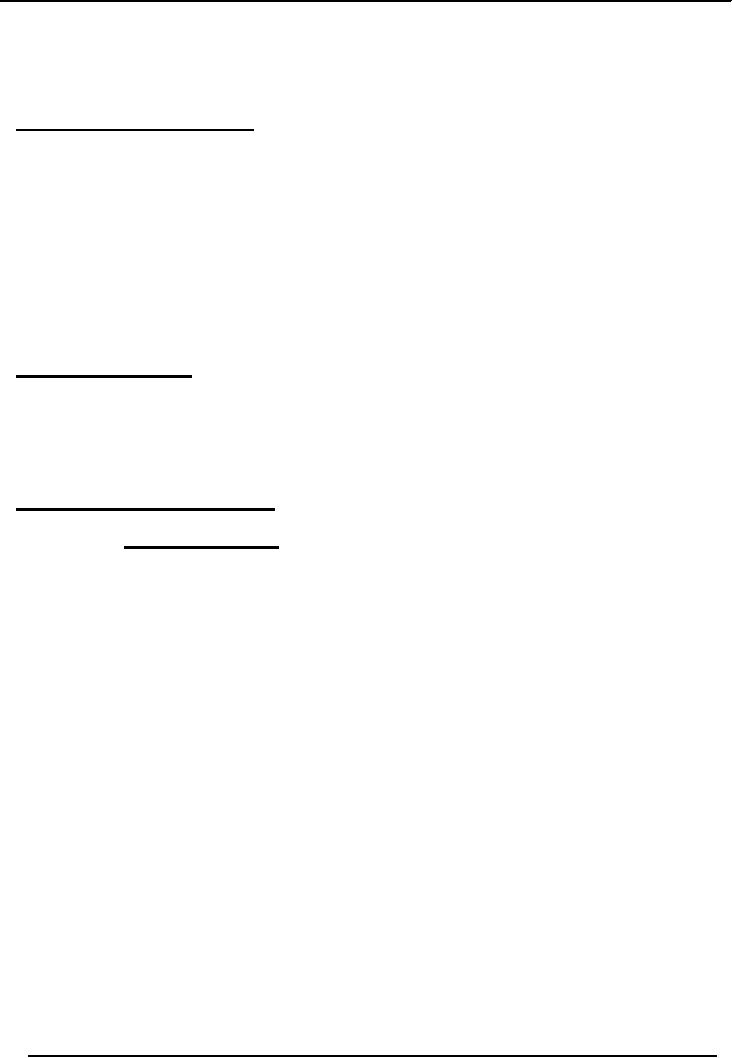
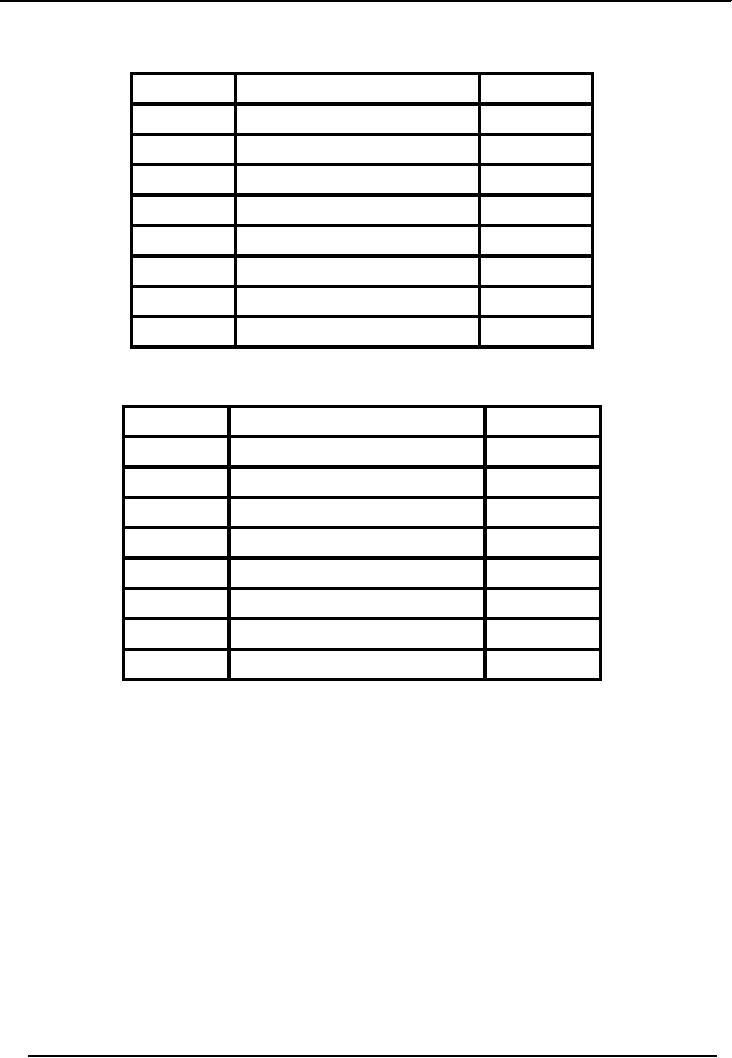
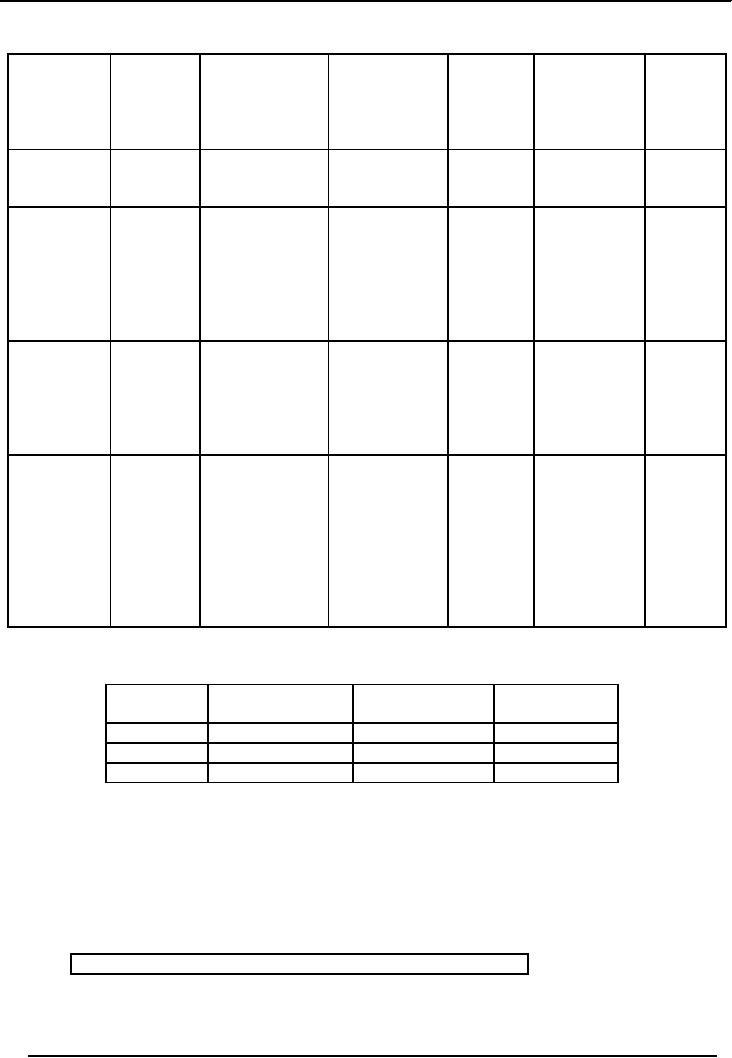
Solution
Straight
line method
Depreciation
= (120,000 20,000) / 5 = Rs.
20,000
Particulars
Depreciation
Written
(Rs)
Down
Value
(Rs.)
100,000
Depreciable
cost
Dep.
Of the 1st year
80,000
(20,000)
Dep.
Of the 2nd year
60,000
(20,000)
Dep.
Of the 3rd year
40,000
(20,000)
Dep.
Of the 4th year
20,000
(20,000)
Dep.
Of the 5th year
0
(20,000)
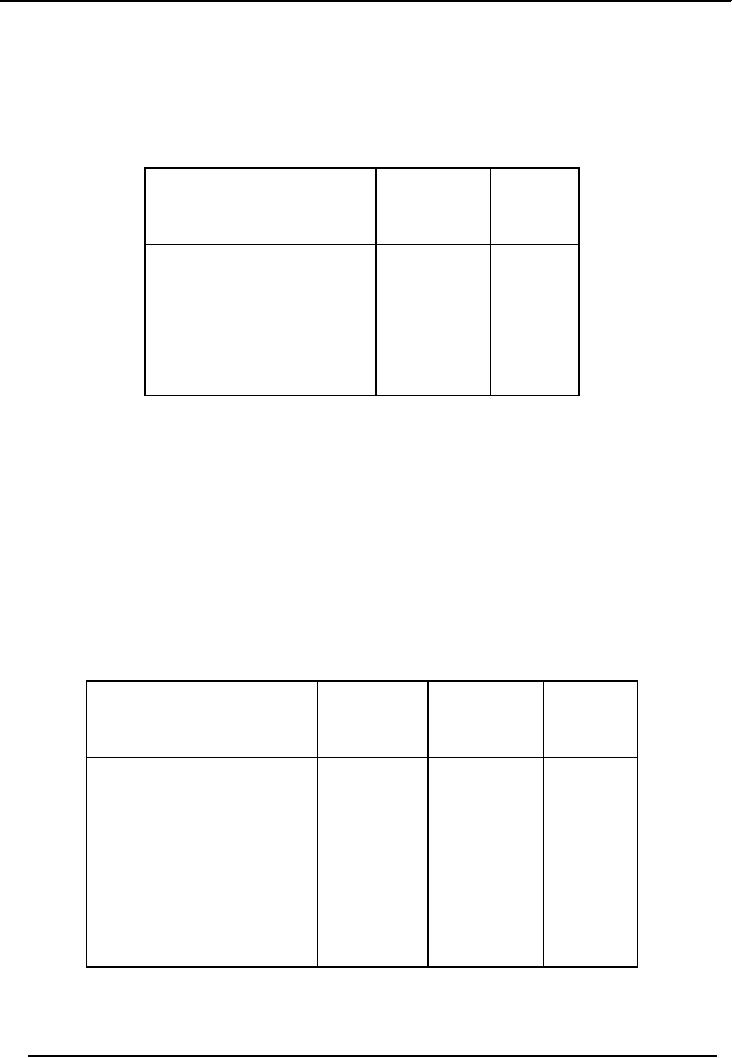
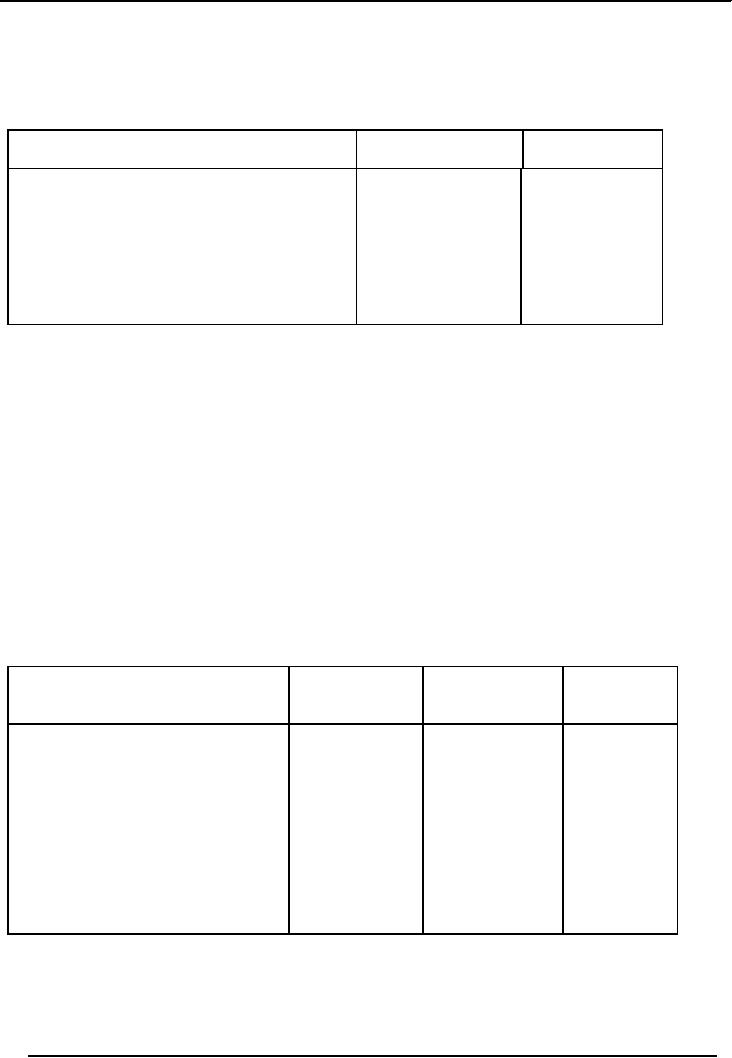
Reducing
Balance Method
Under
this method, depreciation is
calculated on written down
value. In the first year,
depreciation is
calculated on
cost. Afterwards written
down value is calculated by
deducting accumulated depreciation
from
the cost of that asset(cost
accumulated depreciation) and depreciation is
charged on that value.
In
this
method, the value of asset never
becomes zero. Consider the following
example:
Cost
of an asset
Rs.
100,000
Expected
life
Rs. 5
years
Depreciation
rate
20%
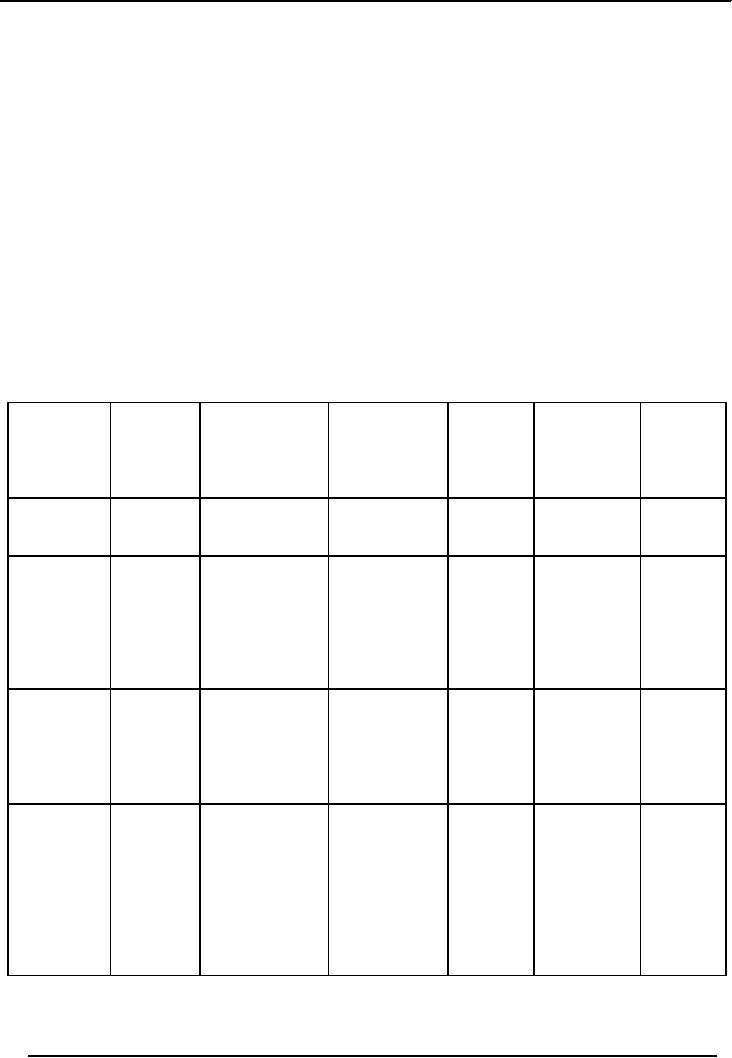
Solution
Particulars
Depreciation
Accumulated
Written
(Rs)
Depreciation
Down
(Rs.)
Value
(Rs.)
100,000
Depreciable
cost
Dep.
Of the 1st year
80,000
20,000
20,000
100,000
x 20%
Dep.
Of the 2nd year
64,000
36,000
16,000
80,000
x 20%
Dep.
Of the 3rd year
51,200
48,800
12,800
64,000
x 20%
Dep.
Of the 4th year
40,960
59,040
10,240
51,200
x 20%
Dep.
Of the 5th year
32,768
67,232
8,192
40,960
x 20%
You
see, at the end of five years, WDV of the
asset is Rs. 32,768, not
zero. But in case of
straight line
method, the
WDV, after five years
was zero. So, in the opinion
of some people, reducing
balance
82
Financial
Statement Analysis-FIN621
VU
method is
better than that of straight
line method, but both
methods are effective. It is the
management
that
has to decide, which method is best
suited to their business.
Once
an asset has been fully
depreciated, no more depreciation should be recorded
on it, even though
the
property may be in good
condition and may be in use.
The objective of depreciation is to
spread the
cost
of an asset over the periods of its
usefulness; in no case can
depreciation be greater than the
amount
paid
for the asset. When a fully
depreciated asset is in use beyond the
original estimate of useful
life, the
asset
account and the accumulated depreciation
account should remain in the
accounting records
without
further entries until the asset is
retired.
Reducing
Balance Method
In
this method, depreciation is calculated
on written down value. In the
first year, depreciation
is
calculated on
cost. Afterwards written
down value is calculated by
deducting accumulated depreciation
from
the cost of that asset (cost
accumulated depreciation) and depreciation is
charged on that
value.
Cost of
Asset Price at which
the asset was initially
recorded
Written
Down Value / Book Value
Cost minus Accumulated
Depreciation.
In
reducing balance method, a formula is
used for calculation the
depreciation rate i.e.
Rate
= 1
n RV /
C
Where:
"RV" =
Residual Value
"C" =
Cost
"n" =
Life of Asset
Calculate
the rate if:
Cost
=
100,000
Residual
Value (RV)
=
20,000
Life
= 3
years
Rate
=
13
20000/100000
= 42%
Year
1
Cost
100,000
Depreciation
100,000 x 42%
(42,000)
WDV
(Closing Balance)
58,000
Year
2
WDV
(Opening Balance)
58,000
Depreciation
58,000
x 42%
(24,360)
WDV
(Closing Balance)
33,640
Year
3
WDV
(Opening Balance)
33,640
Depreciation
33,640
x 42%
(14,128)
WDV
(Closing Balance)
19,511
Disposal
of Asset
83
Financial
Statement Analysis-FIN621
VU
Cost
of Asset
=
100,000
Life
of the Asset
= 5
Years
Depreciation
Method
=
Straight Line
Residual
Value
=
Rs.10000
Sale
Price after Five
Years
=
Rs.15000
Depreciation
per year = (100000-10000) / 5
= Rs.5000 per
year
Total
Depreciation in Five
Years
=
18,000 x 5
=
90,000
Book
Value after Five
Years
=
100,000- 90,000
=
10,000
Profit
on Disposal
=
15,000 10,000
=
Rs.5000
Recording
of Disposal
Debit
Fixed
Asset Disposal A/c
100,000
Credit
Fixed
Asset Cost A/c
100,000
(With
the cost of asset)
Debit
Accumulated
Dep. A/c
90,000
Credit
Fixed
Asset Disposal A/c
90,000
(With
the depreciation accumulated to date)
Debit
Cash
/ Bank / Receivable
A/c
15,000
Credit
Fixed
Asset Disposal A/c
15,000
(With
the price at which asset is
sold)
[Note:
one group to appear at a
time]
Disposal
of Asset Account
Fixed
Asset Disposal Account
Debit
Credit
Cost
Account
100,000
Acc.
Dep. Account
90,000
Cash
/ Bank
15,000
P & L
Account
5000
(
Balancing Figure)
Total
105000
Total
105000
Policy
for Depreciation
84

Financial
Statement Analysis-FIN621
VU
The
management of the business selects the
policy for charging
depreciation. There is no law
binding on
the
management. The management is
free to choose method of depreciation and
policy of charging
depreciation.
Normally two policies are
commonly used:
· Depreciation
on the basis of use
· In the
year of purchase, full
year's depreciation is charged; where as,
in the year of sale no
depreciation
is charged.
Now
it is up to the management to decide, what method
and what policy is better
and effective for
their
business.
Disposal
of Fixed Asset
When
depreciable asset is disposed off at
any time during the
financial year, an entry
should be made to
give
effect of the disposal. Since, the residual
value of asset is only estimated; it is
common for asset to
be
sold at price that differs
from its book value at the
date of disposal. When asset is
sold, any profit or
loss
is computed by comparing book value
with the amount received
from sale. As you know,
book
value
is obtained by deducting accumulated
depreciation from original
cost of the asset. A sale
price in
excess
of the book value produces
profit; a sale price below
the book value produces
loss. This profit or
loss
should be shown in the profit & loss
account.
Entries
for Recording Disposal
Debit
Fixed
Asset Disposal A/c
Credit
Fixed
Asset Cost A/c
(With
the cost of asset)
Debit
Accumulated
Dep. A/c
Credit
Fixed
Asset Disposal A/c
(With
the depreciation accumulated to date)
Debit
Cash
/ Bank / Receivable
A/c
Credit
Fixed
Asset Disposal A/c
(With
the price at which asset is
sold)
Example
·
An
asset is purchased for Rs.
500,000 on Nov. 01,
2001.
·
Depreciation
rate is 10% p.a.
·
The
Asset is sold on Apr. 30,
2004.
·
Financial
Year is July 1 to June
30
Question
· Calculate
the WDV For both
policies
85
Financial
Statement Analysis-FIN621
VU
Depreciation is
charged on the Basis of
Use
Year
On the
Basis of Use
Rs.
1-11-2001
Cost
500,000
2001-2002
Dep.
500,000 x 10% x 8 / 12
(33,333)
30-6-2002
WDV
466,667
2002-2003
Dep.
466,666 x 10%
(46,667)
30-6-2003
WDV
420,000
2003-2004
Dep.
420,000 x 10% x 10 / 12
(35,000)
30-4-2004
WDV
385,000
Full
Depreciation in the Year of
Purchase
Year
Full
Dep. in year of
Purchase
Rs.
1-11-2001
Cost
500,000
2001-2002
Dep.
500,000 x 10%
(50,000)
30-6-2002
WDV
450,000
2002-2003
Dep.
450,000 x 10%
(45,000)
30-6-2003
WDV
405,000
2003-2004
Dep.
00 in the year of sale
00
30-6-2004
WDV
405,000
Contents
of Fixed Assets Register
·
Different record for each
class of assets
· Date of
purchase
·
Detailed particulars of
asset
·
Location of asset
· Record of
depreciation
Illustration
Cost
of asset
Rs.
200,000
Life
of the asset
5
years
Depreciation
method
Straight
line
Residual
value
Rs.
20,000
Sale
price after 5 years
30,000
Calculate
profit/Loss on the sale of the
asset?
86
Financial
Statement Analysis-FIN621
VU
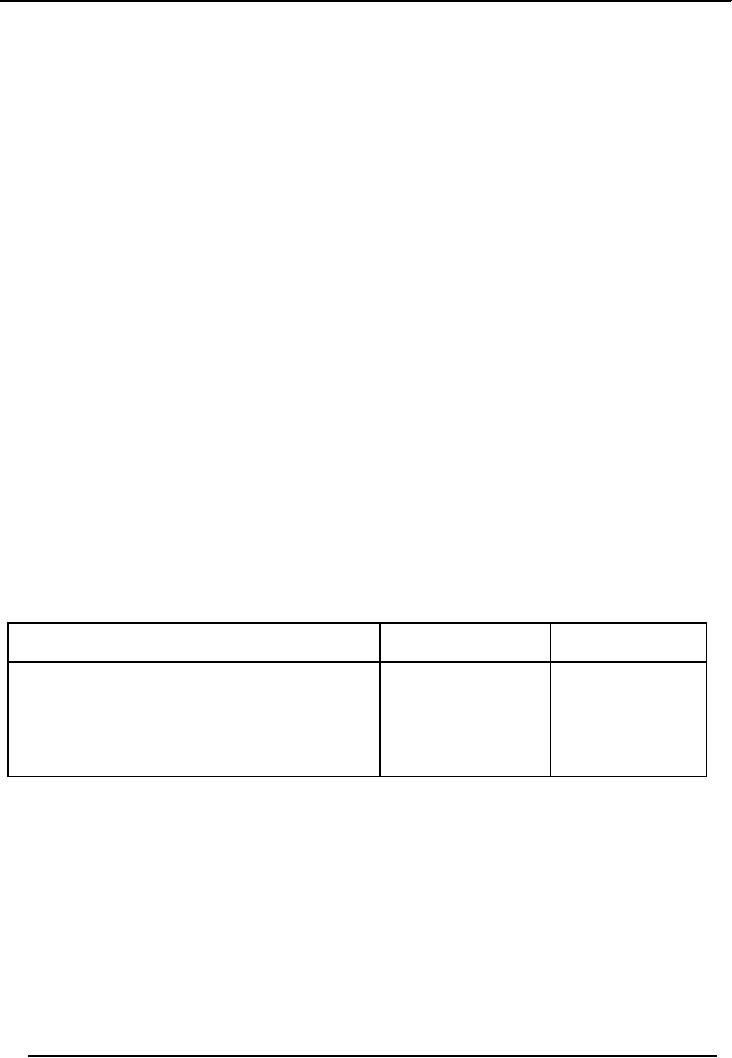
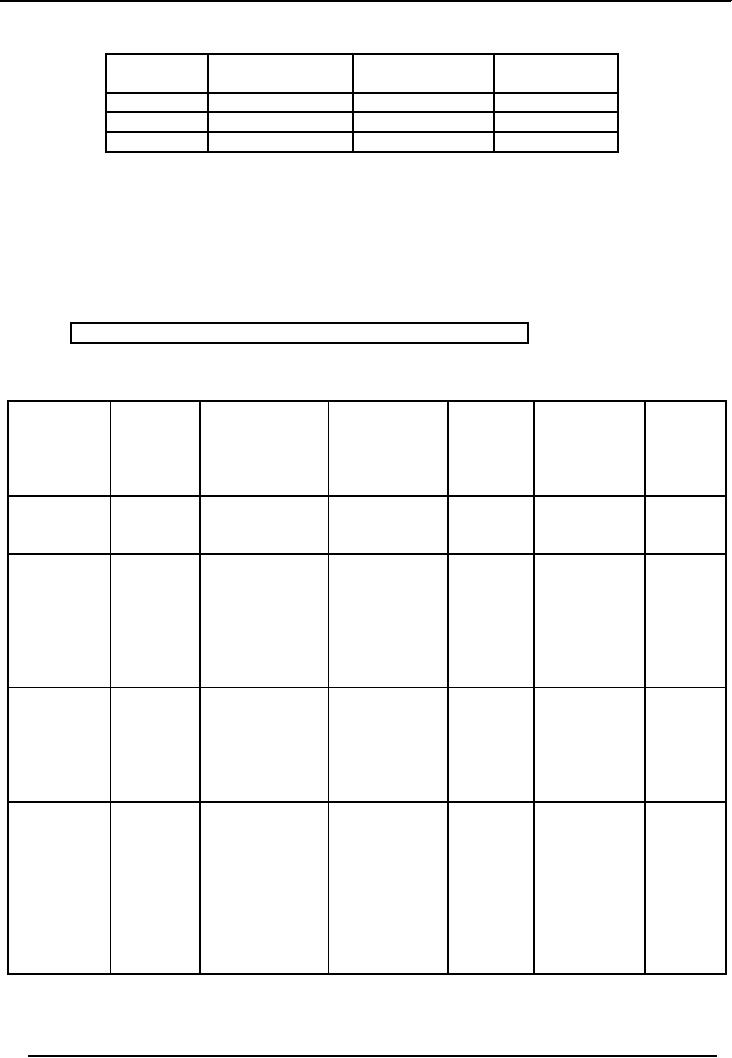
Solution
Written
down value = 200,000
20,000 = 180,000
Depreciation/year
= 180,000/5 = 36,000 (Straight
line method)
Particulars
Depreciation
(Rs)
Written
Down
Value
(Rs.)
200,000
Depreciable
cost
Dep.
Of the 1st year
164,000
(36,000)
Dep.
Of the 2nd year
128,000
(36,000)
Dep.
Of the 3rd year
92,000
(36,000)
Dep.
Of the 4th year
56,000
(36,000)
Dep.
Of the 5th year
20,000
(36,000)
Book
value after five
years
Rs.
20,000
Sale
price
Rs.
30,000
Profit
on sale
Rs.
10,000 (30,000
20,000)
Same
illustration is solved by reducing
balance method
Cost
of asset
Rs.
200,000
Residual
value
Rs.
20,000
Estimated
useful life
5
years
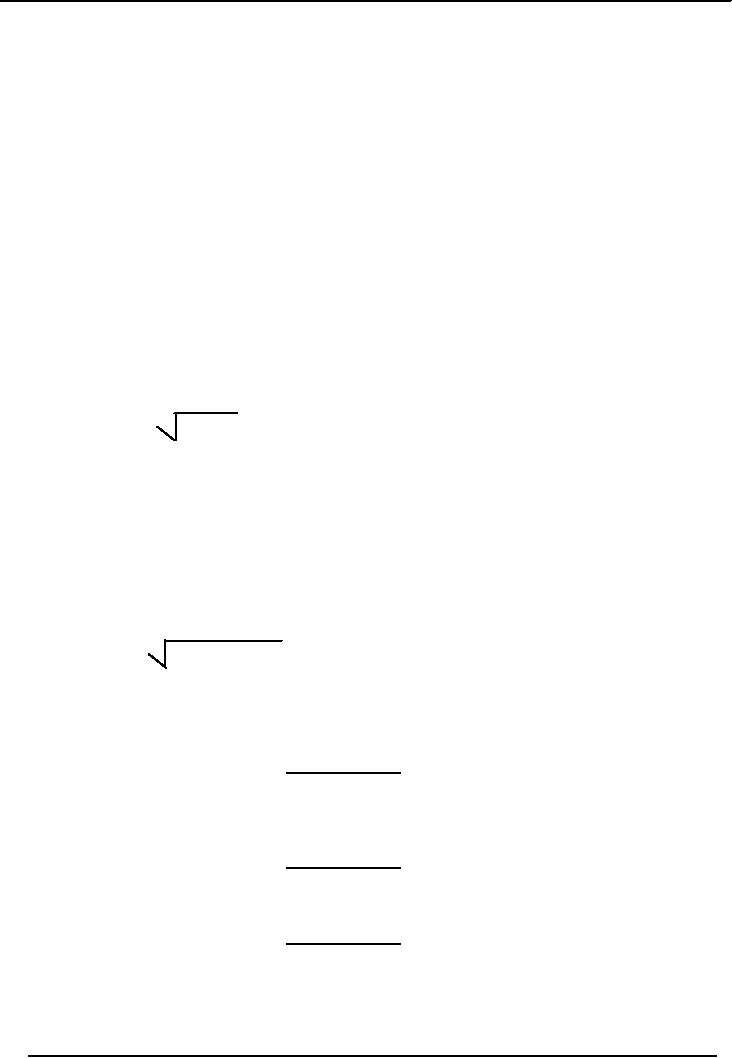
Calculation
of depreciation rate
____
n
Depreciation
Rate = 1 √Rv/c
_____________
5
= 1 - √20,000/200,000
=
37%
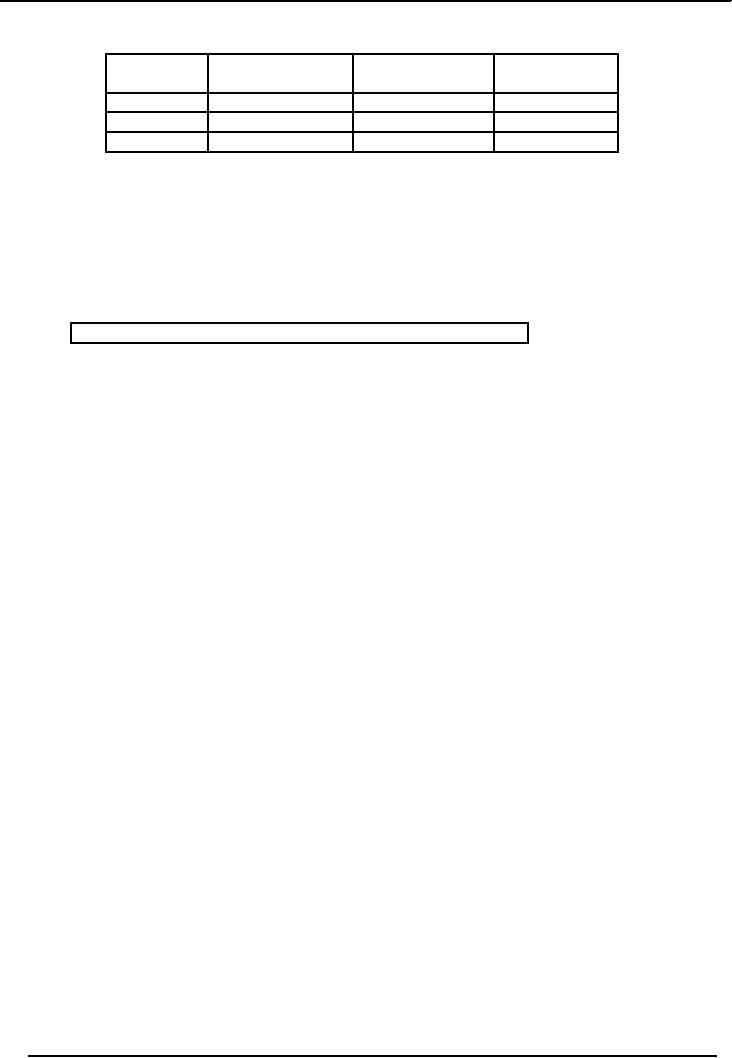
Allocation
of depreciation is given
below:
Particulars
Depreciation
(Rs)
Accumulated
Written
Down
Depreciation
Value
(Rs.)
(Rs.)
200,000
Depreciable
cost
Dep.
Of the 1st year
126,000
74,000
74,000
200,000
x 37%
Dep.
Of the 2nd year
79,380
120,620
46,620
126,000
x 37%
Dep.
Of the 3rd year
50,009
149,991
29,371
79,380
x 37%
Dep.
Of the 4th year
31,506
168,494
18,503
50,009
x 37%
Dep.
Of the 5th year
19,849
180,151
11,657
31,506
x 37%
Book
value after five
years
Rs.
19,849
Sale
price
Rs.
30,000
Profit
on sale
Rs.
10,151 (30,000
19,849)
87
Financial
Statement Analysis-FIN621
VU
If an
asset is not completed at that
time when balance sheet is
prepared, all costs incurred on
that asset
up to the
balance sheet date are
transferred to an account called Capital
Work in Progress
Account.
This
account is shown separately in the balance
sheet below the fixed asset.
Capital work in
progress
account
contains all expenses incurred on the
asset until it is converted
into working condition. All
these
expenses
will become part of the cost
of that asset. When an asset
is completed and it is ready to
work,
all
costs in the capital work in
progress account will transfer to
the relevant asset account
through the
following
entry:
Debit:
Relevant
asset account
Credit:
Capital
work in progress
account
Illustration
# 1
A machine is
purchased for Rs. 400,000.
Its useful life is estimated to be
five years. Its residual
value is
Rs.
25,000. After four years, it
was sold for Rs.
40,000. For the purpose of
WDV, its depreciation rate
is
40%.
You
are required to show calculation of
depreciation for four years.
Also calculate profit or loss
on
disposal.
Solution
Calculation
of depreciation and profit & loss on
the basis of straight line
method:
Depreciation/year
= (400,000 25,000)/5 = 75,000
(Straight line
method)
As,
machine was sold after four
years but its useful
life was estimated for five
years, when we calculate
depreciation
of the asset under straight
line method, we will divide
its WDV over five years,
not on four
years.
Particulars
Depreciation
(Rs)
Written
Down Value
(Rs.)
375,000
Depreciable
cost
Dep.
Of the 1st year
300,000
(75,000)
Dep.
Of the 2nd year
225,000
(75,000)
Dep.
Of the 3rd year
150,000
(75,000)
Dep.
Of the 4th year
75,000
(75,000)
Book
value after four
years
Rs.
75,000
Sale
price
Rs.
40,000
Profit/(loss)
on sale
Rs.
(35,000) i-e.(40,000
75,000)
88
Financial
Statement Analysis-FIN621
VU
Calculation
of depreciation and profit & loss on
the basis of reducing
balance method:
Depreciation
rate = 40%
Particulars
Depreciation
Accumulated
Written
(Rs)
Depreciation
Down
(Rs.)
Value
(Rs.)
400,000
Depreciable
cost
Dep.
Of the 1st year
240,000
160,000
160,000
400,000
x 40%
Dep.
Of the 2nd year
144,000
256,000
96,000
240,000
x 40%
Dep.
Of the 3rd year
86,400
313,600
57,600
144,000
x 40%
Dep.
Of the 4th year
51,840
348,160
34,560
86,400
x 40%
Book
value after four
years
Rs.
51,840
Sale
price
Rs.
40,000
Profit/
(loss) on sale
Rs.
(11,840) i-e. (40,000
51,840)
Illustration
# 2
Following
information of machinery account is
available in Year
2004:
· Machine
# 1 is purchased on September 1, 2000
for Rs. 100,000
· Machine
# 2 is purchased on January 31, 2002
for Rs. 200,000
· Machine
# 3 is purchased on July 1, 2003
for Rs. 50,000
· Machine
# 1 is disposed on March 31,
2004
Depreciation
is charged @ 25% reducing
balance method. Financial year is
closed on June 30
every
year.
Show
the calculation of depreciation on
machinery for four years
using the following
policies:
· Depreciation
is charged on the basis of
use
· Full
depreciation is charged in the year of
purchase and no depreciation is charged
in the year
of
disposal.
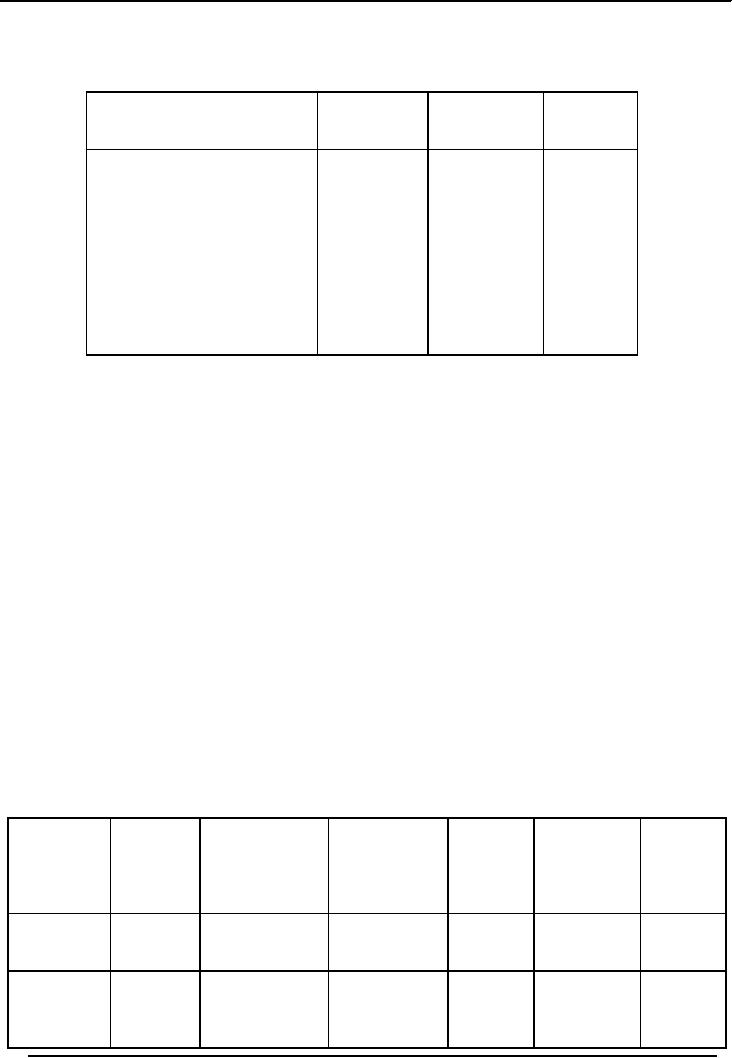
Solution
Depreciation on
the basis of use
Depreciation
Accumulated
Total
Written
Total
Date
Purchase
(Rs.)
depreciation
Accum.
Down
Value Written
of
(Rs.)
Dep.
(Rs.)
Down
machine
Value
(Rs.)
(Rs.)
01-09-2000
100,000
Machine
# 1
Machine
# 1
20,833
Machine
# 1 79,167
100,000
x 25%
20,833
79,167
x10/12=20,833
238,542
61,458
Machine
# 1
Machine
# 1
Machine
# 1
2001-2002
59,375
40,625
79,167x25%
= 19,792
Machine
# 2
Machine
# 2
Machine
# 2
200,000
31-01-2002
89
Financial
Statement Analysis-FIN621
VU
200,000x25%x5
20,833
179,167
/12=20,833
178,906
121,094
Machine
# 1
Machine
# 1
2002-2003
Machine
# 1
44,531
55,469
59,375x25%
= 14,844
Machine
# 2
Machine
# 2
Machine
# 2
134,375
65,625
179,167x25%
=44,792
175,538
Machine
# 1
138,281
Machine
# 1
Machine
# 1
2003-2004
63,819
44,531x25%x
(36,181)
9/12=
8,350
(sold)
Machine
# 2
Machine
# 2
Machine
# 2
99,219
100,781
134,375x25%
= 33,594
Machine
# 3
Machine
# 3
Machine
# 3
50,000
01-07-2003
12,500
37,500
50,000x25%
= 12,500
Figure
in blue color is the written
down value of machine # 1, which is
disposed of by the management.
90
Financial
Statement Analysis-FIN621
VU
Full
year depreciation in the year of
purchase and no depreciation in the
year of sale:
Date
Purchase
Depreciation
Accumulated
Total
Written
Total
of
(Rs.)
depreciation
Accum.
Down
Value Written
machine
(Rs.)
Dep.
(Rs.)
Down
(Rs.)
Value
(Rs.)
01-09-2000
100,000
Machine
# 1
Machine
# 1
25,000
Machine
# 1
75,000
100,000
x 25%
25,000
75,000
=25,000
206,250
93,750
Machine
# 1
Machine
# 1
Machine
# 1
2001-2002
56,250
43,750
75,000x25%
= 18,750
Machine
# 2
Machine
# 2
200,000
Machine
# 2
31-01-2002
150,000
50,000
200,000x25%
=50,000
154,687
145,313
Machine
# 1
Machine
# 1
2002-2003
Machine
# 1
42,187
57,813
56,250x25%
= 14,063
Machine
# 2
Machine
# 2
Machine
# 2
112,500
87,500
150,000x25%
=37,500
121,875
185,935
Machine
# 1
Machine
# 1
Machine
# 1
2003-2004
42,187
57,813
0
(sold)
(sold)
Machine
sold
Machine
# 2
Machine
# 2
Machine
# 2
84,375
115,625
112,500x25%
= 28,125
Machine
# 3
Machine
# 3
Machine
# 3
50,000
01-07-2003
37,500
12,500
50,000x25%
= 12,500
If an
asset is not completed at that
time when balance sheet is
prepared, all costs incurred on
that asset
up to the
balance sheet date are
transferred to an account called Capital
Work in Progress
Account.
This
account is shown separately in the balance
sheet below the fixed asset.
Capital work in
progress
account
contains all expenses incurred on the
asset until it is converted
into working condition. All
these
expenses
will become part of the cost
of that asset. When any
expense is incurred or paid, it is
included
in the
Capital Work in Progress
Account through the following
entry:
Debit:
Work
in Progress Account
Credit:
Cash/Bank/Payable
Account
When
an asset is completed and it is ready to
work, all costs will
transfer to the relevant asset
account
through
the following entry:
Debit:
Relevant
asset account
Credit:
Capital
work in progress
account
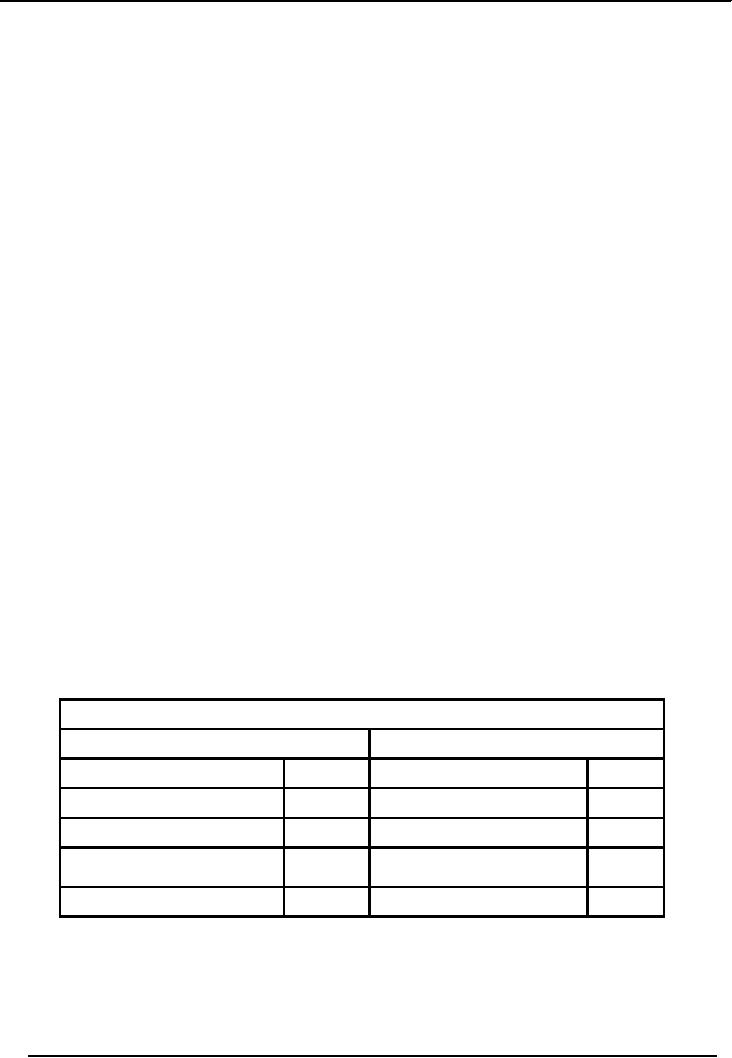
Presentation
It is
already mentioned that Work
in Progress Account is shown separately in the
balance sheet below
the
fixed asset. i-e.
91
Financial
Statement Analysis-FIN621
VU
Name
of the Entity
Balance
Sheet
As
At..........
Particulars
Amount
Amount
Rs.
Rs.
Assets
Fixed
Assets
xyz
Capital
Work in Progress
xyz
Other
Long Term Assets
xyz
Current
Assets
Total
Xyz
Liabilities
Capital
xyz
Profit
xyz
Xyz
Long
Term Liabilities
Xyz
Current
Liabilities
Total
Xyz
Consider the
solved illustration in the previous
lecture:
Depreciation on
the basis of use
Depreciation
Accumulated
Total
Written
Total
Date
Purchase
(Rs.)
depreciation
Accum.
Down
Value Written
of
(Rs.)
Dep.
(Rs.)
Down
machine
Value
(Rs.)
(Rs.)
01-09-2000
100,000
Machine
# 1
Machine
# 1
20,833
Machine
# 1 79,167
100,000
x 25%
20,833
79,167
x10/12=20,833
238,542
61,458
Machine
# 1
Machine
# 1
Machine
# 1
2001-2002
59,375
40,625
79,167x25%
= 19,792
Machine
# 2
Machine
# 2
Machine
# 2
200,000
31-01-2002
179,167
20,833
200,000x25%x5
/12=20,833
178,906
121,094
Machine
# 1
Machine
# 1
2002-2003
Machine
# 1
44,531
55,469
59,375x25%
= 14,844
Machine
# 2
Machine
# 2
Machine
# 2
134,375
65,625
179,167x25%
=44,792
138,281
175,538
Machine
# 1
Machine
# 1
Machine
# 1
2003-2004
(36,181)
63,819
44,531x25%x
(sold)
9/12=
8,350
Machine
# 2
Machine
# 2
Machine
# 2
100,781
99,219
134,375x25%
= 33,594
Machine
# 3
Machine
# 3
Machine
# 3
50,000
01-07-2003
92
Financial
Statement Analysis-FIN621
VU
50,000x25%
12,500
37,500
= 12,500
Presentation
in Balance Sheet
Year
Cost
of Machinery
Accumulated
Written
Down
Depreciation
Value
2000-2001
100,000
20,833
79,167
2001-2002
300,000
61,458
238,542
2002-2003
300,000
121,094
178,906
Written
down Value of the year
2003-2004
Opening
Written Down Value:
178,906
Add:
Cost of machine purchased:
50,000
Less:
Depreciation of Machine # 1 in
2003-2004:
(8,350)
Less:
Depreciation of other
assets:
(46,094)
Less:
Written Down Value of machine
disposed:
(36,181)
Closing
Written Down Value:
138,281
93
Financial
Statement Analysis-FIN621
VU
Full
year depreciation in the year of
purchase and no depreciation in the
year of sale:
Date
Purchase
Depreciation
Accumulated
Total
Written
Total
of
(Rs.)
depreciation
Accum.
Down
Value Written
machine
(Rs.)
Dep.
(Rs.)
Down
(Rs.)
Value
(Rs.)
01-09-2000
100,000
Machine
# 1
Machine
# 1
25,000
Machine
# 1
75,000
100,000
x 25%
25,000
75,000
=25,000
206,250
93,750
Machine
# 1
Machine
# 1
Machine
# 1
2001-2002
56,250
43,750
75,000x25%
= 18,750
Machine
# 2
Machine
# 2
Machine
# 2
200,000
31-01-2002
150,000
50,000
200,000x25%
=50,000
154,687
145,313
Machine
# 1
Machine
# 1
2002-2003
Machine
# 1
42,187
57,813
56,250x25%
= 14,063
Machine
# 2
Machine
# 2
Machine
# 2
112,500
87,500
150,000x25%
=37,500
121,875
185,935
Machine
# 1
Machine
# 1
Machine
# 1
2003-2004
42,187
57,813
0
(sold)
(sold)
Machine
sold
Machine
# 2
Machine
# 2
Machine
# 2
84,375
115,625
112,500x25%
= 28,125
Machine
# 3
Machine
# 3
Machine
# 3
50,000
01-07-2003
37,500
12,500
50,000x25%
= 12,500
Presentation
in the Balance
Sheet
Year
Cost
of Machinery
Accumulated
Written
Down
Depreciation
Value
2000-2001
100,000
25,000
75,000
2001-2002
300,000
93,750
206,250
2002-2003
300,000
145,313
154,687
Written
down Value of the year
2003-2004
Opening
Written Down Value:
Rs.
154,687
Add:
Cost of machine purchased:
Rs.
50,000
Less:
Depreciation of Machine # 1 in
2003-2004:
0
Less:
Depreciation of other
assets:
(40,625)
Less:
Written Down Value of machine
disposed:
(42,187)
Closing
Written Down Value:
Rs.
121,875
94
Financial
Statement Analysis-FIN621
VU
Illustration
# 2
Following
information of machinery account is
available in Year
2004:
· Machine
# 1 is purchased on
August
1, 2000 for Rs.
50,000
· Machine
# 2 is purchased on April 1, 2002
for Rs. 100,000
· Machine
# 3 is purchased on March 1, 2004
for Rs. 150,000
· Machine
# 1 is disposed on May 31,
2004
Depreciation
is charged @ 20% reducing
balance method. Financial year is
closed on June 30
every
year.
Show
the calculation of depreciation on
machinery for four years
using the following
policies:
· Depreciation
is charged on the basis of
use
· Full
depreciation is charged in the year of
purchase and no depreciation is charged
in the year
of
disposal,
Solution
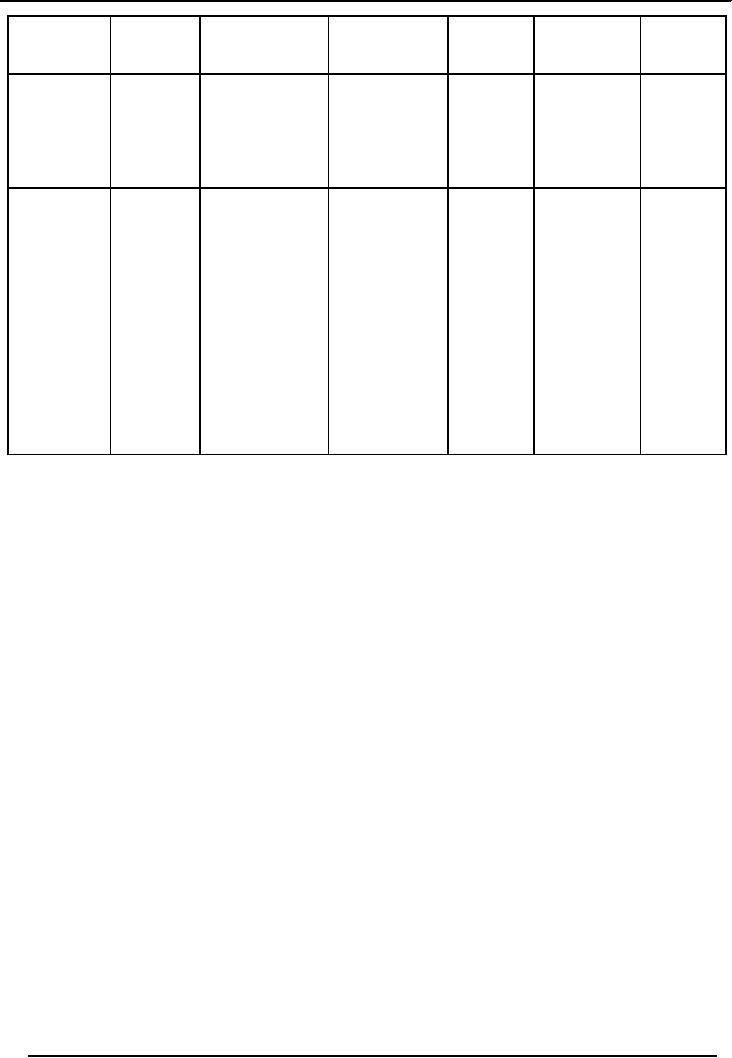
Depreciation on
the basis of use
Written
Total
Total
Date
Purchase
Depreciation
Accumulated
Down
Value Written
(Rs.)
depreciation
Accum.
of
Dep.
(Rs.)
Down
(Rs.)
machine
Value
(Rs.)
(Rs.)
01-08-2000
50,000
Machine
# 1
Machine
# 1
9,167
Machine
# 1 40,833
50,000
x 20%
9,167
9,167
x11/12=9,167
Machine
# 1
22,334
Machine
# 1
127,666
Machine
# 1
2001-2002
17,334
32,666
40,833x20%
Machine
# 2
= 8,167
5,000
Machine
# 2
100,000
Machine
# 2
01-04-2002
95,000
100,000x20%x3
/12=5,000
2002-2003
Machine
# 1
Machine
# 1
47,867
Machine
# 1
102,133
32,666x20%
23,867
26,133
= 6,533
Machine
# 2
Machine
# 2
Machine
# 2
95,000x20%
24,000
76,000
=19,000
200,800
77,858
Machine
# 1
Machine
# 1
Machine
# 1
2003-2004
(21,342)
28,658
26,133x20%x
(sold)
11/12=
4,791
Machine
# 2
Machine
# 2
Machine
# 2
60,800
39,200
76,000x20%
= 15,200
Machine
# 3
Machine
# 3
Machine
# 3
150,000
01-03-2004
140,000
10,000
150,000x20%x
4/12=
10,000
95
Financial
Statement Analysis-FIN621
VU
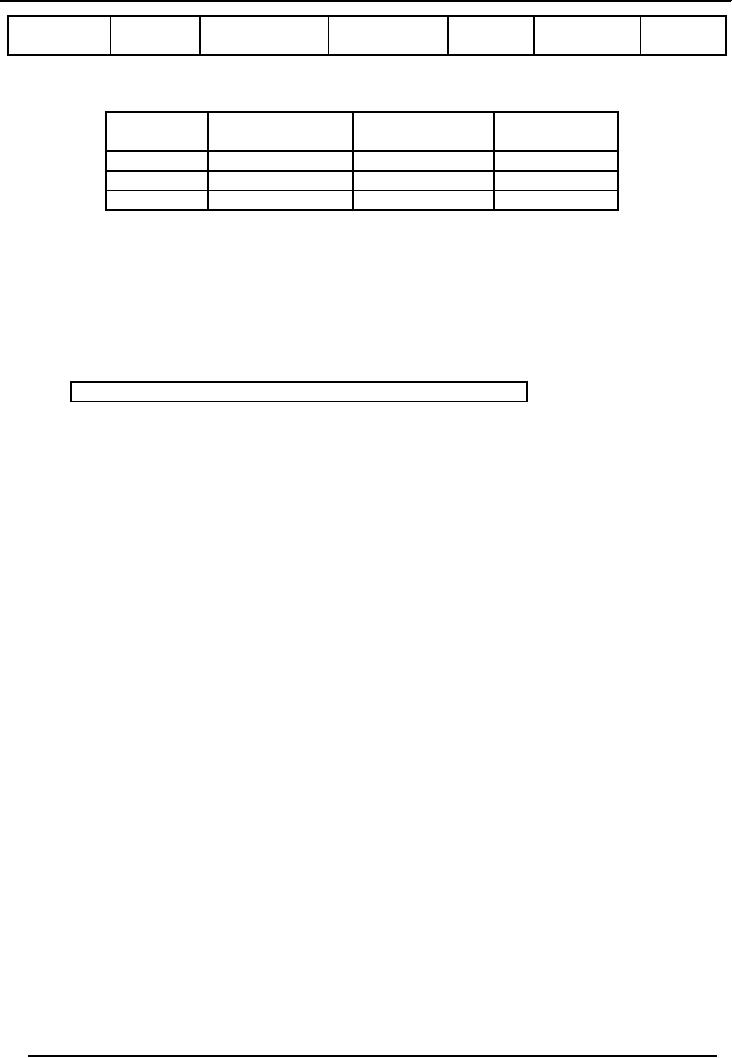
Presentation
in the Balance
Sheet
Year
Cost
of Machinery
Accumulated
Written
Down
Depreciation
Value
2000-2001
50,000
9,167
40,833
2001-2002
150,000
22,334
127,666
2002-2003
150,000
47,867
102,133
Written
Down Value of the year
2003-2004
Opening
Written Down Value:
Rs.
102,133
Add:
Cost of machine purchased:
Rs.
150,000
Less:
Depreciation of Machine # 1 in
2003-2004:
(4,791)
Less:
Depreciation of other
assets:
(25,200)
Less:
Written Down Value of machine
disposed:
(21,342)
Closing
Written Down Value:
Rs.
200,800
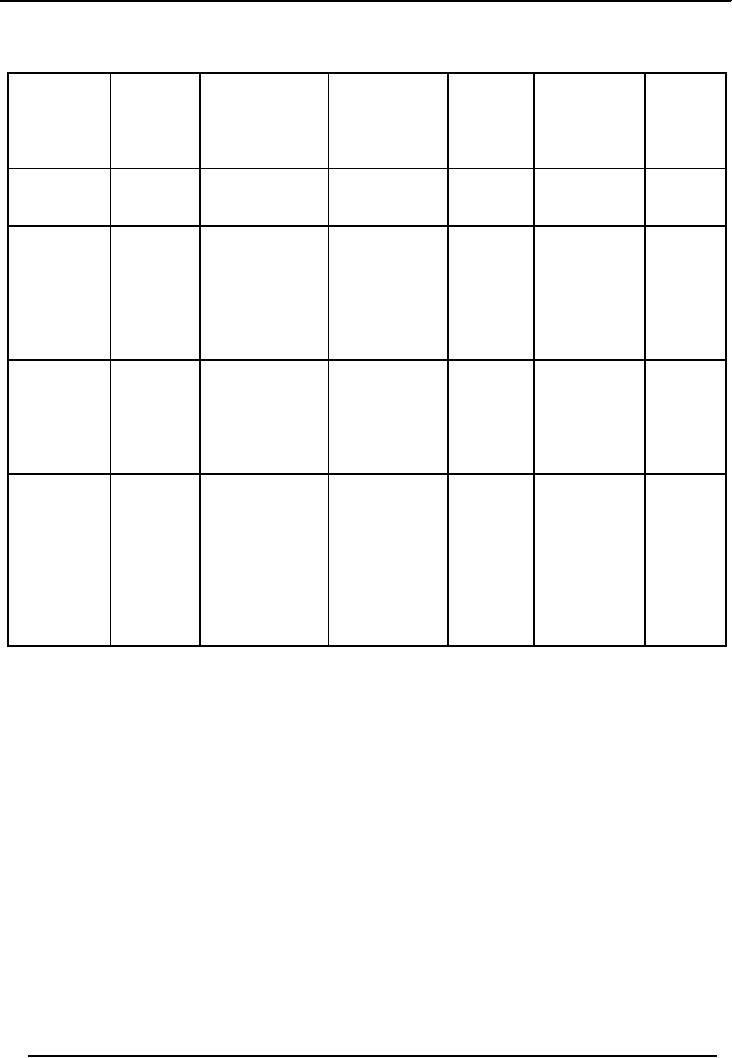
Full
year depreciation in the year of
purchase and no depreciation in the
year of sale:
Depreciation
Accumulated
Total
Written
Total
Date
Purchase
(Rs.)
depreciation
Accum.
Down
Value Written
of
(Rs.)
Dep.
(Rs.)
Down
machine
Value
(Rs.)
(Rs.)
01-08-2000
50,000
Machine
# 1
Machine
# 1
10,000
Machine
# 1
40,000
50,000
x 20%
10,000
40,000
=10,000
112,000
38,000
Machine
# 1
Machine
# 1
Machine
# 1
2001-2002
32,000
18,000
40,000x20%
= 8,000
Machine
# 2
Machine
# 2
100,000
Machine
# 2
01-04-2002
80,000
20,000
100,000x20%
=20,000
89,600
60,400
Machine
# 1
Machine
# 1
2002-2003
Machine
# 1
25,600
24,400
32,000x20%
= 6,400
Machine
# 2
Machine
# 2
Machine
# 2
64,000
36,000
80,000x20%
=16,000
171,200
103,200
Machine
# 1
Machine
# 1
Machine
# 1
2003-2004
(25,600)
24,400
0
(sold)
(sold)
Machine
sold
Machine
# 2
Machine
# 2
Machine
# 2
51,200
48,800
64,000x20%
= 12,800
Machine
# 3
Machine
# 3
Machine
# 3
150,000
01-03-2004
120,000
30,000
150,000x20%
= 30,000
96
Financial
Statement Analysis-FIN621
VU
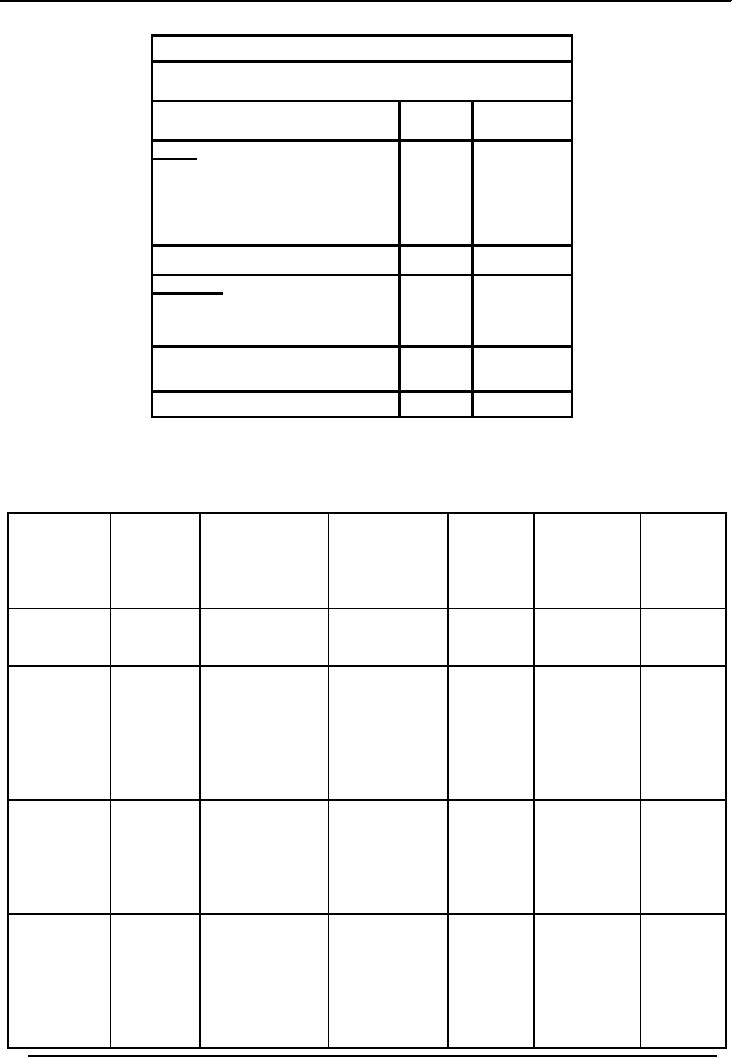
Presentation
in the Balance
Sheet
Year
Cost
of Machinery
Accumulated
Written
Down
Depreciation
Value
2000-2001
50,000
10,000
40,000
2001-2002
150,000
38,000
112,000
2002-2003
150,000
60,400
89,600
Written
Down Value of the year
2003-2004
Opening
Written Down Value:
Rs.
89,600
Add:
Cost of machine purchased:
Rs.
150,000
Less:
Depreciation of Machine # 1 in
2003-2004:
0
Less:
Depreciation of other
assets:
(42,800)
Less:
Written Down Value of machine
disposed:
(25,600)
Closing
Written Down Value:
Rs.
171,200
Revaluation of Fixed
Assets
Fixed
assets are purchased to be
used for longer period. In
the subsequent years, the value of
asset could
be
higher or lower than its
present book value due to
inflationary condition of the economy.
Assets are
valued
at Historical Cost in the books of
accounts. Historical Cost is the
original cost of the asset
at
which
it was purchased plus
additional costs incurred on the
asset to bring it in working
condition.
Sometimes,
the management of the business, if it
thinks fit, revalues the asset to
present it on current
market
value. Once the asset is
revalued to its market
value, then its value
has to be constantly
monitored
to reflect the changes in the market
value.
If an
asset is revalued at higher
cost than its original
cost, the excess amount will be treated
as profit on
revaluation
of fixed assets and it is credited to
Revaluation Reserve
Account.
On the
other hand, if an asset is revalued at
lower cost than its
original cost, the balance amount
will be
treated as
loss on revaluation of fixed
assets and it is shown in the profit &
loss account of that year
in
which
asset was revalued.
97
Table of Contents:
- ACCOUNTING & ACCOUNTING PRINCIPLES
- Dual Aspect of Transactions
- Rules of Debit and Credit
- Steps in Accounting Cycle
- Preparing Balance Sheet from Trial Balance
- Business transactions
- Adjusting Entry to record Expenses on Fixed Assets
- Preparing Financial Statements
- Closing entries in Accounting Cycle
- Income Statement
- Balance Sheet
- Cash Flow Statement
- Preparing Cash Flows
- Additional Information (AI)
- Cash flow from Operating Activities
- Operating Activities portion of cash flow statement
- Cash flow from financing Activities
- Notes to Financial Statements
- Charging Costs of Inventory to Income Statement
- First-in-First - out (FIFO), Last-in-First-Out (LIFO)
- Depreciation Accounting Policies
- Accelerated-Depreciation method
- Auditors Report, Opinion, Certificate
- Management Discussion & Analyses (MD&A)
- TYPES OF BUSINESS ORGANIZATIONS
- Incorporation of business
- Authorized Share Capital, Issued Share Capital
- Book Values of equity, share
- SUMMARY
- SUMMARY
- Analysis of income statement and balance sheet:
- COMMON SIZE AND INDEX ANALYSIS
- ANALYSIS BY RATIOS
- ACTIVITY RATIOS
- Liquidity of Receivables
- LEVERAGE, DEBT RATIOS
- PROFITABILITY RATIOS
- Analysis by Preferred Stockholders
- Efficiency of operating cycle, process
- STOCKHOLDERS EQUITY SECTION OF THE BALANCE SHEET 1
- STOCKHOLDERS EQUITY SECTION OF THE BALANCE SHEET 2
- BALANCE SHEET AND INCOME STATEMENT RATIOS
- Financial Consultation Case Study
- ANALYSIS OF BALANCE SHEET & INCOME STATEMENT
- SUMMARY OF FINDGINS