 |
DATA MINING |
| << META INFORMATION |
| CONFIDENCE AND SUPPORT >> |

E-COMMERCE
IT430
VU
Lesson
34
DATA
MINING
Data
Mining can be defined as the
task of discovering interesting patterns
from large amounts of
data,
where
the data can be stored in
databases, data warehouses, or
other information
repositories.
Data
mining has a lot of business
application in today's world. We
can identify the behavior of
our
customers
and can effectively target
them with personalized messages
using data mining
techniques.
Assume
that there is a shopping store
where the data/information about
customers has been
recorded/stored
over a period of time. Using a data
mining technique on the customers'
data, certain
pattern
can be generated that can
provide useful information.
For example, this pattern may
tell us that
people having a
certain demographic profile
(age over 20 years and
sex male) coming from a
particular
location
have shown inclination to
buy computer related items. It is an
interesting clue for the marketers.
In
case
there is a computer related item that is
to be marketed in future, then marketing
effort in this behalf
should be
focused on such persons
instead of sending marketing messages at
random. In other words,
persons
indicated by the pattern are the ones
who are likely to respond to
this kind of marketing initiative.
Thus,
if a company follows the pattern it can
save time, energy and mailing
cost.
Data
warehouse
A data
warehouse is a repository for long-term
storage of data from
multiple sources, organized so as
to
facilitate the
management for decision
making. Fig. 1 below shows
how data collected at
different sources is
cleaned,
transformed, integrated and loaded in a
data warehouse from where it
can be accessed by
clients
for
data mining and pattern
evaluation.
Client
Data
source in Karachi
Clean
Data
source in
Query
and
Transform
Data
Lahore
Analysis
tools
Integrate
warehouse
Load
Data
source in
Islamabad
Client
Data
source in Faisalabad
Fig.
1
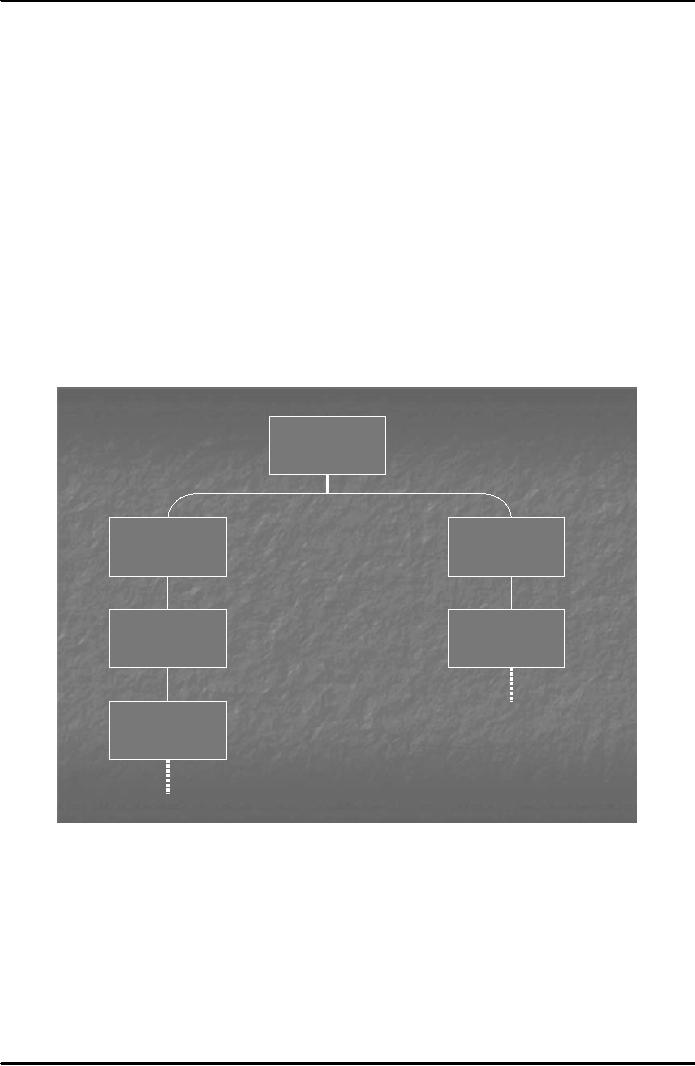
Knowledge
discovery
A knowledge
discovery process includes
data cleaning, data
integration, data selection,
data transformation,
data
mining, pattern evaluation and knowledge
presentation.
Fig.
2 shows the knowledge
discovery process:
140

E-COMMERCE
IT430
VU
Evaluation
and
Presentation
Knowledge
Data
Mining
Patterns
Selection
and
Transformation
Data
Warehouse
Cleaning
and
Integration
Databases
Fig.
2
Note
that data mining is a step
in the overall knowledge discovery
process. Data must be
cleaned,
transformed,
selected and integrated before data
mining is performed. Data cleaning means
that missing
values
should be provided in different
fields/columns wherever needed
and any impossible or
erroneous
values
should be substituted by correct/reasonable ones.
For example if the age of a
person is typed as
1000
years in the column `age' then an
average age value can be
put in its place. Where
there are quite a few
erroneous
or missing values in a row,
then that row can be
discarded/deleted altogether. This process
is
called
data selection. In data transformation,
the data from all different
sources is converted into the
same
format.
For example, date typed under a column
should be in the same format in the entire
data collected
through
different sources. In data
integration, data from all
the sources is assembled or integrated
into one
and
housed in the data warehouse.
Now, this cleaned, transformed, selected
and integrated data is fed to
the
data
mining tool from a data
warehouse for data mining
purpose. The results/
patterns are evaluated
by
managers
and useful knowledge is thus
gained. Note that almost 80%
of the total time used in a
knowledge
discovery
process is spent on just making the
data fit for mining,
that is, data cleaning,
data transformation,
data
selection etc.
Types of
Data Mining
There
are four main types of
data mining as
follows:
Classification
Association
Characterization
Clustering
Classification
and association are predictive
types of data mining while
characterization and
clustering
represent
the descriptive type.
Classification
It
allows you to have a predictive model
labeling different samples to different
classes. The results of
this
type of
mining/model are represented as
(if-then) rules, decision
trees, neural networks etc.
Two important
algorithms
used for this type are ID3
Algorithm, and Bayesian
classification. Decision tree is a
graphical
representation
of the if-then rules. Fig. 3 below
shows the result of classification in the
form of a decision
tree.
Initially, the whole data is
divided into two sets
training data and test
data.
141
E-COMMERCE
IT430
VU
In the
example below, `sex' is the target
attribute/variable with males
and females as the two
classes. When
no
mining is done and values
are picked at random, we find that
males are 55% and females
45% in the
training
data. With a variation of 1 or 2 % the
test data indicates a
similar result. Classification
algorithm
may
find the variable `age' as the best
predictor of males such that
when the age is between 20 and 25
years
the
percentage of males rises to 60% in the
training data and 59% in
test data. Similarly, education
and
annual
income can be discovered as
other predictors for males,
and so on. Thus, you
can find a pattern
that
when
age is between 20 and 25
years, and education is
matric or below and annual
income is less than
one
lac
(assuming that the model ends at
annual income), then there
is a 65% probability (in the training
data)
and
64% probability (in the test
data) that the sex of a
person would be male. Similarly, a
pattern for
predicting
females can also be obtained.
Note that by using
classification mining your
probability of
reaching
males has increased from 55%
(when no model is used) to 65% when the
model is applied. Hence,
if you
want to launch/market a product for
males and target them,
you can use the model or pattern
dug
out
through classification mining.
Following this model there would be 65%
chance that your
message
would
reach the desired class of
persons (males). You can
send marketing messages to persons having
the
above
profile to increase response
rate. It would save time,
energy and mailing
cost.
In another
example, three classes in a
sales campaign may be `good
response', mild response'
and `no
response'
and different features of
items such as `price',
`brand', `category' etc. can
be found as predictors by
the
algorithm.
Training Data
Test Data
M
55%
56%
F
45%
44%
Age
>=20<=25 years
Location :
rural area
M 60%
59%
M 40%
39%
F 40%
41%
F 60%
61%
Education :
Matric or Below
Marital
Status : unmarried
M 62%
64%
M 35%
36%
F 38%
36%
F 65%
64%
Annual
Income < one lac
M 65%
66%
F 35%
34%
Fig.
3
Note
that we split data into
training and test data to
judge the effectiveness of a rule, which
means that a
rule
(for example, age>=20<=25
years) is picked up as such by the tool
only if the test data also
confirms
the
same rule with a variation
upto 1or 2 % etc. The model
is practically applied and the results
are analyzed
to
calculate the efficiency of the
tool/model.
Efficiency
= actual/theoretical*100
In
case after applying the model we actually
reach 50% males whereas the predicted
value was 66% (we
take
the figure in test data for
calculation) then
Efficiency
= 50/66*100= 75.75 %
142

E-COMMERCE
IT430
VU
The
decision as to whether or not the same
model should be used in the future would
depend upon its
efficiency.
Normally, efficiency of a model close to 80% is
considered as a good
value.
Association
Association
analysis is the discovery of association
rules showing attribute-value conditions
that occur
frequently
together in a given set of data. It is widely
used for market basket
analysis. For example,
where
we are
recording sales of a big shopping store
in databases, then by applying
association mining we
may
discover
that certain items have a
strong bondage or affinity with
each other such that when
one item is
purchased
the other is purchased, too.
Apriori algorithm is used
for association
mining.
143
Table of Contents:
- E-COMMERCE
- WHAT IS A NETWORK
- HOW MANY CLASS A, B, C NETWORKS AND HOSTS ARE POSSIBLE
- NETWORKING DEVICES
- BASICS OF HTML 1
- BASICS OF HTML 2
- TEXT BOXES, CHECK BOXES, RADIO BUTTONS
- FRAMES AND IMAGES IN HTML
- TAG ATTRIBUTES, SOUNDS FILES, ANIMATIONS
- STYLE SHEETS 1
- STYLE SHEETS 2
- SOME USEFUL STYLE SHEETS PROPERTIES
- JAVA SCRIPTING 1
- JAVA SCRIPTING 2
- JAVA SCRIPTING 3
- JAVA SCRIPTING AND XML
- CLIENT AND SERVER SIDE PROCESSING OF DATA
- APPLETS, CGI SCRIPTS
- MAINTAINING STATE IN A STATELESS SYSTEM
- INTEGRATION WITH ERP SYSTEMS
- FIREWALLS
- CRYPTOGRAPHY
- HASH FUNCTION AND MESSAGE DIGEST
- SYMMETRIC KEY ALGORITHMS
- VIRTUAL PIN PAYMENT SYSTEM
- E-CASH PAYMENT SYSTEM 1
- E-CASH PAYMENT SYSTEM 2
- SECURE SOCKET LAYER (SSL)
- E-BUSINESS: DISADVANTAGES OF E-BUSINESS
- E-BUSINESS REVENUE MODELS
- E-MAIL MARKETING
- CUSTOMER RELATIONSHIP MANAGEMENT (CRM)
- META INFORMATION
- DATA MINING
- CONFIDENCE AND SUPPORT
- ELECTRONIC DATA INTERCHANGE (EDI)
- PERSONAL FINANCE ONLINE
- SUPPLY CHAIN
- PORTER’S MODEL OF COMPETITIVE RIVALRY
- BARRIERS TO INTERNATIONAL E-COMMERCE
- ELECTRONIC TRANSACTIONS ORDINANCE, 2002 - 1
- ELECTRONIC TRANSACTIONS ORDINANCE, 2002 - 2
- ELECTRONIC TRANSACTIONS ORDINANCE, 2002 - 3
- GLOBAL LEGAL ISSUES OF E-COMMERCE - 1
- GLOBAL LEGAL ISSUES OF E-COMMERCE - 2