 |
COMMON –SIZE AND INDEX ANALYSIS |
| << Analysis of income statement and balance sheet: |
| ANALYSIS BY RATIOS >> |

Financial
Statement Analysis-FIN621
VU
Lesson-32
COMMON SIZE
AND INDEX
ANALYSIS
Method
used by interested parties such as investors,
creditors, and management to evaluate the
past,
current,
and projected conditions and performance of the
firm. Ratio analysis is the most common
form
of
financial analysis. It provides relative
measures of the firm's conditions and
performance. Horizontal
Analysis
and Vertical Analysis are
also popular forms.
Horizontal analysis is used to evaluate
the trend
in the
accounts over the years,
while vertical analysis, also
called a Common Size Financial
Statement
discloses
the internal structure of the firm. It indicates the
existing relationship between sales
and each
income
statement account. It shows the mix of
assets that produce income and
the mix of the sources
of
capital,
whether by current or long-term
debt or by equity funding.
When using the financial
ratios, a
financial
analyst makes two types of
comparisons:
(a) Industry
comparison. The
ratios of a firm are
compared with those of
similar firms or with
industry
averages
or norms to determine how the company is
faring relative to its competitors.
Industry average
ratios
are available from a number of
sources
(b)
Trend
analysis. A
firm's present ratio is
compared with its past and
expected future ratios to
determine
whether the company's financial
condition is improving or deteriorating
over time.
After
completing the financial statement
analysis, the firm's financial analyst
will consult with
management
to discuss plans and prospects, any
problem areas identified in the analysis,
and possible
solutions.
Given below is a list of
widely used financial
ratios.
2.
Trend
percentages/ Horizontal Analysis/
Index Analysis: This
analysis considers changes in
items of
financial statement from a
base year to the following
years to show the direction of
change.
This
is also called horizontal analysis. In
this, the figures of various
years are placed side by
side in
adjacent columns
in the form of comparative financial
statements.
3. Component
percentages/ Vertical Analysis/
Common- Size Analysis: This
type of analysis
indicates the
relative size of each item
in the Financial Statements as a
percentage of the total of
that
Statement
i.e. Total Assets or total
Liabilities & Shareholders equity in Balance
Sheet and Sales in
Income
Statement. Such a statement is
then called common-size
Financial Statement. This
type of
analysis
technique is also called
Vertical Analysis.
Vertical
Analysis
When
using vertical analysis, the analyst
calculates each item on a
single financial statement as
a
percentage
of a total. The term vertical
analysis applies
because each year's figures
are listed vertically
on a
financial statement. The
total used by the analyst on the
income statement is net sales
revenue,
while
on the balance sheet it is total assets.
This approach to financial statement
analysis, also known as
component
percentages,
produces common-size
financial statements. Common-size
balance sheets and
income
statements can be more easily
compared, whether across the
years for a single company
or
across
different companies
Financial
statement item that is used
as a base value. All other
accounts on the financial statement
are
compared
to it. In the balance sheet,
for example, total assets
equals 100%. Each asset is
stated as a
percentage
of total assets. Similarly,
total liabilities and stockholders'
equity are assigned 100%
with a
given
liability or equity account
stated as a percentage of the total
liabilities and stockholders'
equity.
For
the income statement, 100% is
assigned to net sales with
all revenue and expense accounts
related to
it.
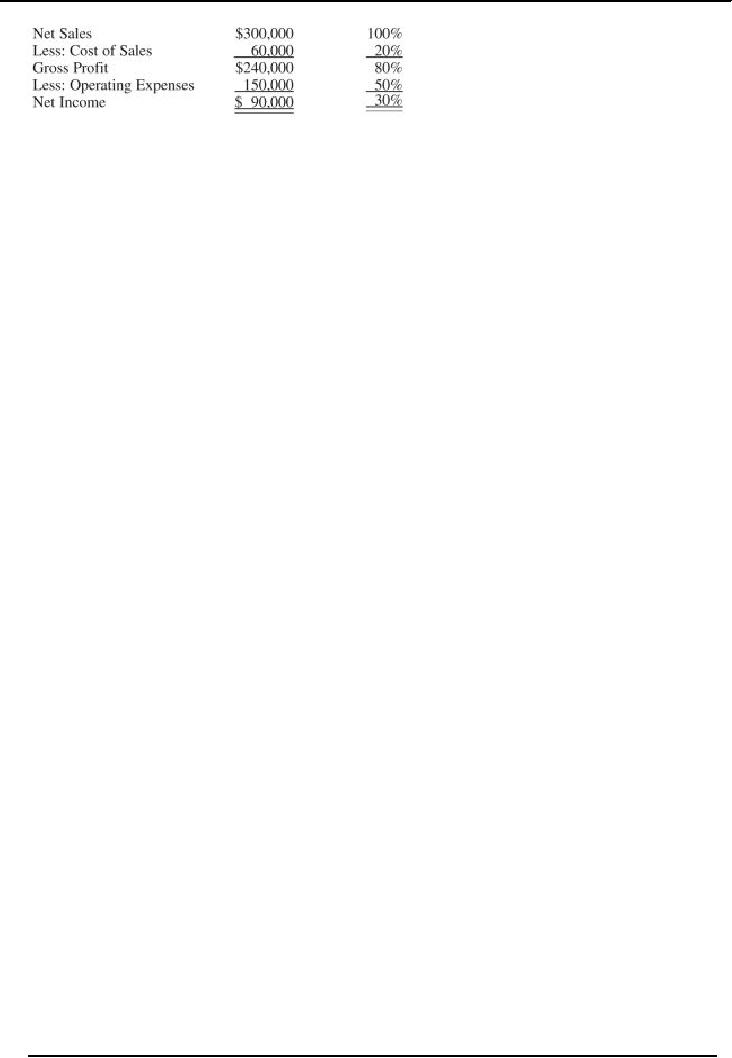
Under vertical analysis, the statements
showing the percentages are
referred to as Common Size
Financial
Statements. Common size percentages
can be compared from one
period to another to identify
areas
needing attention. An illustration
follows:
128
Financial
Statement Analysis-FIN621
VU
Horizontal
Analysis
When
an analyst compares financial
information for two or more
years for a single company,
the
process
is referred to as horizontal
analysis,
since the analyst is reading
across the page to compare
any
single
line item, such as sales
revenues. In addition to comparing
dollar amounts, the analyst
computes
percentage
changes from year to year
for all financial statement
balances, such as cash and
inventory.
Alternatively,
in comparing financial statements
for a number of years, the analyst
may prefer to use a
variation
of horizontal analysis called trend
analysis.
Trend analysis involves calculating
each year's
financial
statement balances as percentages of the
first year, also known as
the base year. When
expressed
as percentages, the base
year figures are always
100 percent, and percentage changes
from the
base
year can be
determined.
Time
series analysis of financial statements
covering more than one accounting
period; also called
Trend
Analysis. It looks at the percentage
change in an account over
time. The percentage
change
equals
the change over the prior
year. For example, if sales
in 20X0 are $100,000 and in
20X1 are
$300,000,
there is a 200% increase
($200,000/$100,000). By examining the
magnitude of direction of a
financial
statement item over time,
the analyst can evaluate its
reasonableness.
Common
Size Financial Statement
A company
financial statement that
displays all items as
percentages of a common base figure.
This
type
of financial statement allows
for easy analysis between companies or
between time periods of a
company.
129
Table of Contents:
- ACCOUNTING & ACCOUNTING PRINCIPLES
- Dual Aspect of Transactions
- Rules of Debit and Credit
- Steps in Accounting Cycle
- Preparing Balance Sheet from Trial Balance
- Business transactions
- Adjusting Entry to record Expenses on Fixed Assets
- Preparing Financial Statements
- Closing entries in Accounting Cycle
- Income Statement
- Balance Sheet
- Cash Flow Statement
- Preparing Cash Flows
- Additional Information (AI)
- Cash flow from Operating Activities
- Operating Activities’ portion of cash flow statement
- Cash flow from financing Activities
- Notes to Financial Statements
- Charging Costs of Inventory to Income Statement
- First-in-First - out (FIFO), Last-in-First-Out (LIFO)
- Depreciation Accounting Policies
- Accelerated-Depreciation method
- Auditor’s Report, Opinion, Certificate
- Management Discussion & Analyses (MD&A)
- TYPES OF BUSINESS ORGANIZATIONS
- Incorporation of business
- Authorized Share Capital, Issued Share Capital
- Book Values of equity, share
- SUMMARY
- SUMMARY
- Analysis of income statement and balance sheet:
- COMMON –SIZE AND INDEX ANALYSIS
- ANALYSIS BY RATIOS
- ACTIVITY RATIOS
- Liquidity of Receivables
- LEVERAGE, DEBT RATIOS
- PROFITABILITY RATIOS
- Analysis by Preferred Stockholders
- Efficiency of operating cycle, process
- STOCKHOLDERS’ EQUITY SECTION OF THE BALANCE SHEET 1
- STOCKHOLDERS’ EQUITY SECTION OF THE BALANCE SHEET 2
- BALANCE SHEET AND INCOME STATEMENT RATIOS
- Financial Consultation Case Study
- ANALYSIS OF BALANCE SHEET & INCOME STATEMENT
- SUMMARY OF FINDGINS