 |
Changes in Market Equilibrium:Market for College Education |
| << REAL VERSUS NOMINAL PRICES:SUPPLY AND DEMAND, The Demand Curve |
| Elasticities of supply and demand:The Demand for Gasoline >> |
Microeconomics
ECO402
VU
Lesson
4
Changes in
Market Equilibrium
Equilibrium
prices are determined by the
relative level of supply and
demand.
Supply
and demand are determined by
particular values of supply
and demand
determining
variables.
Changes
in any one or combination of
these variables can cause a
change in the
equilibrium
price and/or
quantity.
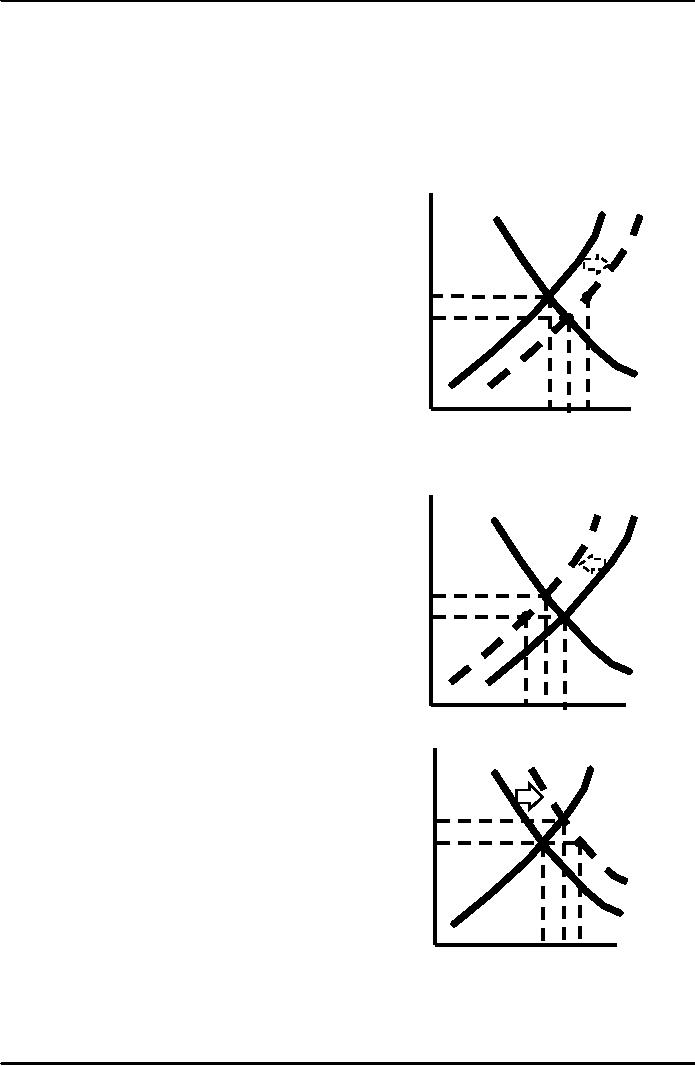
P
S
D
Raw
material prices fall
S'
S
shifts
to S'
Surplus @
P1 of
Q1,
Q2
Equilibrium
@ P3,
Q3
P1
P3
Q1 Q3 Q2
Q
P
S'
D
S
Raw
material prices Rise
S
shifts
to S'
Shortage @
P1 of
Q1,
Q2
Equilibrium
@ P3,
Q3
P3
P1
Q3
Q1
Q2
Q
Income
Increases
P
D
D'
S
Demand
shifts to D'
Shortage
@ P1
of
Q1,
Q2
Equilibrium
@ P3,
Q3
P3
P1
Q1 Q3
Q2
Q
9
Microeconomics
ECO402
VU
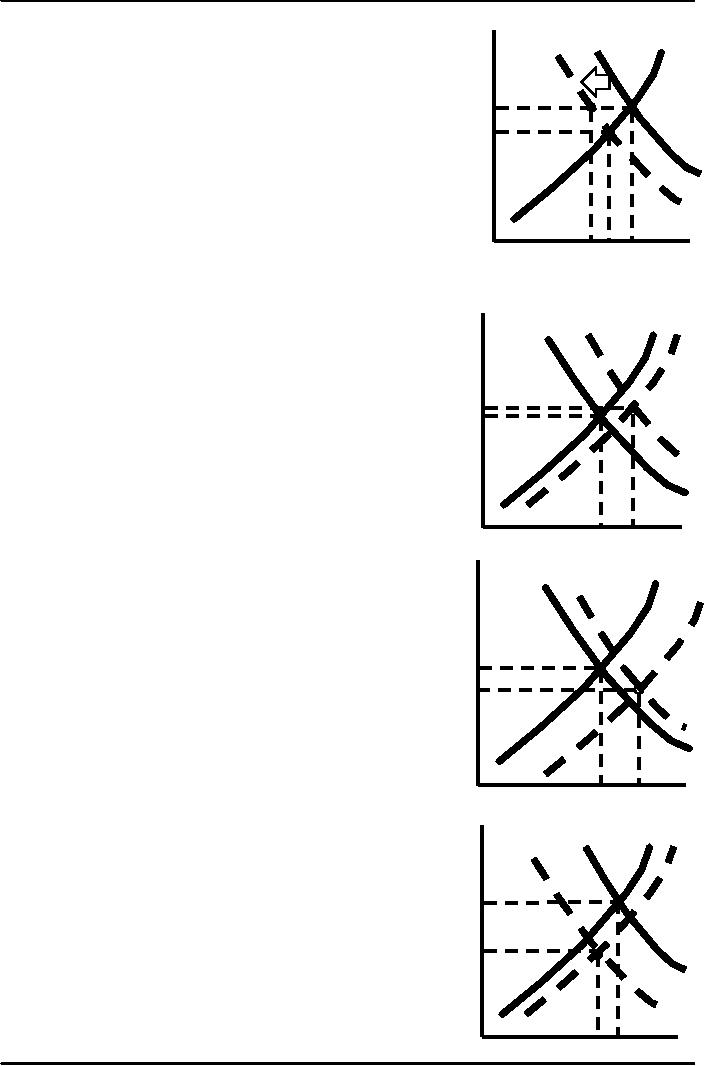
P
Income
Decreases
D
D'
S
Demand
shifts to D'
Surplus @
P1 of
Q1,
Q2
Equilibrium
@ P3,
Q3
P1
P3
Q2 Q3
Q1
Q
Income
Increases & raw material
prices fall
P
The
increase in D
is
greater than the
increase
D
D'
S
S'
in
S
Equilibrium
price and quantity increase
to P2,
Q2
P2
P1
Q
Q1
Q2
P
D
S
Income
Increases & raw material
prices fall
S'
D'
The
increase in D
is
less than the increase
in
S
Equilibrium
price decrease to P2and
quantity
increase
to Q2
P1
P2
Q
Q1
Q2
P
Income
Decreases & raw material
prices Fall
D
S
S'
D'
The
decrease in D
is
greater than the
increase
in S
Equilibrium
price and quantity decrease
to P2
P1
Q2
P2
Q
Q2 Q1
10
Microeconomics
ECO402
VU
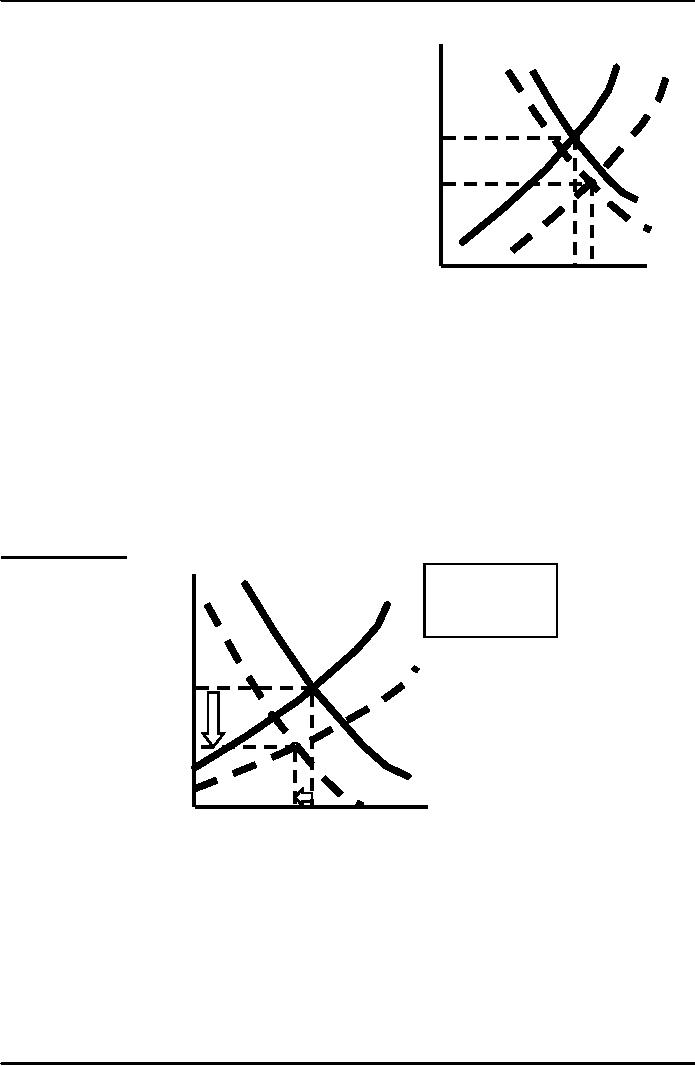
Income
decreases & raw material
prices fall
P
D'
S
D
The
decrease in D
is
less than the
S'
increase
in S
Equilibrium
price decrease to P2
and
quantity
increase to Q2
P1
P2
Q
Q1 Q2
Shifts
in Supply and
Demand
When
supply and demand change
simultaneously, the impact on
the equilibrium price
and
quantity is determined
by:
1)
The relative size and
direction of the
change
2)
The shape of the supply
and demand curves
The
Prices of Eggs & Education
Revisited
The
real price of eggs fell
59% from 1970 to
1998.
Supply
increased due to the
increased mechanization of poultry
farming and the
reduced
cost of production.
Demand
decreased due to the
increasing consumer concern
over the health
and
cholesterol
consequences of eating
eggs.
Market
for Eggs
Prices
fell until
P
a
new equilibrium
S1970
(1970
was
reached at $0.26
dollars
per
and
a quantity
dozen)
of
5,300 million
dozen
S1998
$0.61
$0.26
D1970
D1998
Q
(million dozens)
5,300
5,500
Price
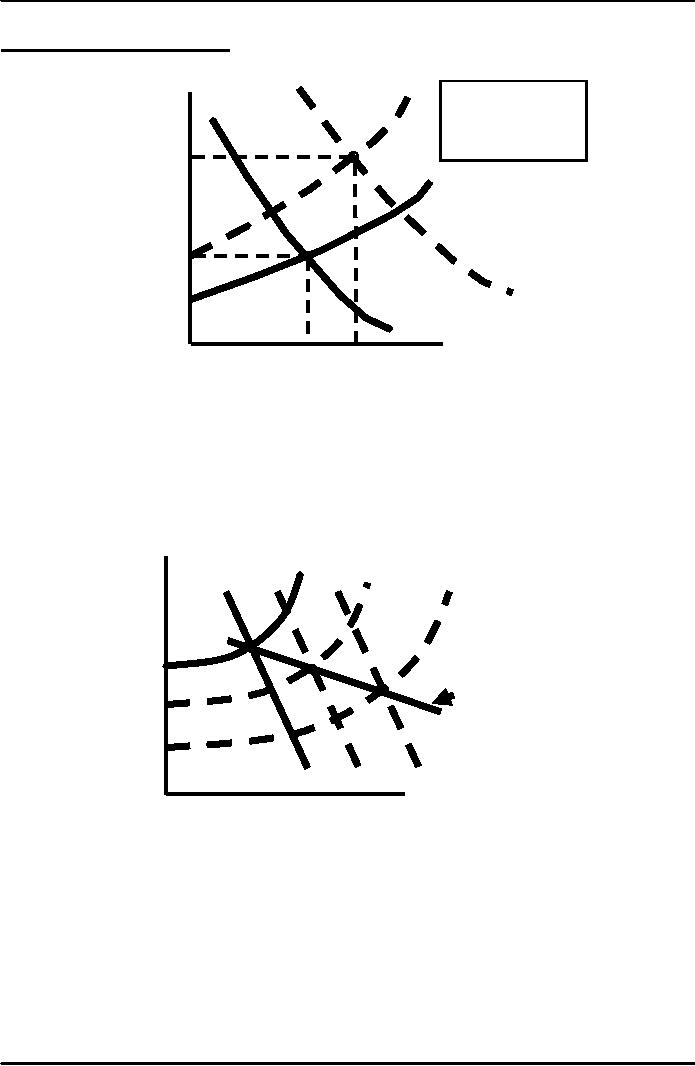
of College Education
The
real price of a college
education rose 68 percent
from 1970 to 1995.
Supply
decreased due to higher
costs of equipping and
maintaining modern
classrooms,
laboratories and libraries,
and higher faculty
salaries.
Demand
increased due a larger
percentage of a larger number of
high school
graduates
attending college.
11
Microeconomics
ECO402
VU
Market
for College
Education
P
S1995
Prices
rose until
(annual
cost
in
1970
a
new equilibrium
dollars)
was
reached at $4,573
and
a quantity
of
12.3 million students
$4,573
S1970
$2,530
D1995
D1970
8.6
12.3
Q
(millions of students
enrolled)
The
Long-Run Behavior of Natural
Resource Prices
Observations
Consumption
of copper has increased
about a hundred fold from
1880 through
1998
indicating a large increase in
demand.
The
real price for copper
has remained relatively
constant.
Changes
in Market Equilibrium
Price
S1900
S1950
S1998
Long-Run
Path of
Price
and
D1900
D1950
D1998
Quantity
Conclusion
Decreases
in the costs of production
have increased the supply by
more than
enough
to offset the increase in
demand.
12
Microeconomics
ECO402
VU
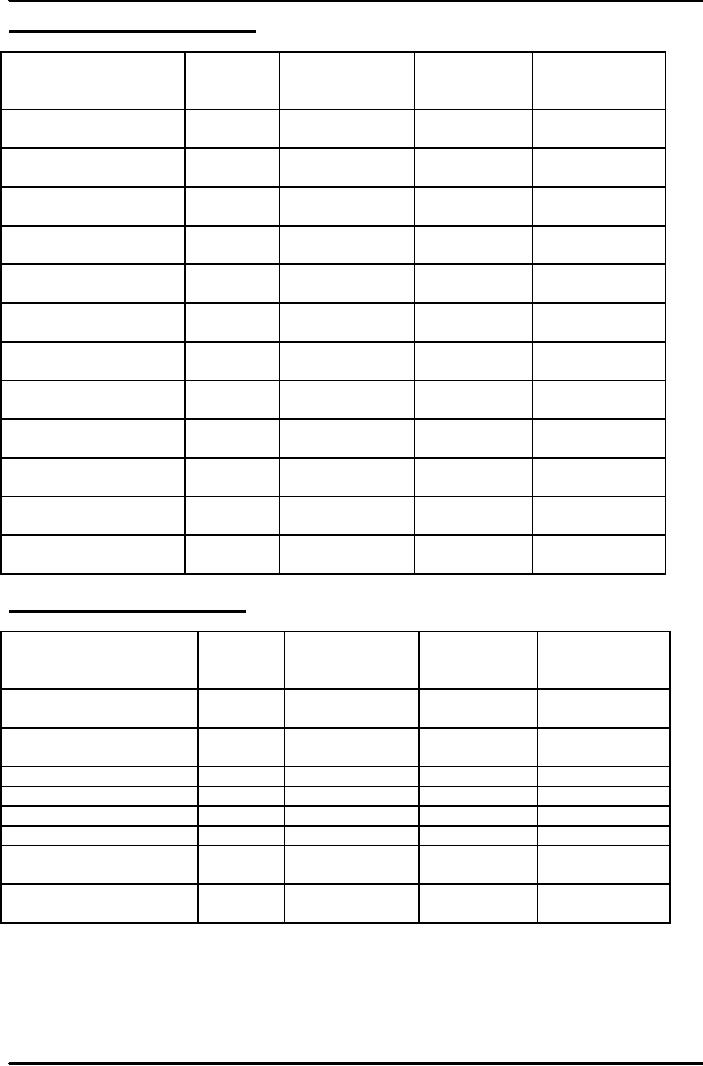
Factors
Shifting Demand
Curve
Factors
Changing
Effect
on
Direction
of
Effect
on
Effect
on
Demand
Demand
Shift
in
Equilibrium
Equilibrium
Demand
Curve
Price
Quantity
Increase
in income
Increase
Rightward
Increase
Increase
(normal
good)
Decrease
in
Decrease
Leftward
Decrease
Decrease
income(normal
good)
Increase
in income
Decrease
Rightward
Decrease
Decrease
(inferior
good)
Decrease
in
Increase
Rightward
Increase
Increase
income(inferior
good)
Increase
in price of
Increase
Rightward
Increase
Increase
Substitute
Decrease
in price of
Decrease
Rightward
Decrease
Decrease
substitute
Increase
in price of
Decrease
Leftward
Decrease
Decrease
complement
Decrease
in price of
Increase
Rightward
Increase
Increase
complement
Increase
in taste and
Increase
Rightward
Increase
Increase
preference
for good
Decrease
in taste and
Decrease
Leftward
Decrease
Decrease
preference
for good
Increase
in number of
Increase
Rightward
Increase
Increase
consumers
Decrease
in number of
Decrease
Leftward
Decrease
Decrease
consumers
Factors
Shifting Supply
Curve
Factors
Changing
Effect
on Direction of
Effect
on
Effect
on
Supply
Supply
Shift
in Supply
Equilibrium
Equilibrium
Curve
Price
Quantity
Increase
in resource
Decrease
Leftward
Increase
Decrease
price
Decrease
in resource
Increase
Rightward
Decrease
Increase
price
Improved
technology
Increase
Rightward
Decrease
Increase
Decline
in technology
Decrease
Leftward
Increase
Decrease
Expect
a price increase
Decrease
Leftward
Increase
Decrease
Expect
a price decrease
Increase
Rightward
Decrease
Increase
Increase
in number of
Increase
Rightward
Decrease
Increase
suppliers
Decrease
in number of
Decrease
Leftward
Increase
Decrease
suppliers
13
Microeconomics
ECO402
VU
ELASTICITIES
OF SUPPLY AND DEMAND
Generally,
elasticity is a measure of the
sensitivity of one variable to
another.
It
tells us the percentage
change in one variable in
response to a one percent
change
in
another variable.
Price
Elasticity of Demand
Measures
the sensitivity of quantity
demanded to price
changes.
It
measures the percentage
change in the quantity
demanded for a good
or
services
that results from a one
percent change in the price
of that good or
service.
The
price elasticity of demand
is:
Percentage
change in Quantity
Demanded
Percentage
change in Price
E
P =
(%
Δ
Q)/(%
Δ
P)
The
percentage change in a variable is
the absolute change in the
variable
divided
by the original level of the
variable.
So
the price elasticity of
demand is also:
Δ
Q
/Q
ΔQ
P
EP =
=
Δ
P
/P
Q
ΔP
Interpreting
Price Elasticity of Demand
Values
1)
Because of the inverse
relationship between P and Q; EP is
negative.
2)
If IEPI > 1, the percent
change in quantity is greater
than the percent
change
in price. We say the demand
is price elastic.
3)
If IEPI < 1, the percent
change in quantity is less
than the percent
change
in price. We say the demand
is price inelastic.
The
primary determinant of price
elasticity of demand is the
availability of substitutes.
Many
substitutes demand is price
elastic
Few
substitutes demand is price
inelastic
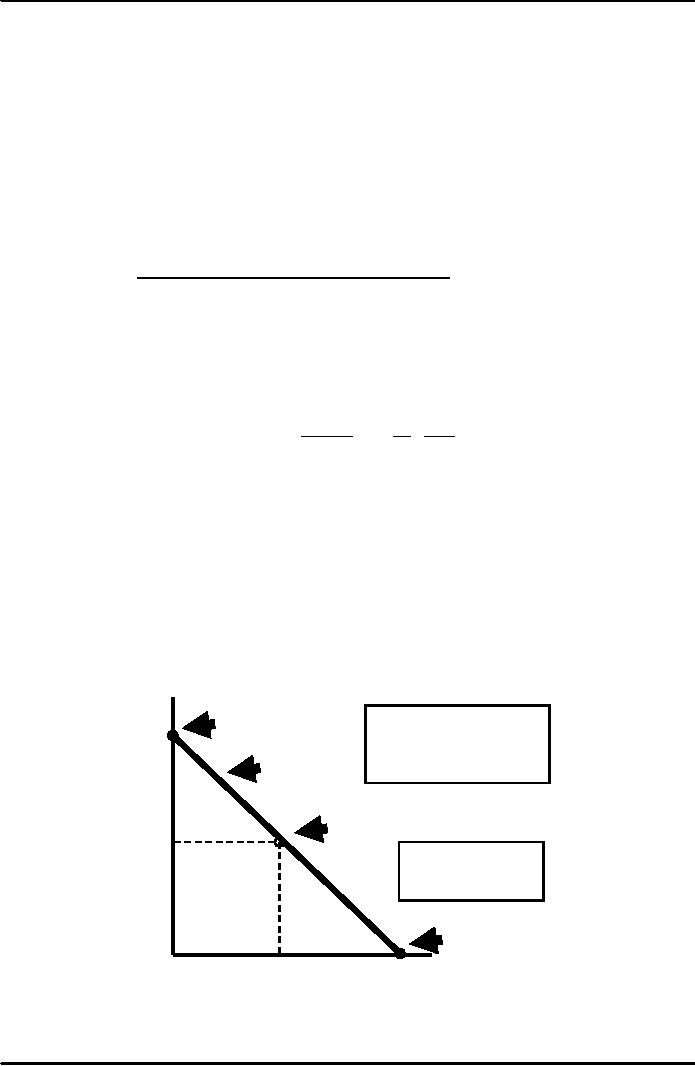
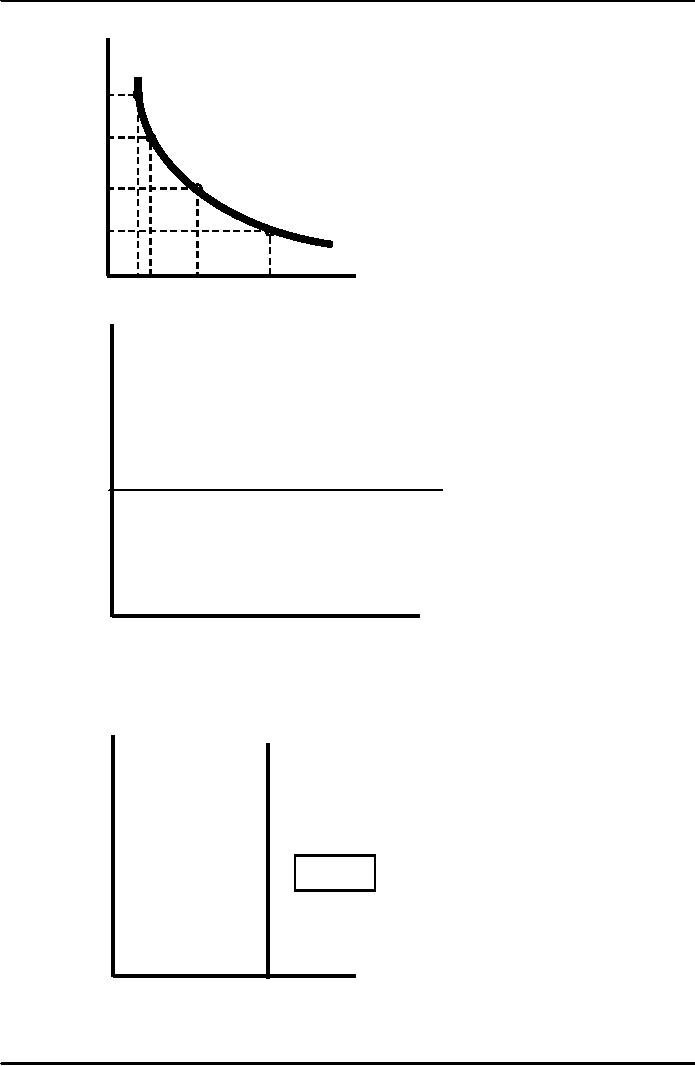
Price
Elasticities of Demand
Price
The
lower portion of a
Ep
= ∞
4
_
downward
sloping demand
curve
is less elastic than
the
upper
portion.
Q
= 8 - 2P
Ep =
-1
2
Linear
Demand Curve
Q
= a - bP
Q
= 8 - 2P
Ep =
0
Q
8
4
14
Microeconomics
ECO402
VU
Price
12
A
Ep
= -3
9
B
Ep
= -1
6
Ep
= -0.4
C
3
D
D
0
23
6
10
Q
Price
Infinitely
Elastic Demand
Quantity
Completely
Inelastic Demand
Price
EP = 0
*
Q
Quantity
15
Table of Contents:
- ECONOMICS:Themes of Microeconomics, Theories and Models
- Economics: Another Perspective, Factors of Production
- REAL VERSUS NOMINAL PRICES:SUPPLY AND DEMAND, The Demand Curve
- Changes in Market Equilibrium:Market for College Education
- Elasticities of supply and demand:The Demand for Gasoline
- Consumer Behavior:Consumer Preferences, Indifference curves
- CONSUMER PREFERENCES:Budget Constraints, Consumer Choice
- Note it is repeated:Consumer Preferences, Revealed Preferences
- MARGINAL UTILITY AND CONSUMER CHOICE:COST-OF-LIVING INDEXES
- Review of Consumer Equilibrium:INDIVIDUAL DEMAND, An Inferior Good
- Income & Substitution Effects:Determining the Market Demand Curve
- The Aggregate Demand For Wheat:NETWORK EXTERNALITIES
- Describing Risk:Unequal Probability Outcomes
- PREFERENCES TOWARD RISK:Risk Premium, Indifference Curve
- PREFERENCES TOWARD RISK:Reducing Risk, The Demand for Risky Assets
- The Technology of Production:Production Function for Food
- Production with Two Variable Inputs:Returns to Scale
- Measuring Cost: Which Costs Matter?:Cost in the Short Run
- A Firms Short-Run Costs ($):The Effect of Effluent Fees on Firms Input Choices
- Cost in the Long Run:Long-Run Cost with Economies & Diseconomies of Scale
- Production with Two Outputs--Economies of Scope:Cubic Cost Function
- Perfectly Competitive Markets:Choosing Output in Short Run
- A Competitive Firm Incurring Losses:Industry Supply in Short Run
- Elasticity of Market Supply:Producer Surplus for a Market
- Elasticity of Market Supply:Long-Run Competitive Equilibrium
- Elasticity of Market Supply:The Industrys Long-Run Supply Curve
- Elasticity of Market Supply:Welfare loss if price is held below market-clearing level
- Price Supports:Supply Restrictions, Import Quotas and Tariffs
- The Sugar Quota:The Impact of a Tax or Subsidy, Subsidy
- Perfect Competition:Total, Marginal, and Average Revenue
- Perfect Competition:Effect of Excise Tax on Monopolist
- Monopoly:Elasticity of Demand and Price Markup, Sources of Monopoly Power
- The Social Costs of Monopoly Power:Price Regulation, Monopsony
- Monopsony Power:Pricing With Market Power, Capturing Consumer Surplus
- Monopsony Power:THE ECONOMICS OF COUPONS AND REBATES
- Airline Fares:Elasticities of Demand for Air Travel, The Two-Part Tariff
- Bundling:Consumption Decisions When Products are Bundled
- Bundling:Mixed Versus Pure Bundling, Effects of Advertising
- MONOPOLISTIC COMPETITION:Monopolistic Competition in the Market for Colas and Coffee
- OLIGOPOLY:Duopoly Example, Price Competition
- Competition Versus Collusion:The Prisoners Dilemma, Implications of the Prisoners
- COMPETITIVE FACTOR MARKETS:Marginal Revenue Product
- Competitive Factor Markets:The Demand for Jet Fuel
- Equilibrium in a Competitive Factor Market:Labor Market Equilibrium
- Factor Markets with Monopoly Power:Monopoly Power of Sellers of Labor