 |
ANALYSIS OF BALANCE SHEET & INCOME STATEMENT |
| << Financial Consultation Case Study |
| SUMMARY OF FINDGINS >> |
Financial
Statement Analysis-FIN621
VU
Lesson-44
ANALYSIS
OF BALANCE SHEET & INCOME
STATEMENT
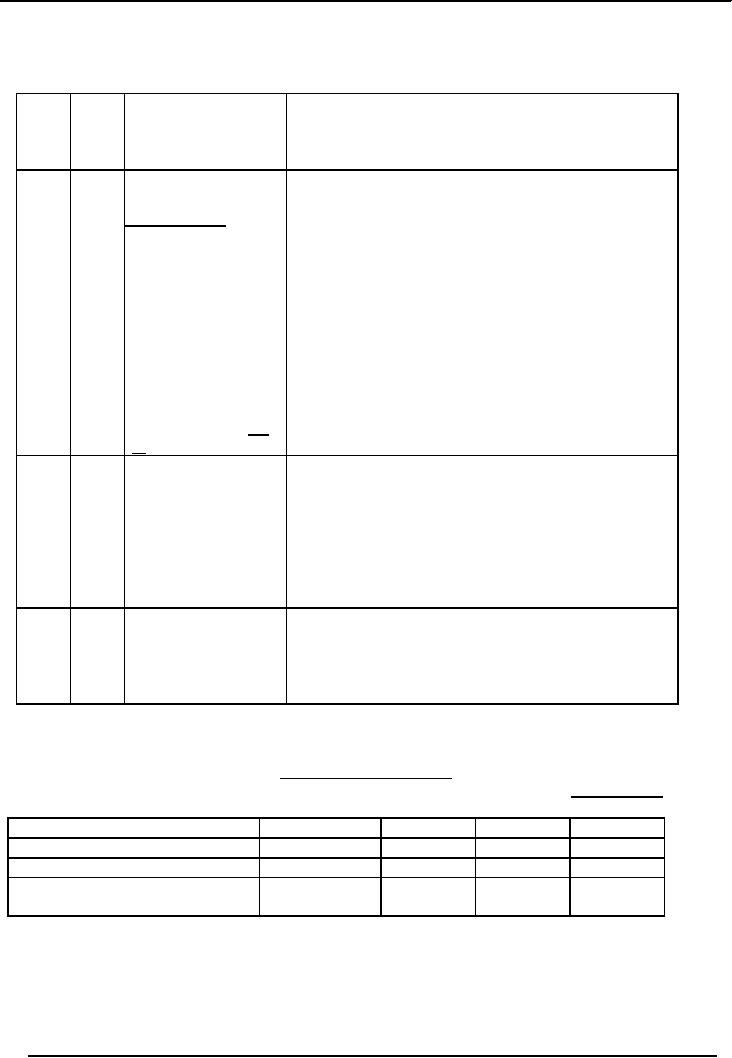
5
1
Fixed
Assets
a)
Decreasing.
b) No
depreciation reserve (unable to replace
old
assets
out of its own
resources).
·
Bibo
had made counter claims
6
1
Current
Assets:
·
These
are doubtful debts.
·
No
provision for bad
debts.
m
Bibo:Rs.17 m
·
Liquidity
overstated.
·
Interest
treated
as
miscellaneous
-Book
debt
=
Income.
Rs.6.71
m
·
Treating
interest as misc. income
understated
on
30.06.72
operating
losses by Rs.10.29 million.
·
Accumulated
loss rises from 114
million to 124
-Interest
over the=
million.
Rs.10.29
m
period
1972-80
____
17
m
7
1
Other
Receivables
·
Loans
given to cane growers.
·
Aging
detail.
·
Loans of
Rs.0.5 million outstanding
for 6-10
years.
·
Doubtful/bad
loans.
·
No
provision.
·
Liquidity
overstated.
8
3
Liquidity
·
Current
and quick ratios.
·
Poor
liquidity.
·
Actual
ratios much lower in view of
doubtful
debts.
·
Cannot
repay its current
obligations.
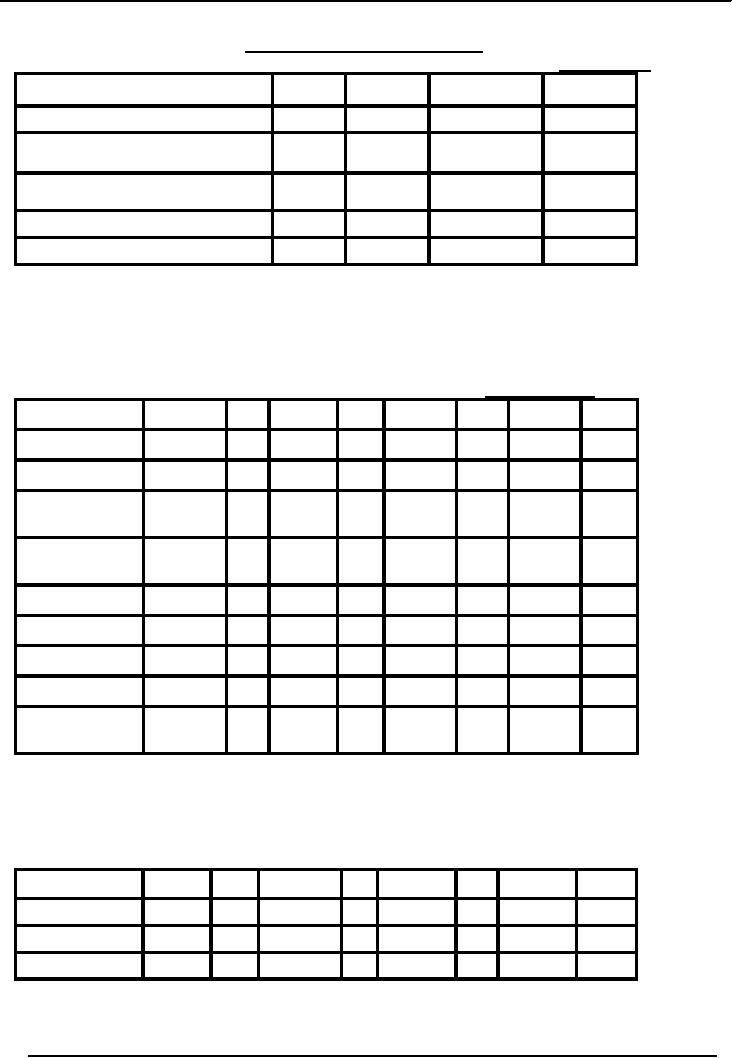
Table-2
ACCUMULATED
LOSS
Rs.
in million
At the end of
year
1976-77
1977-78
1978-79
1979-80
Loss
for the year
9.5
16.0
12.03
19.8
Accumulated
loss
66.0
82.0
94.3
114.1
%
increase in accumulated loss
24%
43%
73%
over
base year (1976-77)
157
Financial
Statement Analysis-FIN621
VU
Table-3
CURRENT
AND QUICK RATIOS
Rs.
in million
Year
end June 30
1977
1978
1979
1980
Current
assets
33
40
35
24
Current
assets less inventory &
pre- 19
19
21
22
paid
Current
liabilities
40
55
53
51
Current
ratio
0.8:1
0.7:1
0.6:1
0.5:1
Quick
ratio
0.5:1
0.3:1
0.3:1
0.4:1
Table-4
XYZ
SUGAR MILLS
PROFIT
AND LOSS ACCOUNT
Rs.
in thousands
Year
1976-77
1977-78
1978-79
1979-80
Sales
58,000
%
52,000
%
42,000
%
20,000
%
Cost
of Sales
Cane,
carriage & 35,000
60
38,000
73
24,000
57
16,000
80
incidentals
Salaries &
Wages 6,000
10
7,000
13
6,000
14
6,000
30
Excise
duty
15,000
26
11,000
21
11,000
26
2,000
10
Depreciation
1,000
2
1,000
2
800
2
800
4
Others
3,000
5
3,400
7
3,000
7
2,000
10
Total:
60,000
103
60,400
116
44,800
106
26,800
134
Gross
Profit (loss) (2,000)
3
(8,400)
16
(2,800)
6
(6,800)
34
Operating
& non-operating expenses
Admin
& selling
3,000
5
3,000
5
4,000
10
5,000
25
Financial
4,500
8
4,600
9
5,500
13
8,000
40
Total:
7,500
13
7,600
14
9,500
23
13,000
65
Operating
(loss)
(9,500)
16
(16,000)
30
(12,300)
29
(19,800)
99
158
Financial
Statement Analysis-FIN621
VU
`Others'
consist of:
-
Cloth
& packing material
-
Stores
& Spares
-
Insurance
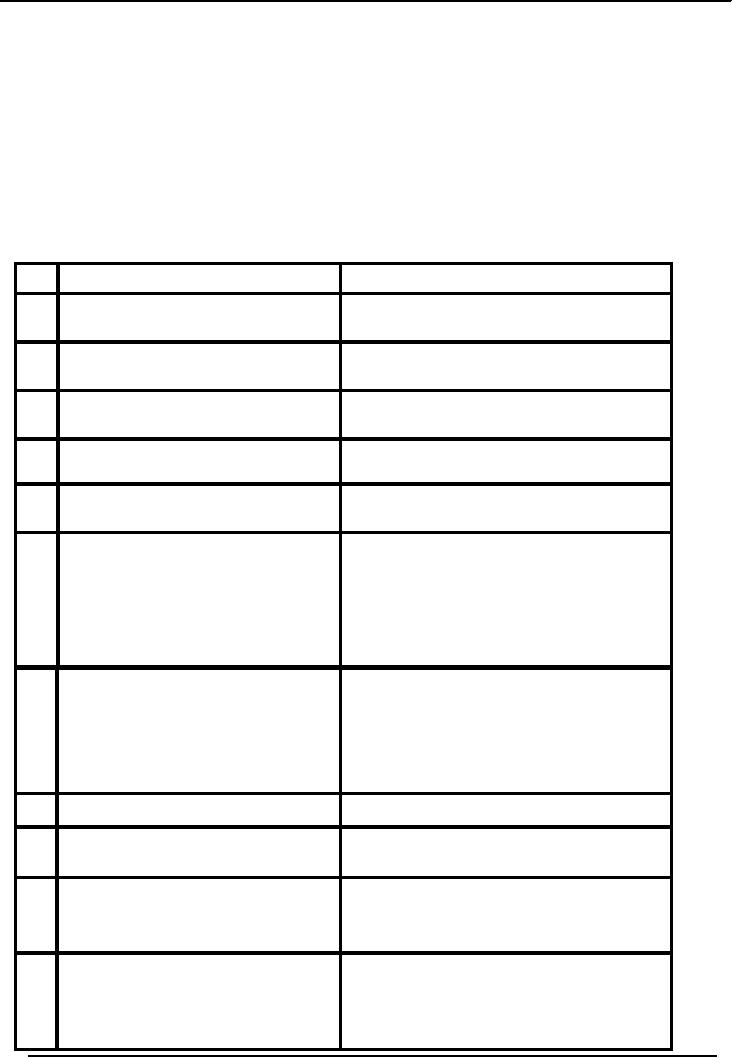
ANALYSIS
OF PROFIT & LOSS ACCOUNT
No.
DATA/FACTS/DOCUMENTS
FINDING
1.
Table-4
Profit & Loss
Accounts
·
Bottom
line figures: operating
losses.
·
Never
made profit.
2.
Table-4
-do-
·
Various
costs as % of sales.
·
Constantly
reducing sales.
3.
Table-5
Production and capacity
·
Reduced
sugar production.
Utilization.
·
Below
capacity utilization.
4.
Non
availability of cane; feasibility
report
·
Erroneous
assumption in PC 1
5.
Table-6
Sugarcane procured locally
·
Only
5 to 44% of plant's requirement
(of
185,000
tons) met locally.
6.
Table-7
Total procurement of cane.
·
Cane
crushing capacity = 1500
tons/day
normal
crushing season = 120
days.
·
Full
requirement of cane never
met.
·
During
1979-80, growers switched to
turmeric,
they also preferred
gurmaking
due to
its high price.
7
Table-8
Area-wise
procurement
of
·
Between
42% to 60% cane brought
from
sugar-cane
far-off
places.
·
Result
was
excessive
cost
of
transportation,
drying up of cane
(less
recovery
percentage).
8
Table-9
Cost of transportation
9% to
14% of cost of cane.
9
Table-10
Per ton cost of
·
Between
Rs.15 to 21.
transportation.
·
Double
the cost of other factories.
10
Table-4
P&L Account
·
High
percentage of sale
revenues.
Cane,
Chemical and
·
Include
increased cost of
transportation.
incidentals.
11
Table-4
Salaries, Wages and
·
Constantly
increasing as % of sales.
benefits.
·
Heavy
fixed cost due to:
-
normal increases.
-
increase in employee strength.
159
Financial
Statement Analysis-FIN621
VU
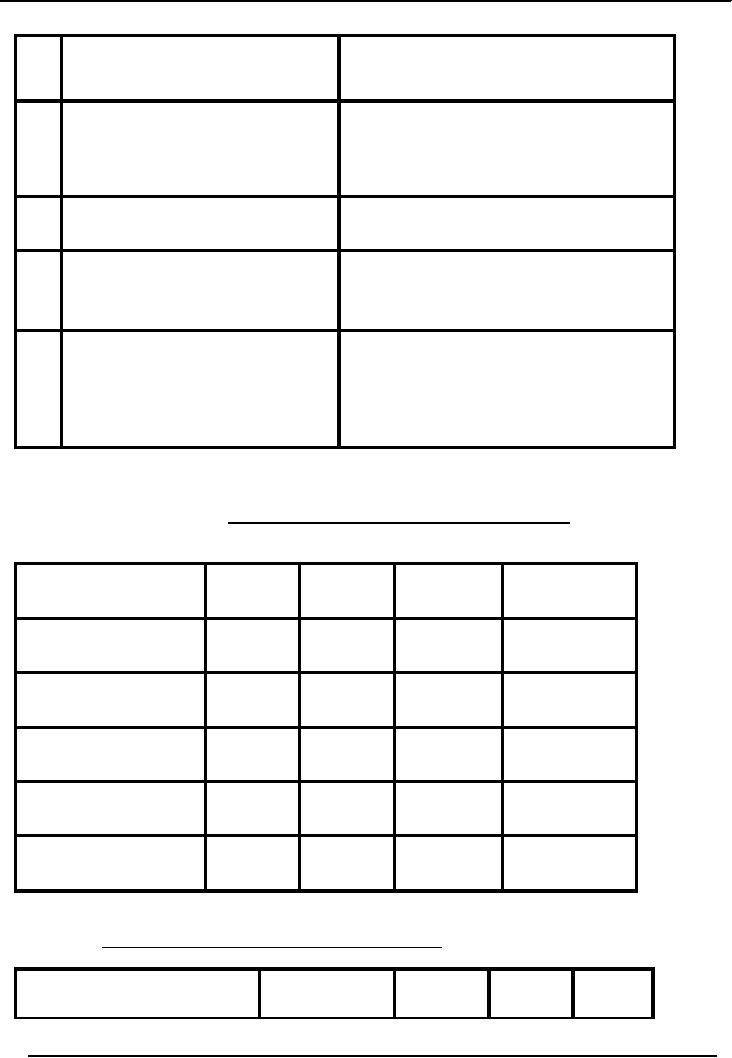
12
Table-11
Employees strength
·
53-73%
over PC1 strength/seasonal
staff
as
routine.
13
Table-12
Cost of establishment
·
Very
high due to:-
per
ton of sugar produced
-
excess employees.
-
reduced production.
14
Table-13
Productivity per employee
·
Decreasing.
15
Table-4
Administrative expenses
·
Increasing
as % of sales.
·
Excess
employee strength.
16
Table-4
Financial expenses
·
Increasing
as % of sales
Table-14
(range:
8% to 40%)
·
Why?
Because of increased debt
burden,
and
Unit's inability to pay
owing to
persisting
losses: vicious
circle.
Table-5
PRODUCTION
AND CAPACITY UTILISATION
TONS
1976-77
1977-78
1978-79
1979-80
Cane
crushing capacity
185,000
185,000
185,000
185,000
Cane
crushed
140,292
166,271
93,931
14,375
Capacity
utilization
76%
90%
51%
8%
Sugar
produced
11.344
14,015
8,007
1,206
%
recovery
8.08%
8.43%
8.55%
8.38%
Table-6
PROCUREMENT
OF SUGAR CANE LOCALLY
1976-77
1977-78
1978-79
1979-80
160
Financial
Statement Analysis-FIN621
VU
Quality
procured (Tons)
81,444
81,367
37,857
8,392
Procurement
as
%
of
total
44%
44%
20%
5%
requirements.
Table-7
TOTAL
PROCUREMENT OF SUGAR-CANE
1976-77
1977-78
1978-79
1979-80
·
Cane
procured (tons)
140,292
166,271
93,731
14,375
·
% of
requirement
76%
90%
51%
8%
Table-8
AREA-WISE
PROCUREMENT OF SUGAR-CANE
TONS
1976-77
1977-78
1978-79
1979-80
Qty
%
Qty
%
Qty
%
Qty
%
Sugar-cane
produced
from
· Local
area
40%
49%
37857
81367
58%
81444
58%
8392
17%
27%
15976
44415
20%
Distt.
28316
6%
801
·A
(200km
North)
20%
11%
19164
18361
9%
12395
17%
2439
·B
Distt.
(150km
14%
11%
12870
18268
12%
16707
18%
2627
South)
·C
Area
9%
7864
2%
3860
1%
(150km
East) 1430
1%
116
·D
Area
(300km
100%
100%
93,731
166,271
140,292
100%
100%
14,375
West)
Total:
161
Table of Contents:
- ACCOUNTING & ACCOUNTING PRINCIPLES
- Dual Aspect of Transactions
- Rules of Debit and Credit
- Steps in Accounting Cycle
- Preparing Balance Sheet from Trial Balance
- Business transactions
- Adjusting Entry to record Expenses on Fixed Assets
- Preparing Financial Statements
- Closing entries in Accounting Cycle
- Income Statement
- Balance Sheet
- Cash Flow Statement
- Preparing Cash Flows
- Additional Information (AI)
- Cash flow from Operating Activities
- Operating Activities portion of cash flow statement
- Cash flow from financing Activities
- Notes to Financial Statements
- Charging Costs of Inventory to Income Statement
- First-in-First - out (FIFO), Last-in-First-Out (LIFO)
- Depreciation Accounting Policies
- Accelerated-Depreciation method
- Auditors Report, Opinion, Certificate
- Management Discussion & Analyses (MD&A)
- TYPES OF BUSINESS ORGANIZATIONS
- Incorporation of business
- Authorized Share Capital, Issued Share Capital
- Book Values of equity, share
- SUMMARY
- SUMMARY
- Analysis of income statement and balance sheet:
- COMMON SIZE AND INDEX ANALYSIS
- ANALYSIS BY RATIOS
- ACTIVITY RATIOS
- Liquidity of Receivables
- LEVERAGE, DEBT RATIOS
- PROFITABILITY RATIOS
- Analysis by Preferred Stockholders
- Efficiency of operating cycle, process
- STOCKHOLDERS EQUITY SECTION OF THE BALANCE SHEET 1
- STOCKHOLDERS EQUITY SECTION OF THE BALANCE SHEET 2
- BALANCE SHEET AND INCOME STATEMENT RATIOS
- Financial Consultation Case Study
- ANALYSIS OF BALANCE SHEET & INCOME STATEMENT
- SUMMARY OF FINDGINS