 |
ACCEPTANCE SAMPLING:CHOOSING A PLAN, CONSUMERS AND PRODUCERS RISK |
| << QUALITY CONTROL & QUALITY ASSURANCE:INSPECTION, Control Chart |
| AGGREGATE PLANNING:Demand and Capacity Options >> |
Production
and Operations Management
MGT613
VU
Lesson
28
ACCEPTANCE
SAMPLING
Acceptance
sampling is an important form of
inspection applied to lots or
batches of items before or
after
a process, to judge conformance with
predetermined standards. Similarly
Sampling plans are
the
plans
that specify lot size,
sample size, number of samples,
and acceptance/rejection criteria
Single-sampling
Double-sampling
Multiple-sampling
Single
Sampling Characteristics
One
random is drawn from each
lot.
Every
item in the sample is
examined
Each
item after examination is
classified good or
defective.
If
the sample contains more than a specified
number of defectives say c, then that
lot is
rejected.
Double
Sampling Plan Characteristics
Takes
care of limitation of Single
Sampling Plan by taking another
sample if results of
the
initial
sample are
inconclusive.
If
results from second sample
also indicate poor quality
than the lot is rejected or
otherwise
decision
reached on the basis of both
samples.
A
double sampling plan specifies the
lot size, the size of the
initial sample, accept/reject
criteria
for
the initial sample, the size of the
second sample and a single
acceptance number.
With
double sampling plan, 2 values
are specified for number of
defective items, a lower
level
c1
and an upper level c2. E.g.
if we have c1 equal to 2 and c2 to 7, if number of
defects is
smaller
than c1 than sampling is
terminated and lot is
accepted.
If
defects are greater than c2,
than lot is rejected.
If
its between c1 and c2 then second
sample is selected and compared to a
third value c3 which
can
be 8 and if the cumulative defects
from 1 and 2 does not
exceeds c3, the lot is
accepted.
CHOOSING
A PLAN
Cost
and time are prime determinants of
choosing a plan.
Primary
considerations are number of samples
needed and total number of
observations
required.
Single
sample has only one
sample but large sample
size.
Where
the cost to obtain a sample is
high than cost of analyzing
the sample, single sample
plan
is
followed.
Where
inspection costs are higher
than costs of obtaining the
sample, multiple samples
are
carried
to ensure that a good or bad
result can help terminate
the sample testing thus
ensuring
savings
in inspection cost.
Multiple
Sampling Plans
Similar
to double sampling plan but
allows more than two
samples.
A
sampling plan will specify
each sample size and two
limits for each
sample.
The
values increase with number of
samples.
If
the cumulative number of defects ( in
current and previous samples)
exceed the upper
limit,
then
sampling is terminated and the lot is
rejected.
If
defects les than
permissible, lot is
accepted.
130
Production
and Operations Management
MGT613
VU
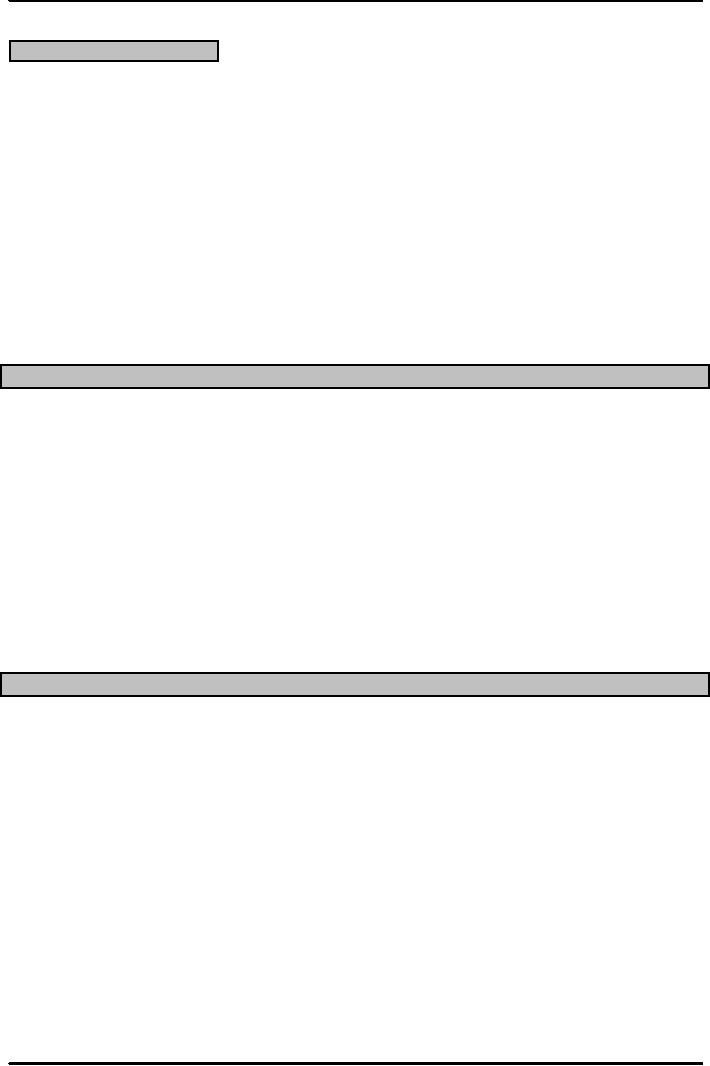
OPERATING
CHARACTERISTIC CURVE
Important
criteria of sampling plan
are how it discriminates between lots of
high and low quality.
The
ability of a Sampling Plan to
discriminate is described by its
OC.
The
degree to which a sampling
plan discriminates between good and bad
lots is a function of
steepness
of the curve
The
ideal plan would require
100 % inspection of each
lot.
OC
Curves
P
100%
R
OC
Curves come in
O
various
shapes
B
depending
on the
A
75%
sample
size and risk of
B
α
and
β
errors
I
L
50%
I
This
curve is more
T
discriminating
Y
O
25%
This
curve is less
F
discriminating
A
C
C
E
.03
.06
.09
P
T
Lot
Quality (Fraction
Defective)
I
N
G
L
O
T
The
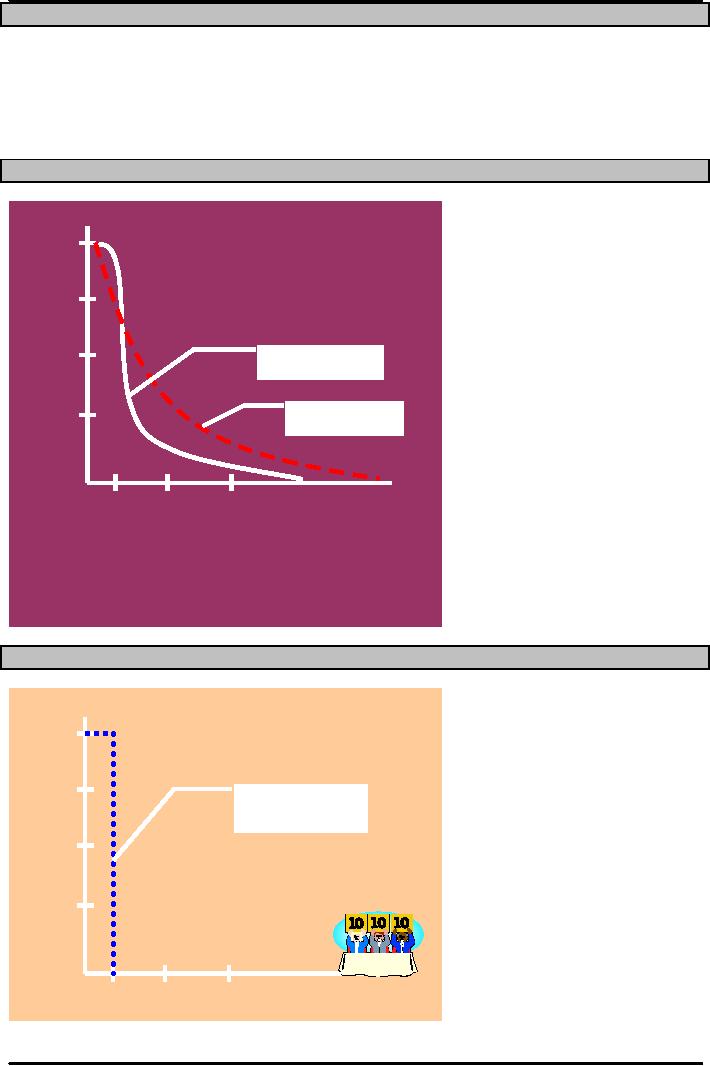
Perfect OC Curve
The
Perfect OC Curve
Pr
100%
o
ba
bil
ity
75%
This
curve distinguishes
of
perfectly
between good
A
and
bad lots.
cc
ep
50%
ti
n
What
would allow you
g
to
achieve a curve like
L
25%
this?
ot
.03
.06
.09
Lot
Quality (Fraction
Defective)
OC
Curve Terms
131
Production
and Operations Management
MGT613
VU
Acceptable
Quality Level (AQL):
Percentage of defective items a customer
is willing to accept
from
you
(a property of mfg.
process)
Lot
Tolerance Percent Defective
(LTPD): Upper limit on the
percentage of defects a customer
is
willing
to accept ( a property of the
consumer)
Average
Outgoing Quality (AOQ):Average of
rejected lots and accepted
lots
Average
Outgoing Quality Limit
(AOQL):Maximum AOQ for a range of
fractions defective
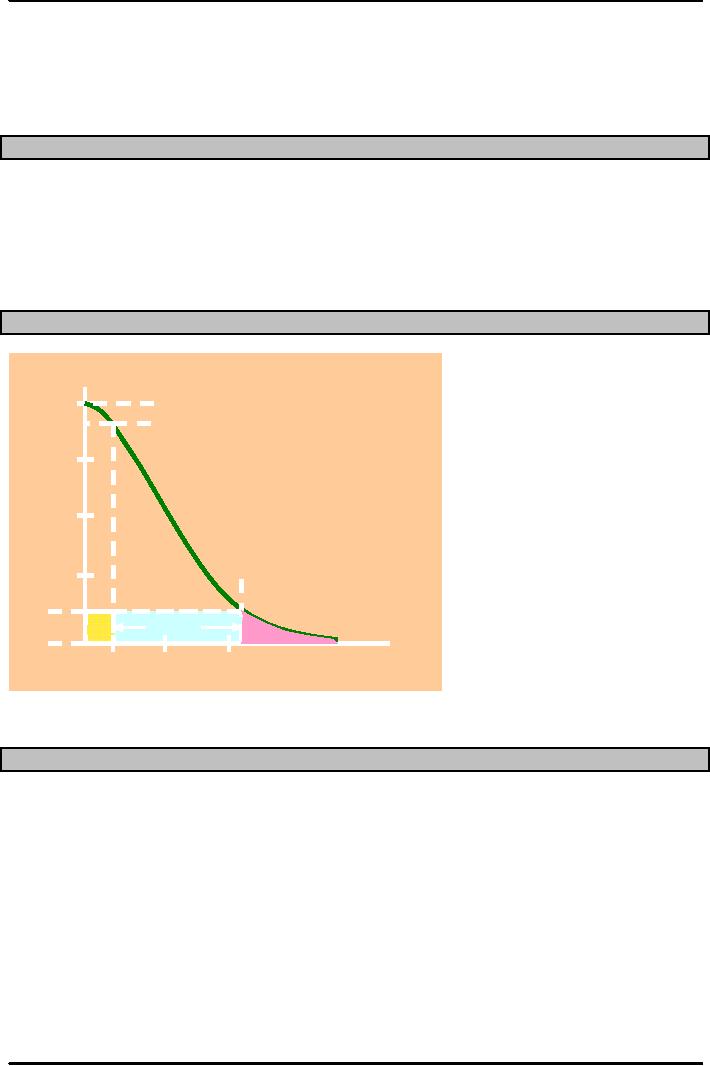
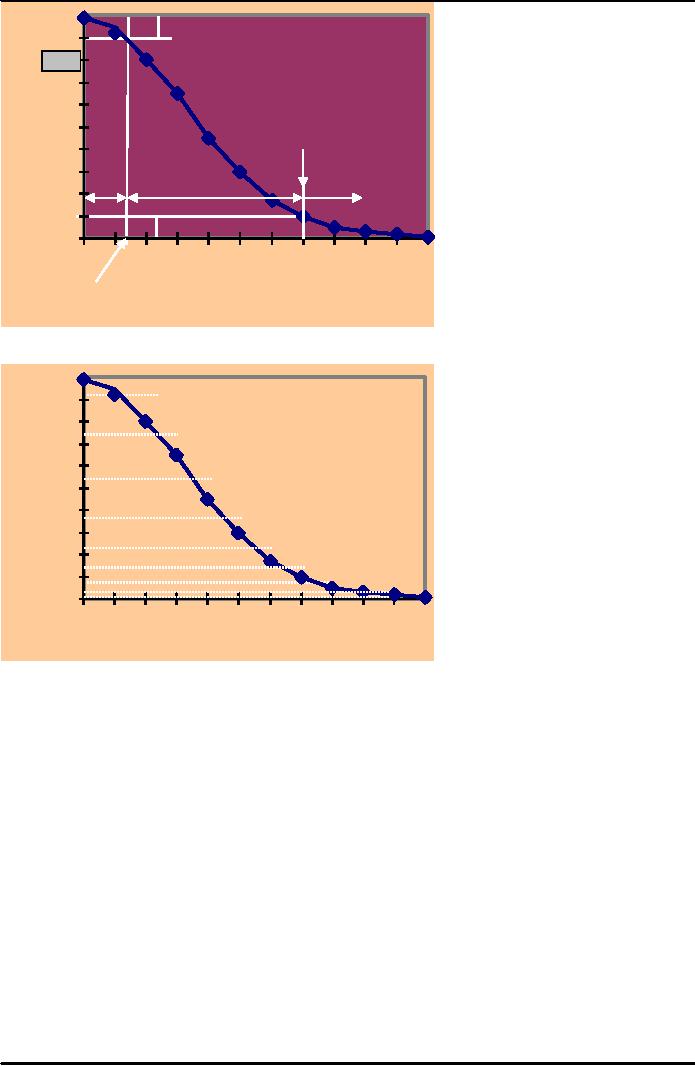
OC
The
curve shows the probability
that use of the sampling
plan will result in lots
with various
fractions
defective
being accepted. The graph
shows that the lot with 3
percent defects ( a fraction of 0.03)
would
have
a probability of about 0.9
being accepted , 90%. And
1-0.9 =0.1 ( 10% being
rejected)
As
the lot quality decreases, the
probability of acceptance decreases,
although the relationship is
not
linear.
OC
Definitions on the Curve
Pr
100%
α
=
0.10
o
90%
ba
bil
ity
75%
of
A
cc
ep
50%
ti
n
g
L
25%
LTPD
ot
AQL
β
=
0.10
Indifferent
Good
Bad
.03
.06
.09
Lot
Quality (Fraction
Defective)
OPERATING
CHARACTERISTIC CURVE
132
Production
and Operations Management
MGT613
VU
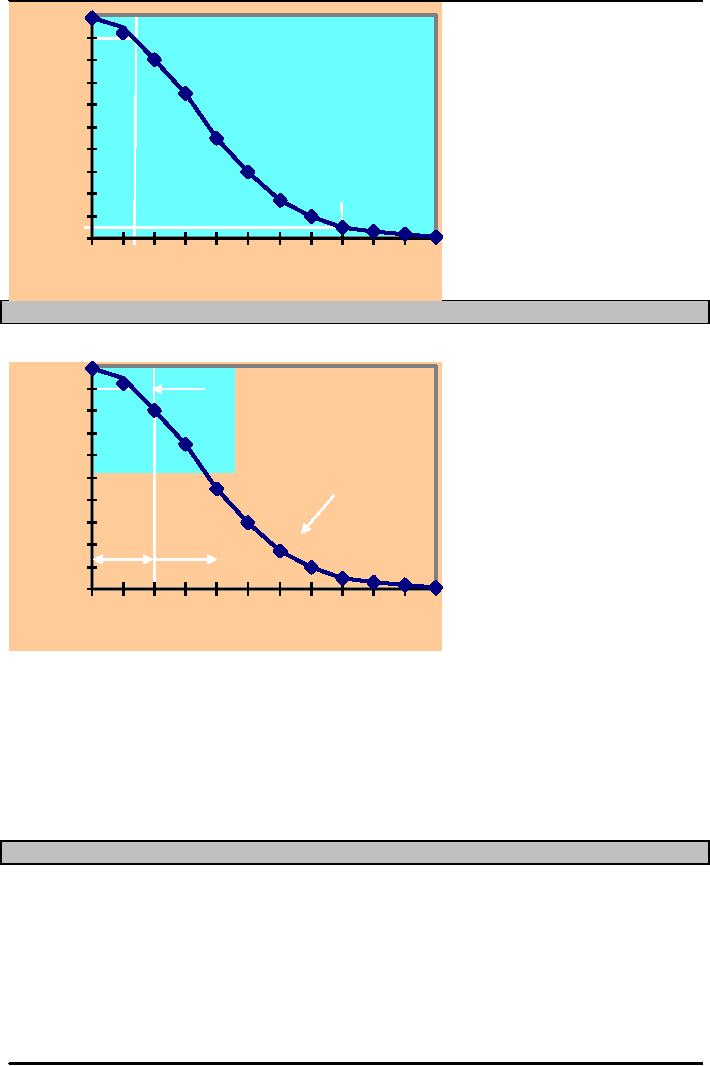
1
Pr
0.9
ob
0.8
ab
0.7
ilit
0.6
y
0.5
of
0.4
ac
0.3
ce
0.2
3
0.1
pti
0
ng
0
.05
.10
.15
.20
.25
Lot
quality (fraction
DECISION
CRITERIA
1.00
P
Idea
R
O
B
A
B
I
L
I
Not
very
T
Discriminatin
Y
OF
A
C
C
"Good
"Bad
E
P
T
I
0
N
G
LOT
Lot
quality (fraction
Sampling
Terms
Acceptance
quality level (AQL): the
percentage of defects at which
consumers are willing to
accept
lots
as "good"
Lot
tolerance percent defective (LTPD): the
upper limit on the percentage of
defects that a
consumer
is willing to accept
Consumer's
risk: the probability that a
lot contained defectives
exceeding the LTPD will
be
accepted
Producer's
risk: the probability that a
lot containing the acceptable
quality level will be
rejected
CONSUMER'S
AND PRODUCER'S RISK
133
Production
and Operations Management
MGT613
VU
1
α=
Proba
0.9
bility
of
0.8
accepti
ng
lot
0.7
0.6
0.5
LTP
0.4
0.3
Indifferen
"Bad
"Good
0.2
0.1
β=
0
.05
.10
.15
.20
.25
0
Lot
quality (fraction
defective)
AQ
1
.913
0.
Pr
0.
.736
ob
0.
ab
0.
.544
ilit
0.
y
0.
.375
of
0.
.244
ac
0.
.149
ce
.086
0.
pt
0
an
.1
.3
.4
.5
.20
0
Fraction
defective in lot
Average
Quality is the Average outgoing
quality (AOQ): Average of inspected
lots (100%) and un
inspected
lots
134
Table of Contents:
- INTRODUCTION TO PRODUCTION AND OPERATIONS MANAGEMENT
- INTRODUCTION TO PRODUCTION AND OPERATIONS MANAGEMENT:Decision Making
- INTRODUCTION TO PRODUCTION AND OPERATIONS MANAGEMENT:Strategy
- INTRODUCTION TO PRODUCTION AND OPERATIONS MANAGEMENT:Service Delivery System
- INTRODUCTION TO PRODUCTION AND OPERATIONS MANAGEMENT:Productivity
- INTRODUCTION TO PRODUCTION AND OPERATIONS MANAGEMENT:The Decision Process
- INTRODUCTION TO PRODUCTION AND OPERATIONS MANAGEMENT:Demand Management
- Roadmap to the Lecture:Fundamental Types of Forecasts, Finer Classification of Forecasts
- Time Series Forecasts:Techniques for Averaging, Simple Moving Average Solution
- The formula for the moving average is:Exponential Smoothing Model, Common Nonlinear Trends
- The formula for the moving average is:Major factors in design strategy
- The formula for the moving average is:Standardization, Mass Customization
- The formula for the moving average is:DESIGN STRATEGIES
- The formula for the moving average is:Measuring Reliability, AVAILABILITY
- The formula for the moving average is:Learning Objectives, Capacity Planning
- The formula for the moving average is:Efficiency and Utilization, Evaluating Alternatives
- The formula for the moving average is:Evaluating Alternatives, Financial Analysis
- PROCESS SELECTION:Types of Operation, Intermittent Processing
- PROCESS SELECTION:Basic Layout Types, Advantages of Product Layout
- PROCESS SELECTION:Cellular Layouts, Facilities Layouts, Importance of Layout Decisions
- DESIGN OF WORK SYSTEMS:Job Design, Specialization, Methods Analysis
- LOCATION PLANNING AND ANALYSIS:MANAGING GLOBAL OPERATIONS, Regional Factors
- MANAGEMENT OF QUALITY:Dimensions of Quality, Examples of Service Quality
- SERVICE QUALITY:Moments of Truth, Perceived Service Quality, Service Gap Analysis
- TOTAL QUALITY MANAGEMENT:Determinants of Quality, Responsibility for Quality
- TQM QUALITY:Six Sigma Team, PROCESS IMPROVEMENT
- QUALITY CONTROL & QUALITY ASSURANCE:INSPECTION, Control Chart
- ACCEPTANCE SAMPLING:CHOOSING A PLAN, CONSUMERS AND PRODUCERS RISK
- AGGREGATE PLANNING:Demand and Capacity Options
- AGGREGATE PLANNING:Aggregate Planning Relationships, Master Scheduling
- INVENTORY MANAGEMENT:Objective of Inventory Control, Inventory Counting Systems
- INVENTORY MANAGEMENT:ABC Classification System, Cycle Counting
- INVENTORY MANAGEMENT:Economic Production Quantity Assumptions
- INVENTORY MANAGEMENT:Independent and Dependent Demand
- INVENTORY MANAGEMENT:Capacity Planning, Manufacturing Resource Planning
- JUST IN TIME PRODUCTION SYSTEMS:Organizational and Operational Strategies
- JUST IN TIME PRODUCTION SYSTEMS:Operational Benefits, Kanban Formula
- JUST IN TIME PRODUCTION SYSTEMS:Secondary Goals, Tiered Supplier Network
- SUPPLY CHAIN MANAGEMENT:Logistics, Distribution Requirements Planning
- SUPPLY CHAIN MANAGEMENT:Supply Chain Benefits and Drawbacks
- SCHEDULING:High-Volume Systems, Load Chart, Hungarian Method
- SEQUENCING:Assumptions to Priority Rules, Scheduling Service Operations
- PROJECT MANAGEMENT:Project Life Cycle, Work Breakdown Structure
- PROJECT MANAGEMENT:Computing Algorithm, Project Crashing, Risk Management
- Waiting Lines:Queuing Analysis, System Characteristics, Priority Model