 |
TYPES OF BUDGET:Format of Cash Budget, |
| << FLEXIBLE BUDGET:ANALYSIS OF COST BEHAVIOR, Fixed Expenses |
| Complex Cash Budget & Flexible Budget:Comparing actual with original budget >> |

Cost
& Management Accounting
(MGT-402)
VU
changes
inversely with changes in
activity level Assume that
for an estimated activity
level of
50,000
machine hours budgeted factory
overhead is Rs. 150,000
which includes Rs 100.000 of
fixed
cost. The absorption rate
and its composition in this
case is as follow:
FOH
absorption rate:
Rs,
150,000/ 50.000 machine
hrs
=
Rs. 3 per machine hr.
The
fixed rate:
Rs.
100,000/50.000 machine hrs
=
Rs. 2 per machine hr.
The
variable rate:
Rs
3 per machine hr less Rs. 2
per machine hr = Rs. 1 per machine
hr.
It
is very easily understood
that Rs, 100.000 of fixed
factory overhead can be
absorbed only when
capacity
attained till the end of
year is 50,000 machine hours If
capacity attained is less
than the
budgeted
capacity it means an unfavorable
capacity variance, which
will be signified by unabsorbed
fixed
factory overhead. Assume
that the capacity attained
is 48,000 machine hours. At this
capacity
level
only Rs 96,000 of fixed
factory overhead is absorbed
(i.e. 48,000 hrs x Rs. 2)
and the under
absorbed
fixed cost of Rs 4,000(i.e.
Rs. 100,000 less Rs.
96,000) represents the
portion of factory
overhead
variance cause by unfavorable
capacity variance. Similarly, where
capacity attained is
more
than the budgeted capacity
it is a favorable capacity variance which
will be signified by over
absorbed
fixed factory overhead. In
other words capacity
variance can be computed by
multiplying
the
difference in capacity (budgeted and
attained) by the fixed rate.
The same result is obtained
by
taking.
the difference between
absorbed factory overhead
and budgeted factor*
overhead for
capacity
attained.
Budget/Spending
Variance
Budget
variance is the difference
between budgeted factory
overhead for capacity
attained and
actual
factory overhead incurred. It
represents either over-spending or
under-spending.
If
actual factory overhead is
more than the budgeted, it
is unfavorable budget variance. On
the
other
hand if actual factory
overhead is less than the
budgeted it is favorable budget
variance.
In
order to determine exact causes of budget
variance, the difference between
actual and budgeted
figures
of each item of factory
overhead is computed and
communicated to the responsible
person
for
the purpose of control. The
budget variance may be due to
fixed factory overhead items
or it
may
be due to the variable items
or the both.
Following
practice question explains the
computation and presentation of the
variance and its
analysis.
123

Cost
& Management Accounting
(MGT-402)
VU
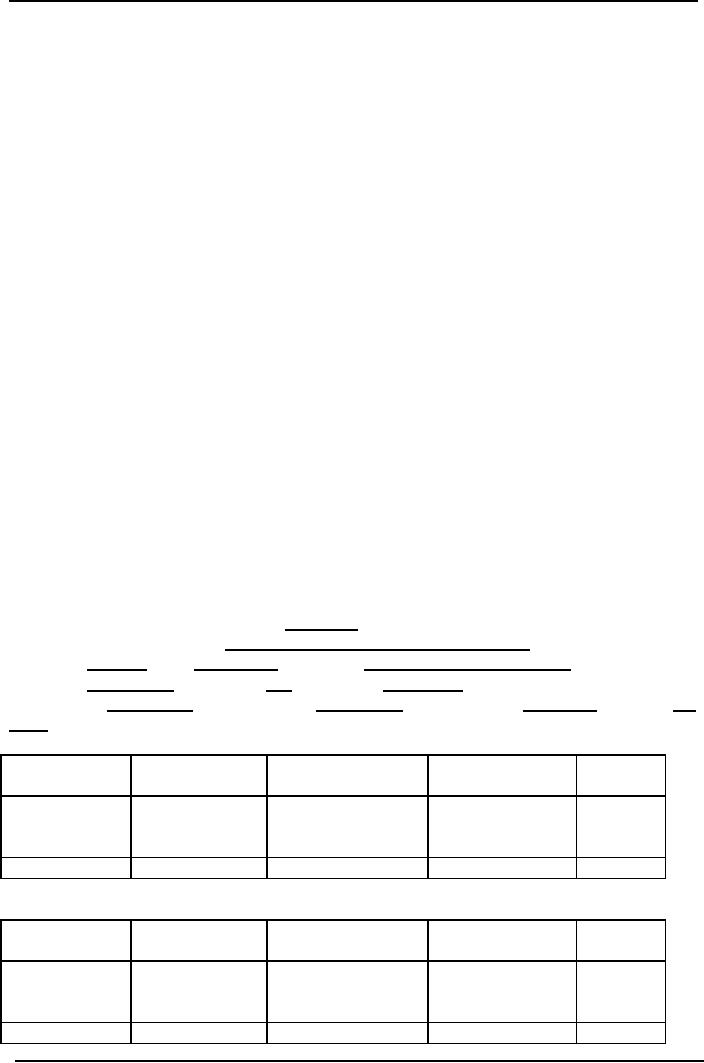
PRACTICE
QUESTION
Shahzewaz
Associates prepared following
estimates for the year
2006.
Fixed
factory overhead
Variable
factory overhead
Direct
labor hours Actual results
for the year 19xx
were as follow:
Fixed
factory overhead
Rs.
450,000
Variable
factory overhead
Rs.
600,000
Direct
labor hours
200,000
Required:
Calculate
(i)
Total
factory overhead
variance.
(ii)
Capacity
variance.
(iii)
Budget
variance.
Solution:
(i)
Total
Factory Overhead
Variance
Actual
factory overhead
Fixed
FOH + Variable FOH
Rs.
450.000 + Rs. 680,000
Rs.
1,130,000
Absorbed
factory overhead
Capacity
attained x Absorption
rate
220,000
hours x Rs. 5.25
1,155,000
Over
applied
25,000
(ii)
Capacity
Variance
Absorbed
factory overhead (220,000 x
5.25)
Rs.
1.155.000
Budgeted
factory overhead for
capacity attained
Fixed
factory overhead + (Capacity
attained x Variable rate)
(Rs.
450,000 + 220,000 hours x
Rs. 3)
1,110,000
Favorable
45,000
(iii)
Budget
Variance
Budgeted
factory overhead for
capacity attained
Rs.
1,110,000
Actual
factory overhead
1,130,000
Unfavorable
20,000
Supporting
Calculations
Absorption
rate = (Rs 450.000 + Rs.
600,000)
200.000
direct labor hours
=
Rs. 5.25 per direct labor
hour
Variable
rate
=
Rs. 600.000
2,00,0000
direct labor hours
=
Rs. 3 per direct labor
hour
It
should be remembered here
that no definite conclusions can be
drawn only on the basis
of
factory
overhead variance analysis, as
presented above Analysis of factory
overhead variance is a
part
of whole process of variance
analysis whereby direct materials
variance and direct
labor
variance
are also computed and
analysed. Complete study of variance
analysis is a part of
advanced
courses
of cost accounting.
In
the above practice question
capacity attained in terms of direct
labor hours is greater than
the
budgeted
capacity. This seemingly favorable
capacity variance may, in
fact, be due to
unfavorable
factors.
For example, direct labor
may be less efficient and as
a result same quantity of
output is
124

Cost
& Management Accounting
(MGT-402)
VU
produced
by working greater number of
hours, or it may be due to defective
materials which
require
more conversion time and as
such the hours worked over
and above the budgeted
capacity
have
not resulted in extra output Similarly an
unfavorable budget variance may be on
account of
higher
spending on preventive repairs
and maintenance or higher spending on
training of workers,
which
is in effect beneficial for the
organisation.
Here
a practice question is discussed to
explain High and Low
Point Method. This method is
a
technique
to segregate fixed and
variable portions of a
total/semi-variable cost.
Practice
Question
Predetermined
factory overhead absorption
rate computed by AI-Nasr
Associates Rs. 6 per
machine
hour. Budgeted factory
overhead for activity level
of 150.000 machine hours is
Rs.
800,000
and for activity level of
100,000 machine hours it is Rs.
700,000. Actual factory
overhead
incurred
during the year is Rs.
710,000 at an actual volume of
120,000 machine hours.
Required:
(i)
Variable
factory overhead absorption
rate.
(ii)
Budgeted
fixed factory
overhead,
(iii)
Budgeted
activity level on which the
absorption rate is
based
(iv)
Over
or under absorbed factory
overhead.
(v)
Volume
variance
(vi)
Spending
variance
Solution:
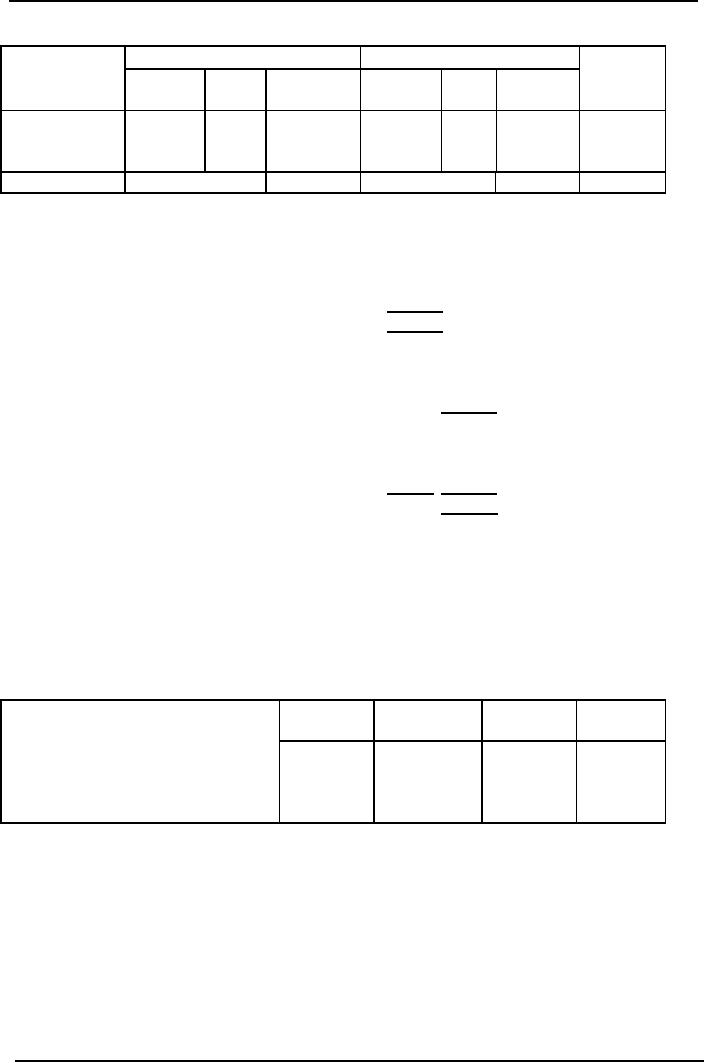
(i)
Variable
Factory Overhead Absorption Rate:
Activity
Level
Budgeted
FOH
(Machine
Hours)
(Rs.)
High
150,000
800,000
Low
100,000
700.000
50,000
100,000
For
a change of 50,000 machine hour's m
activity level there is a
change of Rs, 100,000
in
budgeted
factory overhead. This
change in budgeted factory
overhead is due to variable
factory
overhead.
Therefore,
Variable
rate
=
Change
in budgeted FOH
Change
in activity level
Rs
100,000/50,000 machine hours
Rs.
2 per machine hour
125

Cost
& Management Accounting
(MGT-402)
VU
(ii)
Budgeted Fixed Factory
Overhead:
Total
FOH for 150,000 machine
hours
=
Rs. 800.000
Budgeted
variable FOH = 150,000 hrs Rs
2
=
Rs. 300,000
Budgeted
fixed FOH = Rs 800.000 less
Rs. 300,000
=
Rs. 500.000
OR
Total
FOH for 100.000 machine
hours
=
Rs 700.000
Budgeted
variable FOH =100.000 hrs x Rs.
2
=
Rs 200.000
Budgeted
fixed FOH = Rs, 700.000 less
Rs. 200,000
=Rs.
500.000
(iii)Budgeted
Activity Level
Budgeted
activity level = Fixed FOH
Fixed
rate
=
Rs. 500.000/ (Rs. 6 less
Rs. 2)
=125,000
machine hours
(iv)
Over or under absorbed
Factory Overhead:
Actual
factory overhead
Rs.
710.000
Absorbed
factory overhead
Actual
volume x FOH absorption
rate
120,000
hrs x Rs. 6
720.000
Over
absorbed
10,000
(v)
Volume
Variance:
Absorbed
factory overhead
Rs.
720,000
Budgeted
FOH for actual volume
Fixed
FOH + (Actual volume x Variable
rate)
Rs,
500.000 + (120.000 hrs, x
Rs. 2)
740,000
Unfavorable
20,000
(vi)
Spending
Variance:
Budgeted
FOH for actual volume
Rs.
740,000
Actual
factory overhead
710,000
Favorable
30,000
126

Cost
& Management Accounting
(MGT-402)
VU
LESSON#
18
JOB
ORDER COSTING
SYSTEM
It
has been explained that a
cost accounting system is
composed of two
sub-systems:
(i)
A
system of recording and summarizing
costs and
(ii)
A
costing system.
Costing
system means "the
ascertainment of costs ", It includes
determination of total cost as
well as
unit
cost. A costing system determines
and reports to management
total and unit cost of
product
or
project of service with
details of cost
components
Costing
is compulsory for satisfying at least
three important needs of
management.
I.
Unit cost must be known to
assist the management in making
price decisions.
II.
Ascertainment of cost at every stage of
production is important for
exercising control
over
costs.
III.
In order to operate a system of
accounting for costs,
management needs to know
cost of
materials,
labor and overhead to be
charged to work in process,
cost of work completed
and
transferred to finished goods
and the cost of goods sold
so that necessary debit
and
credit
entries can be
passed.
Choice
of a Costing System
Job
Order Costing or Process
Costing?
What
type of costing system an accounting
entity should adopt? It
depends upon:
(1)
Nature
of operations and
(2)
Information
needs of management.
Take
the example of a construction
company that produces houses
in response to customers'
orders
and according to their
specifications. All the
times, the company remains
engaged in the
construction
of many houses at different
sites for different customers.
Such a company
definitely
wants
to know the cost incurred on
each house separately so
that customers' can be billed
properly
and
profit (or loss) on each
contract may be ascertained.
Here the nature of operations is such
that
each
house is clearly distinguishable from the
other and separate
calculation of cost for each
house
is
desirable and practically possible.
This company will employ
job costing system.
On
the other hand take
the example of a company
producing cement. All of the
bags of cement
produced
are quite similar. Here
separate calculation of cost of cement
supplied to each
customer
is neither desirable nor
feasible. The company can
calculate cost per bag of
cement
produced
by dividing total cost
incurred during the
accounting period by total number of
bags
produced
during the period.
Accordingly,
the company can fix
the price per bag
and bill each customer
according to the
number
of bags supplied to him. This
company will use process
costing system.
Job
costing and process costing are
two basic types of costing
systems and can be
viewed
as
two ends of a spectrum or range. In
practice we find companies
employing either one of
these
two or some combination of
features of the two both of
these at the same time.
For
example,
a ready made garments
manufacturer employs process costing to
accumulate and
determine
the cost of free size shirts
produced by him in large quantity. At
the same time he
uses
job costing to accumulate the
cost of waiters' uniforms supplied to a
hotel under a
contract.
Job
costing may be
defined:
The
costing system that separately
accumulates costs incurred to produce each job in a
situation where each job is
distinguishable
from the other throughout the
production process.
The
job may be a single unit or
a multi unit batch, a contract or a
project, program or a service.
Job
costing
is employed by organisations possessing
following characteristics:
1.
Production is generally in response of customers'
orders.
2.
Every order has its own
manufacturing specifications. Therefore,
every job is different from
the
other
and requires different
amounts materials, labor and
overhead.
127

Cost
& Management Accounting
(MGT-402)
VU
3.
Each job is clearly distinguishable from
the other at all stages
production process which
makes
job-wise
accumulation of possible.
4.
Job-wise accumulation of cost is
desirable and/or necessary
for and profit determination
and
5.
Each job is generally of high
value.
Following
are the examples of
organisations employing job costing
include:
a)
Accounting firms
b)
Civil engineering
c)
Furniture manufacturing
d)
Medical care
e)
Printing press
f)
Ship-building
g)
Advertising agencies
h)
Computer programming
i)
Jewellery manufacturing
j)
Movie studios
k)
Repair shops
As
the costs are accumulated
separately for each job,
therefore, job costing requires
considerable
amount
of clerical work. Where production is
carried in different departments of a
factory,
department
wise cost accumulation is
also necessary for
performance evaluation of
departmental
management.
In this way clerical work is
further increased. Consequently,
job costing is more
expensive
as
compared with process costing.
Job costing is also called
specific order costing or
production
order costing.
Job
order costing
procedures
Most
of the times, organisations
employing job order costing
are required to submit
quotation
before
finalization of customer's order.
Therefore, naturally, the
first step in job order
costing is to
prepare
an estimate of cost likely to be
incurred to produce the job.
The estimation is done by
coordination
of sales, designing and
production departments. On the basis of
estimated cost price
is
quoted. When customer's order has
been initialized production
planning and control
department
takes the first step towards
execution of the
order.
On
receipt of production order,
cost accounting department
prepares a job cost sheet
for each
job.
Job cost sheet may be
defined as a
document used for accumulating costs
incurred to produce a job.
Design
and contents of job cost
sheet vary widely depending
on customs of manufacturing
operations
and information needs of
management.
However,
generally, a job cost sheet is
designed to show the
following information:
1.
Job number
2.
Name of the customer
3.
Description and specifications of
the job
4.
Date of commencement of production
5.
Date of completion of job.
6.
Direct materials cost
incurred on the job
7.
Direct labor cost incurred
on the job
8.
Factory overhead applied to
the job
9.
Total cost of the
job
10.
Selling and administration
expenses chargeable to the
job
11.
Sales price of the
job
12.
Profit (or loss) on the
job
13.
Where the job consists of a batch,
the quantity produced and
unit cost
14.
Where cost estimates are
prepared before production, estimated
cost should also be shown
for
comparison
and efficiency
evaluation.
128

Cost
& Management Accounting
(MGT-402)
VU
Job
cost sheet is one of the
basic
documents used
in job order costing. Upto
the time the job
is
incomplete;
job
cost sheet serves as a
subsidiary
record .for work in process control
account and is
placed in
work
in process subsidiary ledger. On
completion
of
job, the relevant job
cost sheet is removed
from
work in process subsidiary
ledger.
Now
it reveals the cost of completed
job and serves as source
document for
debiting finished goods
account
(or completed jobs control account)
and for crediting work in
process account.
Then
it is placed in finished goods
subsidiary ledger and serves
as subsidiary
record .for finished
goods
account.
When
completed job is shipped to the
customer, relevant job cost
sheet serves as source
document
for
debiting cost of goods sold account
and for crediting finished
goods account. Then
it
is
placed in cost of goods sold
subsidiary ledger where the
same job cost sheet
serves as subsidiary
record
for cost of goods sold
account.
Manufacturing
process is, most of the
times, divided into departments. This
departmentalization
is
the logical result of different
types of operations performed to produce a
product. For example,
furniture
manufacturing is divided into cutting,
assembling and finishing and
polishing
departments;
readymade garments manufacturing is
divided into cutting, stitching
finishing and
packing
departments.
These
departments are regarded as cost
centers. Cost
Centre means
a
division or segment for which
a
separate
individual is made responsible .for
incurrence of cost. Accumulation
of cost for each department
is
necessary
to achieve better control
over cost. In job order
costing it is necessary to identify
cost
not
only with the department
but also with the
relevant job.
Direct
materials, direct labor and
factory overhead to be charged to
each job and to
each
department
are recorded in the
following manners:
Direct
Materials: Every
materials requisition issued to
secure direct materials bears
the name of
department
and job number for
which materials are required.
Periodically (weekly or fortnightly
etc)
a summary of materials requisitions is
prepared. Materials requisition
summary analyses cost
of
materials issued and
ascertains cost of materials
chargeable to each department
and to each job.
Indirect
materials issued cannot be
associated with particular jobs,
therefore, these are
summarised
only
by department. Instead of posting each
individual materials issue to
job cost sheets,
the
periodic
totals are recorded on
relevant job cost
sheets.
The
periodic
grand total are
debited to work in process
and factory overhead
-control accounts and
credited
to materials control
account.
Direct
Labor: Primary
labor cost data are
accumulated on Job Time Tickets.
Job time tickets
contain
names of departments and job
numbers for which labor
time is used. A labor cost
analysis
sheet
is prepared periodically that analyses
the direct labor cost by departments
and by jobs. As
indirect
labor cost cannot be
identified with particular jobs,
therefore, labor cost
analysis sheet
analyses
it only by departments. The periodic
totals are
posted to job cost sheets
and debited to
work
in process and factory
overhead control accounts.
Factory
Overhead:
Factory overhead is applied to jobs on
the basis of predetermined
departmental
factory overhead applied
rates. Factory overhead is
also periodically
applied
to the
jobs
and entered in job cost
sheets. Total applied
factory overhead is debited to
work in process
control
account and credited to
factory overhead applied
account.
Practice
Question
Job
Order Costing. Shah
Taj Engineering Works on April 5,
2006 started production of
100 lawn
mower
of model EG- 72 ordered by
Capital Development Authority.
Islamabad, vide Order
No.
2119-M
dated April 1, 2006 at a
price of Rs. 3,600 per
lawn mower.
Production
Planning Department allotted
Job No. J-832-LM and
instructed the factory
to
complete
production by April 20,
2006. However, the factory
completed production on April
18,
2006.
129
Cost
& Management Accounting
(MGT-402)
VU
On
April 11, weekly Materials Requisitions
Summary. No. MRS-16 and
weekly Labor Cost
Analysis
Sheet No.LAS-16 showed
following charges to Job No.
J-832-LM.
.
Department
101
Department
102
Direct
materials
Rs.
58,500
11,700
Direct
labor
Rs.
13,500
15,750
(900
hours)
Materials
Requisitions Summary No. MRS-17 and
Labor Cost Analysis Sheet
No. LAS-17
prepared
on April 18 revealed following direct
costs for the
job.
Department
101
Department
102
Direct
materials
Rs.71,500
Rs.
14,300
Direct
labor
Rs.
16,500
Rs.
19,250
(1100
hours)
In
department 101 factory
overhead is applied @ 50% of direct
labor cost and in department
102
@
Rs. 12 per direct labor
hour. Marketing and
administration expenses chargeable to
the job were
respectively
7.5 % and 5% of the sale
price. The lawn mowers were
delivered to customer on
April
22,
2006
Required:
(i)
Prepare a Job Cost Sheet
for Job No.
J-832-LM.
(ii)
Assuming that J-832-LM was
the only job worked on
during the two weeks period,
pass
account
entries in General Journal form to
record:
(a)
Cost incurred on the
job:
(b)
Completion of the job;
and
(c)
Sale of the job.
Solution
SHAH
TAJ ENGINEERING WORKS LIMITED
JOB
COST SHEET FOR JOB NO.
J-832-LM
Customer's
Name:
Capital
Development Authority.
Islamabad.
Order
No. 2119-M Dated 02-04-2006
Description Lawn Mowers
Model EG- 72
Total
Cost Rs. 260.000 No. of
units. 100Date Started
05-04-2006
Date
wanted 20-04-2006 Date Completed 18-04-2006
Unit Sales Price Rs.
3,600 Unit Cost
Rs.
2,600
DIRECT
MATERIALS
Date
Mat.
Req. Sum. Department
101
Department
102
Total
No
11-04-2006
MRS-16
Rs.
58,500
11,700
70,200
18-04-2006
MRS-17
71,500
14,300
85,800
Total
130,000
26,000
156,000
DIRECT
LABOR
Date
Lab
Analysis
Department 101
Department
102
Total
Sheet
No.
11-04-2006
LAS-16
Rs.
13,500
15,750
29,250
18-04-2006
LAS-17
16,500
19,250
35,750
Total
30,000
35,000
65,000
130
Cost
& Management Accounting
(MGT-402)
VU
FACTORY
OVERHEAD APPLIED
Date
Department
101
Department
102
Total
D.L
Rate
Amount
D.L
Rate
Amount
Cost
Hours
11-04-2006
13,500
50%
6,750
900
12
10,800
17,750
18-04-2006
16,500
50%
8,250
1,100
12
13,200
21,450
Total
15,000
24,000
39,000
Total
Production Cost
Direct
material cost
156,000
Direct
labor cost
65,000
Factory
overhead cost
39,000
260,000
Income
Statement
Sales
price 100 units @ Rs.
3,600
360,000
Cost
of production
260,000
Gross
profit
100,000
Operating
expenses
Marketing
Expenses (Rs. 360,000 x
7.5%)
27,000
Administration
Expenses (Rs. 360,000 x 5%)
18,000
45,000
Net
Income/profit
55,000
Problem
Questions
Q.
1
Arman
Advertisers on November 15, 2006
received an order from
Pheasent Cosmetics Limited
for
manufacturing
and installation of a huge
neon sign for a contract
price of Rs. 180,000. Job
No.
676-PN
was allotted and
manufacturing was begun on November
21, 2006 .The costs
are charged
to
the jobs periodically by means of weekly
summaries.
Following
costs were related to Job
No. 676-PN
WEEK
ENDED
Nov.
23
Nov.
30
Dec.7
Dec.
14
Rs.
Rs.
Rs.
Rs.
Direct
materials
13,300
24,800
16,400
12,600
Direct
labor
1,800
12,400
20,100
14,200
Factory
overhead is applied @ 25% of
prime cost. The Job
was completed on December 14,
2006
Selling
expenses are applied to the
job @ 3 % of contract price
and administration expenses @
2%
of
contract price.
Required:
Prepare a job cost sheet
containing above
information
Q.
2
In
order to submit quotation
for air conditioning of Hina
Shopping Centre, management of
Indus
Electrical
Industries made following
estimates:
Direct
materials Rs.
280,000;
Direct
labor Rs. 120,000;
Predetermined
overhead applied rate is 50%
of direct labor cost;
131

Cost
& Management Accounting
(MGT-402)
VU
Predetermined
rates for charging marketing and
administration expenses are respectively
3% and
2%
of the contract
price.
On
the basis of above estimates
contract price was quoted as
Rs. 575,000
The
quotation was accepted by
the owners of Hina Shopping Centre and
the order was
finalized
on
October 6, 2006.
Job
No. 1617 was assigned to
the order and the
work was started on October
12, 2006. Weekly
materials
requisition summaries and
labor cost analysis sheets
showed following charges to
Job
No.
1617.
Date
Direct
Material
Direct
labor
October
17
Rs.
120,000
Rs.
46,000
October
24
Rs.
96,000
Rs.
44,000
October
31
Rs.
60,000
Rs.
48,000
The
job was completed on October
31. However, the time
allowed for completion of job
was upto
November
4.
Required
(i)
Prepare
job cost sheet for
Job No. 1617.
(ii)
Assuming
that Job No. 1617
was the only job
worked on during the above
period, pass
entries
in general journal form to record
production and sale of the
job. Job was accepted by
the
customer
on November 4 and cash
received for the contract
price.
Q.
3
Hussain
Engineering Co. Ltd. produces
machines as per customer's
specifications. The
following
data
pertains to Job Order No. K
101:
Customer:
Azam Banking Co.
Date
Started: 06-08-2006.
Customer
Order No. C 467.
Date
Finished: 20-08-2006.
Dated:
31-07-2006. Total Cost of
manufacture?
Sales
Price?
Description:
6 Banking Machines.
Week
End 13/08
Week
End 20/08
Materials
used. Dept. A.
Rs.
4,800
Rs.
2,600
Direct
labor rate. Dept. A.
Rs
40 per hour
Rs.
40 per hour
Labor
hours used, Dept. A.
1,200
800
Direct
labor rate, Dept. B.
Rs
42 per hour
Rs.
42 per hour
Labor
hour uses, Dept. B.
600
280
Machine
hours. Dept. B.
400
240
Applied
factory overhead Dept. A.
Rs. 20/labor hr.
Rs.
20/labor hr.
Applied
factory overhead Dept. B Rs.
18/machine hr
Rs.18/machine
hr
Marketing
and administrative costs are
charged to each order @ 20%
of the cost to
manufacture
Required:
a)
Prepare
a job order cost
sheet
b)
Calculate
sales price of the job,
assuming that it has been
contracted with a
markup
of 40%
132

Cost
& Management Accounting
(MGT-402)
VU
LESSON#
19
PROCESS
COSTING SYSTEM
(An
introduction)
Definition
Process
costing system applies when
standardised goods are produced
tom a series of
inter-
connected
operations.
In
some industries, the output produced
emerges from a continuous
process. An example might
be
an
oil refinery; Oil in a raw
state is input and subjected
to a process of purification. Refined
oil
emerges
at the end of the
process.
Problems
that arise in such situations include
the attribution of materials
costs and conversion
costs
to units of finished output
and the occurrence of losses
during the process (spoilt
or lost
production).
The
characteristics and application of
process costing
Continuous
production
In
the job order costing, costs
were directly allocated to a
particular job. When
standardised goods
or
services result from a
sequence of repetitive and continuous
operations, it is useful to work
out
the
cost of each operation. Then
because every unit produced may be
assumed to have
involved
the
same amount of work, costs
for a period are charged to
processes or operations, and unit
costs
are
ascertained by dividing process
costs by the quantity of
output units produced This is
know n
as
process costing.
Series
of interconnected operations
Process
costing applies when standardised
goods are produced from a
series of interconnected
operations.
Process costing system is employed by industries
possessing following
characteristics:
1.
There is mass production of a
single product or two or
more products in successive
runs
of
scheduled duration e.g.,
vegetable canning or fruit juice
bottling.
2.
All units of output are
exactly similar and are produced by the
same manufacturing
process.
3.
Entire manufacturing process is divided
into departments or processes, each
performing a
specific
set of operations.
4.
Completed output of each department,
except the last one, is the
raw materials for the
next
department.
5.
Manufacturing operations may result in
production of joint products or by
products.
6.
Production is not in response to
customers' orders but in anticipation of
demand.
Examples
of industries using
Process Costing include:
Bottling,
Pharmaceuticals, Cement, Paint, Coal, Distilleries
Electricity, Ice, Soap,
Sugar, Canning,
Chemicals,
Cooking oil, Electric
appliances, Flour, Natural
gas, Petroleum Products, Rubber,
Steel,
Textile.
Under process costing, for
the purpose of cost control,
each department involved
in
manufacturing
process is regarded as a cost centre
and product costs are
accumulated separately
for
each department. Cost
Centre means a
division or segment for which an
individual is made responsible
.for
the incurrence of cost
Departmental
costs are passed through
department work in process accounts
and not through a
single
work in process control
account as in job costing. As all
units are produced from the
same
raw
materials and by same
manufacturing operations, therefore, it is
assumed that same cost
is
chargeable
to each unit. Instead of accumulating
cost of individual units, an
average unit cost is
computed
by dividing total cost by
total output of the period.
Cost is associated only
with
departments
and not with jobs. It
reduces clerical efforts for
accumulation and analysis of
cost. In
this
way process costing is less
expensive, as
compared with job
costing.
133
Cost
& Management Accounting
(MGT-402)
VU
The
Process Cost Sheet also
called Cost
of Production Report is the
basic document in process
costing.
This document is prepared
for each department and
shows the quantities processed,
total
and
unit cost, and cost of
work transferred out, and
still in process. .
Following
table is meant to make the
difference between the two
costing systems more
clear.
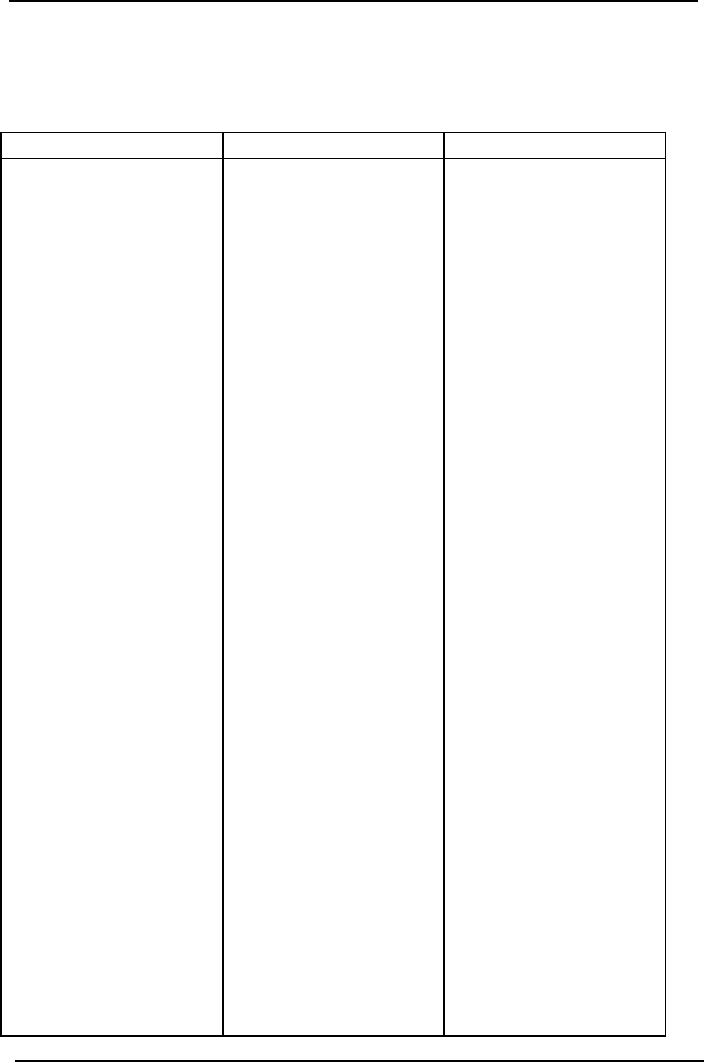
Job
order costing system
Process
costing system
Where
different products
Application
Where
single standard
having
peculiar
product
is produced or
specifications
are produced
two
or more standard
against
customers' orders
products
are produced in
successive
runs.
Production
is for stock
and
in anticipation of
demand.
In
order to determine cost
Accumulation
of Cost
of
each job, costs
are
Costs
are associated
only
compiled
job wise. At the
same
time, to evaluate
with
departments
efficiency
of departmental
management
cost are also
compiled
department wise
Unit
cost is computed on
completion
of job. The job
may
itself be a single
cost
Cost
per unit
unit
e.g. a machine or it may
An
average unit cost is
be
a multi unit
computed
at the end of
costing
period by dividing
total
cost by units of
output
Only
one work in process
of
the period.
control
account is
maintained
A
separate work in process
control
account
is
More
clerical efforts are
Work
in process a/c
maintained
for
each
needed
to accumulate costs
producing
department
by
jobs and by departments,-
therefore,
the system is more
Cost
accumulation is simple
expensive
as
costs are accumulated
only
Cost
of operating the system
by
departments; therefore,
the
system is comparatively
less
expensive.
134

Cost
& Management Accounting
(MGT-402)
VU
Process
costing procedures
In
process costing industries standard
products are produced in accordance
with production
budget.
Therefore, it becomes unnecessary to
issue a production order.
Production Planning
and
Control
Department communicates production
targets to departmental heads by means of
written
letters.
Data of quantities produced by each department are
collected and compared with
budgeted
quantities
for control purposes. These
information are collected by departmental
supervisors or
quality
inspectors may recording these
data. Each producing department is a
cost centre because
for
the purpose of cost control
management is interested in ascertaining
departmental costs.
In
process costing, generally, a separate
work in process account is maintained
for each producing
department.
Data
Collection
Collection
of departmental cost figures of direct materials,
direct labor and factory
overhead is
based
on similar procedure as for, job order
costing. However, the source
documents used for
the
data
collection are comparatively simple.
These documents identify
costs only with
departments
and
not with jobs as
well.
Direct
Materials:
Production
people secure materials by
issuing properly authorised Materials
Requisitions. At the
end
of each month, these requisitions
are sorted and a Materials Requisition
Summary indicating
cost
of direct and indirect materials
issued to each department is
prepared. Monthly totals
of
direct
and indirect materials
issued are debited to departmental
work in process control
accounts
and
factory overhead control
account respectively and credited to
materials control
account.
Direct
Labor:
Instead
of using Job Time Tickets,
labor cost data are
accumulated on Clock Cards and
Daily
Time
Sheets. These documents show
labor time utilized by each
department and classification of
labor
cost as direct and indirect. At
the end of each month,
labor cost data accumulated on
these
source
documents are summarised in
Labor Cost Analysis Sheet indicating
direct and indirect
labor
cost for each department.
Monthly totals of direct labor
are debited to departmental work
in
process
accounts and indirect labor is
debited to factory overhead
control account.
Factory
Overhead:
Factory
overhead costs, other than
indirect materials and
indirect labor discussed earlier,
are
accumulated
in Voucher Register and in General
Journal by means of adjusting entries
for
depreciation,
expired insurance etc, Monthly
total, are debited to
factory overhead
control
account.
Factory
overhead is charged to production
through predetermined departmental factory
overhead
applied
rates. Some industries using process
costing charge actual factory
overhead to
departments.
This method gives satisfactory results if
production is stable from
month to month,
But
if there are fluctuations in
production volume, charge of
actual factory overhead
is
unsatisfactory
especially when considerable
portion of factory overhead is a
fixed cost,
Cost
of Completed Output:
Cost
of completed output of each production
department is calculated in Cost of
Production
Report.
Cost of units completed and
transferred out is credited to
work in process control
account
of
the respective department
and debited to work in
process control account of
the department
receiving
the units. Cost transferred
out by the last department
is, however, debited to
finished
goods
control account
135

Cost
& Management Accounting
(MGT-402)
VU
Cost
of Production Report
In
process costing Cost of Production
Report also called Process
Cost Sheet is the
key
document.
At the end of costing period, generally a
month, a Cost of Production
Report is
prepared.
It summarizes the data of
quantity produced and cost
incurred by each
producing
department.
It also serves as a source
document for passing
accounting entries at the
end of
costing
period.
Cost
of production report is divided into
five
sections.
Each section is meant to provide
specific
information.
A brief description of these sections is
presented below:
1.
Quantity
schedule.
2.
Cost
accumulated in the department/process.
3.
Calculation
of equivalent units produced.
4.
Calculation
of cost per unit.
5.
Accounting
treatment / apportionment of the accumulated
cost
Quantity
Schedule:
The
first section Quantity
Schedule contains input and
output data in terms of quantities.
The
information
is presented in the following
order.
(i)
Units
in process at the beginning of costing
period.
(ii)
Units
started in process or received
from preceding department
during the period.
(Total
of (i) and (ii) constitutes
total units to be accounted
for)
(iii)
Units
completed and transferred to next
department or to finished
goods.
(iv)
Units
completed but still in the
department.
(v)
Units
in process at the end of the
period and their degree of
completion.
(vi)
Units
lost in process during the
period indicating whether normal loss or
abnormal loss.
The
stage of completion at which
the loss occurs is also
specified.
(Total
of (iii) , (iv) , (v) and
(vi) is again the total
units to be accounted for)
The
quantity schedule assists
management to look at a glance
production performance of
departments
as well as it provides necessary data
for preparing remaining sections of the
report.
Cost
accumulated in the department/process.
The
second section Cost
Accumulated to Departments shows
total cost for which
the
departments
are accountable. Total costs
include cost of beginning work in
process inventory,
cost
transferred in from the
preceding department and
cost of direct materials, direct labor
and
factory
overhead added by the
department. If there is normal
loss of units, unit cost
received
from
preceding department requires
adjustment. This adjustment
for lost units is also
shown in
this
section. This section provides
data for debiting work in
process control accounts of
the
departments.
Calculation
of equivalent units produced.
In
order to arrive at cost per
unit of output, total of
each cost element is divided by the
number of
units
produced, For this purpose, where at the
end of costing period, there are
some partially
completed
units in process, these
units must be stated in terms of
equivalent completed units,
For
example,
if 4,000 units. are in
process at the end of month
estimated as 50% complete, these
will
be
equivalent to 2,000 completed units.
These equivalent units are
added to units completed by
the
department to arrive at equivalent
production. Then total cost
is divided by this equivalent
production
figure to calculate unit
cost.
136
Cost
& Management Accounting
(MGT-402)
VU
Calculation
of cost per unit
In
process costing, costs are
averaged over the units
produced. The costs accumulated to a
process
for
a period are collected and divided by the
number of units equally produced during
the period.
Accounting
treatment / apportionment of the
accumulated cost
The
last section presents a
summary to the explaining
the accounting treatments of the
costs
incurred
in the department. This includes
(i)
Adjustment
for lost units for
normal loss, if any.
(ii)
Cost
transferred out.
(iii)
Cost
of abnormal loss, if
any.
(iv)
Cost
of work in process ending inventory
and
(v)
Any
other accounting adjustment, if
necessary to present.
Cost
of production report is generally
presented to management with
supplementary reports of
usage
of materials, labor and
factory overhead.
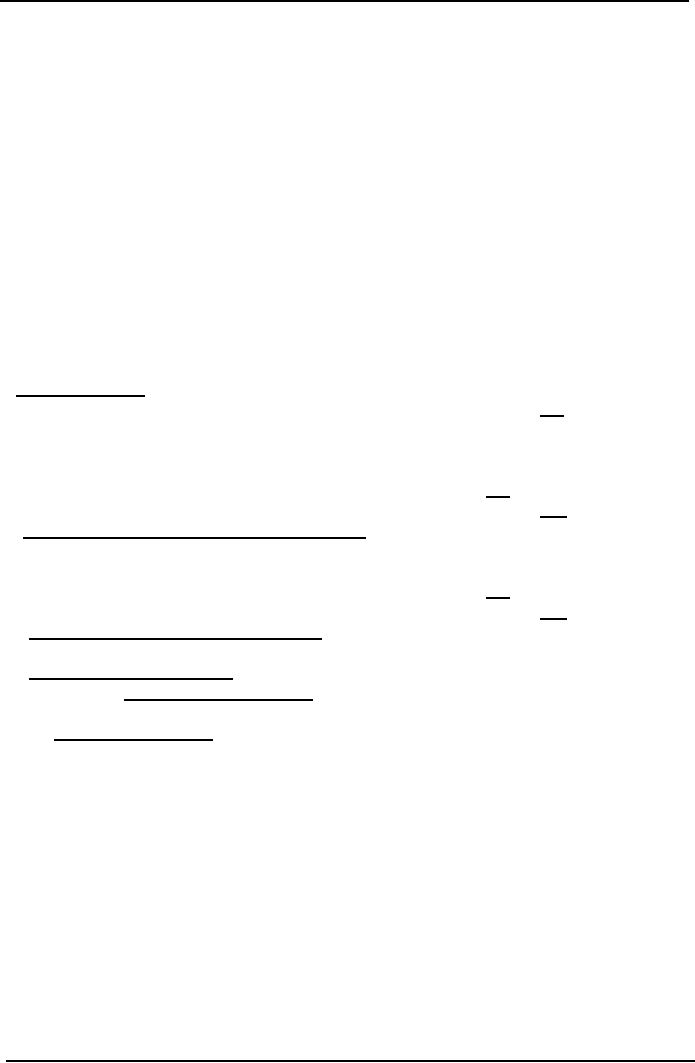
Standard
format of a simple
Cost
of Production Report
I-
Quantity Schedule:
Units
put into the
process
***
Units
completed in this process &
transferred
to
next department.
***
Units
not yet completed at the end
of the
Period.
***
***
II-
Cost Accumulated In The
Department / Process:
Direct
Material Cost
***
Direct
Labor
***
Factory
Overhead (Applied)
***
***
III-
Calculation of Equivalent Units
Produced
100%
of completed units + % completed of the in
process units
IV-
Calculation Of Per Unit
Cost
=
Total
Cost
.
Equivalent
Units Produced
V-
Accounting
Treatment
1-
Finished goods
2-
Closing Work in process
137

Cost
& Management Accounting
(MGT-402)
VU
Problem
Questions
Q.
1
Heera
Manufacturing Company manufactures a
product. Production made and
manufacturing
costs
incurred in the first
department during the month
of October .are given
below:
10,000
units were started in
process out of which 9,400
units were transferred to
next department
and
remaining 600 units were 1/2
complete as to materials, labor and
overhead. Direct
materials
Rs.
19,400, direct labor Rs.
24,250 and factory overhead
Rs. 14,550 was charged to
production.
Required: Cost
of production report for the
month.
Q.
2
Production
and cost data of first
production department of Excellent
Manufacturing Company
for
the
month of March 2006 are as
follow:
Units
started in process were
5,000. Units completed and
transferred to second department
were
4,500.
Remaining units were in process
estimated to be 50%, 40%,
60% completed as to materials,
labor
and factory overhead respectively.
Costs of materials, labor
and overhead were Rs.
50,000,
Rs.
60,000 and Rs. 40,000
respectively.
Required:
Cost
of production report.
138
Cost
& Management Accounting
(MGT-402)
VU
LESSON#
20, 21, & 22
PROCESS
COSTING SYSTEM
Practice
Question
Q.
1
Mini
Soap Manufacturing unit completed
and transferred out 600
soaps to department-11 at
the
end
of the week. In department-11
500 soaps completed and
transferred out. Units which
were
still
in process 100 (100% material,
Conversion cost 60%).
Rs.
Cost
received from preceding
department
540
Following
costs were incurred by
department-11:
Direct
Material
150
Direct
Labor
112
Factory
overhead
168
430
970
Required:
Prepare cost of production
report
Cost
of Production Report
Department-II
I-Quantity
Schedule:
Units
received previous
department
600
Unites
completed and transfer to
next
department
500
Units
still in process
100
600
II-Cost
Accumulated in the Department /
Process:
Cost
received from preceding
department
Rs.
540
Cost
added by department-11:
Direct
Material
150
Direct
Labor
112
Factory
overhead
168
430
970
III-Calculation
of Equivalent Units
Produced:
(100%
of completed units + % of units in
process)
Units
completed in department-I = 500 + 100 =
600
Direct
Material:
500+(100x100%)
=
600
Direct
Labor :
500+(100x60%)
=
560
F.O.H
:
500+(100x60%)
=
560
IV-
Unit Cost:
As
to Previous department:
Total
cost / Number of Equivalent
units produced = 540 / 600 =
0.90
As
to Direct Material:
150
/ 600 = 0.25
As
to Direct Labor:
112
/ 560 = 0.20
As
to F.O.H:
135
/ 900 = 0.15
1.65
V-
Apportionment of the Accumulated
Cost:
Cost
of units transferred to the
next department
No
of completed units x Total cost
per unit:
500
x
1.65
=
825
Units
in process:
Cost
of preceding department 100 x
0.9
=
90
Direct
Material
100
x 0.25
=
25
139
Cost
& Management Accounting
(MGT-402)
VU
Direct
Labor
60
x 0.20
=
12
F.O.H
60
x 0.30
=
18
145
970
Q.
2
Mini
Soap Manufacturing unit
started to incurring cost in
first department for 1000
soaps. At the
end
of the week 600 soaps
were completed, 300 still in
process and 100 units
lost. 100% of direct
material
had been incurred but
75% conversion cost was
yet incurred on the
incomplete work.
The
detail of costs incurred by
the department:
Rs.
Direct
material 500
Direct
labor
225
Factory
overhead
135
Required:
Prepare cost of production
report
Cost
Of Production Report
Department-I
I-Quantity
Schedule:
Units
started in process
1000
Units
completed in the department
600
Units
still in process
300
Units
Lost (Normal)
100
1,000
II-Cost
Accumulated in the Department /
Process:
Total
Rs
Direct
Material
500
Direct
Labor
225
F.O.H
135
860
III-Calculation
of Equivalent Units
Produced:
Direct
material 600+ (300x100%)
=
900
Direct
labor
600+
(300x75%)
=
825
F.O.H
600+
(300x75%)
=
825
IV-
Unit Cost:
Direct
material
500/900
=
0 .555
Direct
labor
225/825
=
0.27272
F.O.H
135/825
=
0.163636
0.992
V-
Apportionment of the Accumulated
Cost:
Cost
of units transferred to the
next department
600
x
0.992
595
Work
in process:
Direct
Material
300
x 0.5555 = 167
Direct
Labor
300
x 0.2727 = 61
F.O.H
300
x 0.16363 = 37
265
860
140
Cost
& Management Accounting
(MGT-402)
VU
Normal
Loss in First
Department.
Loss
of units during manufacturing
process is, in many industries, a
normal condition. This
loss
may
be due to unavoidable spoiled work or
wastage, evaporation or shrinkage etc. In
other words,
normal
loss represents the
lost units expected to arise even
under efficient operating
conditions.
Such
a loss is inherent in manufacturing
operations and cannot be avoided,
for this reason; cost
of
normal
loss is absorbed by the good
units produced. It has the
affect of increasing unit
cost of
good
output. Total cost of the
department is not divided by all
units processed, instead. It
is
divided
only by the good units
produced.
Practice
Question
During
the month of January 2006
direct materials worth Rs.
300,000 were issued to
produce
26,000
units of finished product.
Direct labor to process
these materials totaled Rs.
110,000 and
factory
overhead Rs. 55,000. During
the month processing of
20,000 units were completed
and
these
units were transferred to
next department, whereas, 1,000
units were lost during
processing
(the
loss is regarded as normal).
All of the direct materials
had been issued for
the units in process
at
the end of month, but
these units were only
40% converted. Cost of
Production Report for
the
month
'based on above inforn1ation is given
below:
Ginza
Beauty products
Department
I
Cost
of Production Report
For
the Month of January,
2006.
Quantity
Schedule
Units
started in process
26,000
Units
transferred to next
department
20,000
Units
still in process
5,000
(100%
materials,
40% labor & FOH)
Units
lost in process
Normal
loss
1,000
26,000
Cost
accumulated to Department
Total
Units
Rs.
Rs.
Cost
added by the department:
Direct
materials
300,000
12
Direct
labor
110,000
5
Factory
overhead
55,000
2.50
Total
cost to be accounted for
465,000
19.50
Cost
Apportioned
Transferred
to next department
(20,000
units x Rs. 19.50)
Rs.
390,000
Rs.
Work
in process ending inventory:
Direct
materials (5000 units x Rs.
12.00)
60,000
141
Cost
& Management Accounting
(MGT-402)
VU
Direct
labor (5000 units x 40% x
Rs. 5.00)
10,000
FOH
(5000 units x 40% x Rs.
2.50)
5,000
75,000
465,000
Whenever,
normal loss occurs in the
first department, it requires no
separate calculation.
Number
of
units so lost is ignored while
computing equivalent production.
The result is a decrease
in
equivalent
production quantity (the
denominator) and an increase in
unit cost.
In
the above cost of production
report, equivalent production of
department I include
20,000
completed
units plus 5,000 units in
work in process ending inventory
adjusted for their stage
of
completion.
Normal
Loss in Departments Subsequent to the
First.
It
is stated earlier that cost
of normal loss is absorbed by
the good units produced and
this is done
by
omitting lost units from
equivalent production quantity.
Same procedure applies when
units are
lost
during processing in a department
subsequent to the
first.
However,
here an adjustment
in unit cost from preceding department
is
also necessary. In the above
report
total
cost of Rs. 390,000 received
from department I was for
20,000 units. Out of these
20,000
units,
500 units were lost.
Now total cost of Rs.
390,000 applies only to
19,500 remaining good
units.
This decrease
in
number of units will cause
an increase
in
unit cost from preceding
department.
In
department 2, after the lost
units have been taken into
account, unit cost from
department I
come
to Rs. 20.00 (i.e. Rs.
390,000 + 19,500 units).
This increase of Rs. 0.50
(i.e. Rs. 20.00 less
Rs.
19.50)
is called adjustment for
lost units.
The
adjustment for lost units
can be computed by anyone of the
following two methods. For
the
purpose
of explanation assume the
following:
Assembling
department received from
cutting department 32,000 units at a
total cost of
Rs.120,000
resulting in a unit cost of
Rs. 3.75. During processing
in assembling department
2,000
units
were lost. The lost
units are considered as
normal.
First
Method: Firstly
find unit cost received
from preceding department
after adjustment for
lost
units
and then deduct it from the
unit cost before adjustment;
the difference is adjustment
per unit.
Unit
cost after adjustment is
calculated by dividing total
cost from preceding
department by good
units
left after the
loss.
Computations
are illustrated as
follow:
Rs
Unit
cost after adjustment
Rs.
120,000/30,000 units
4.00
Unit
cost before adjustment
3.75
Adjustment
per unit
0.25
Second
Method: Find
total cost of lost units at
which they are received by
the department. This
total
cost is now to be absorbed by
the remaining good units.
How much cost is to be
absorbed by
each
good unit is computed by
dividing remaining good units
into total cost of lost
units. The
resulting
figure is adjustment per
good unit.
These
computations are explained as
follows:
Cost
of lost units accumulated upto
preceding department
2,000
units x Rs. 3.75
Rs.
7,500
Adjustment
per unit Rs. 7.500/30,000
units
Rs.
0.25
142
Cost
& Management Accounting
(MGT-402)
VU
Normal
Loss at the End of
Process:
Preceding
discussion of normal loss is
for a situation where units
are lost at the beginning
or
during
manufacturing process in the department.
In many industries, lost units
are identified by
quality
inspectors at the end of
manufacturing process when
all production costs have
been
incurred
by the department. In such cases cost of
units lost is charged to completed
units only and
no
portion of loss is absorbed by
Units in work in process ending
inventory
For
this purpose lost units
are included in equivalent
production and the
adjustment for lost
units
is
not required, cost of lost
units is included in cost of
units completed and transferred
out or still
in
the department. This treatment
increases unit cost of completed
units only.
Assuming
that in department 2 lost
units are discovered in
final inspection at the end of
process,
cost
of production report of the
department will be as
follow:
Ginza
Beauty products
Department
2
Cost
of Production Report
For
the Month of January
2006
Quantity
Schedule.
Units
received from preceding
department
20,000
Units
transferred to next
department
16,000
Units
still in process
(80%
direct labor & factory
overhead)
3,500
Units
lost in process
Normal
loss (at the end of
process)
500
20,000
Total
Unit
Cost
Charged to Department.
Rupees
Rupees
Cost
from preceding
department
390,000
19.50
Cost
added by department:
Direct
labor
36,284
1.88
Factory
overhead
72,568
3.76
Total
cost added by
department
108,852
5.64
Total
cost to be accounted for
498,852
25.14
Cost
Accounted for as Follow
Rupees
Rupees
Transferred
to next department
(16,000
units x Rs. 25.93)
414,810
Work
in process ending inventory
Cost
from preceding
department
(3,500
units x Rs. 19.50)
68,250
Direct
labor (3,500 units x 80% x
Rs 1.88)
5,264
FOH
(3.500 units x 80% x Rs.
3.76)
10,528
84,042
Total
cost accounted for
498,852
Equivalent
units produced
16,000
+ (3,500 x 80%) + 500 = 19,300
units
Cost
per unit
Direct
labors
36,284/19,300
units
1.88
Factory
overhead
72,568/19,300
units
3.76
Cost
transferred to next department
16000
units x Rs. 25.14
402,240
Add
cost of lost units
500
units x Rs. 25.14
12,570
143
Cost
& Management Accounting
(MGT-402)
VU
Total
cost
414,840
Unit
Cost of Units Transferred
out:
Rs.
414,840
=
25.9256
16,000
units
The
logic of charging cost of normal loss at
the end of process only to
completed units is that
these
units have goon through
quality inspection, whereas, units
still in process are yet to
pass the
inspection,
of-course, units till in
process include spoiled
units as well. Therefore,
units in work in
process
ending inventory shall be charged with
the cost of spoiled units,
.1cluded therein, only
after
these units will have
goon through quality inspection. In
many industries units
being
processed
in a department are checked at a
definite stage before the
end of process, say at 75%
or
90%
stage of completion. In this
case cost of normal loss is
charged only to those nits
which have
passed
through the stage at which
quality check is made. These
units may be still in
process or may
have
been completed and transferred
out.
Abnormal
Loss
Abnormal
loss is the loss of units
not expected to arise under
efficient operating conditions. It
is
not
inherent in the manufacturing
process; instead, it is on account of
some accident or
carelessness.
The reasons of abnormal loss
include defective materials or poor
workmanship,
machine
breakdown or some other contingency.
Abnormal loss represents inefficiencies
in the
manufacturing
process; therefore, it is improper to
treat it as a part of product cost of
good units.
Cost
of abnormal loss is treated as
separate
unfavorable item and is
shown as such in cost of
production
report. It is debited to factory
overhead control account or to a
separate expense
account
to be charged directly against
revenues of the period and is
credited to the departmental
work
in process control account. Being an
indicator to inefficiency, abnormal
loss requires
immediate
attention of management.
For
the purpose of computing unit
cost, units of abnormal loss
are, included in
equivalent
production
after adjustment for degree
of completion. Consequently unit cost
represents, cost per
unit
as if there were no
loss.
PRACTICE
QUESTION
Q.
3
Mini
Soap Manufacturing unit completed
and transferred out 600
soaps to department-11 at
the
end
of the week. In department-11
450 soaps completed and
transferred to finished goods.
Units
which
were still in process 100
and 50 units lost (Normal).
Units in process 100% with
the
reference
of material and 60% with
conversion cost.
Rs.
Cost
received from preceding
department
540
Following
costs were incurred by
department-II:
Direct
Material
150
Direct
Labor
112
Factory
overhead
168
430
970
Required:
Prepare cost of production
report
Solution:
Cost
of Production Report
Department-II
I-Quantity
Schedule:
Units
received previous
department
600
144
Cost
& Management Accounting
(MGT-402)
VU
Units
completed and transfer to
Finished
goods
450
Units
still in process
100
Units
lost (Normal)
50
600
II-Cost
Accumulated in the Department /
Process:
Rs.
Cost
received from preceding
department
540
Cost
added by department-11:
Direct
Material
150
Direct
Labor
112
Factory
overhead
168
430
970
III-Calculation
of Equivalent Units
Produced:
(100%
of completed units + % of units in
process)
Units
completed in department-I = 450 + 100 =
550
Direct
Material:
450+(100x100%)
=
550
Direct
Labor :
450+(100x60%)
=
510
F.O.H
:
450+(100x60%)
=
510
IV-
Unit Cost:
Previous
department = 540 / 550 =
0.98182
Direct
Material
150
/ 550 = 0.272727
Direct
Labor
112
/ 510 = 0.21961
F.O.H
135
/ 510 = 0.32941
1.80357
V-
Apportionment of the Accumulated
Cost :
Transferred
to finished goods
450
x
1.80357
812
Work
in process:
Cost
of preceding department
(100
x 0.98182)
98
Direct
Material
(100
x0.272727)
27
Direct
Labor
(60
x 0.21961)
13
F.O.H
(60
x 0.32941)
20
158
970
Transfer
to Finished Goods
Cost
of preceding department (450 x
0.98182)
442
Direct
Material
(450
x0.272727)
123
Direct
Labor
(450
x 0.21961)
99
F.O.H
(450
x 0.32941)
148
812
145
Cost
& Management Accounting
(MGT-402)
VU
Q.
4
Mini
Soap Manufactures Co.
started to incurring cost in
first department for 1000
soaps. At the
end
of the week 600 soaps
were completed and 300 still
in process . 100% of direct material
had
been
incurred. But 75% conversion
cost was yet incurred on
the incomplete work. Remaining
100
units
were abnormally lost (completed
100% material, 50% conversion
cost)
Following
in the detail of cost
incurred:
Direct
material Rs.
500
Direct
labor
225
Factory
Overhead
135
860
Required:
Prepare cost of production
report
Cost
Of Production Report
Department-I
III-Calculation
of Equivalent Units
Produced:
Direct
material:
600+(400x100%)+(100x100%)
= 1000
Direct
labor : 600+(300x75%)+(100x50%) =
875
F.O.H
:
600+(300x75%)+(100x50%)
= 875
IV-
Unit Cost:
Direct
material:
500/1,000
=
0 .50
Direct
labor :
225/875
=
0.25714
F.O.H
:
135/875
=
0.15428
0.91142
V-
Apportionment Of the Accumulated
Cost to Finished Goods:
Cost
of units transferred to the
next department
600
x
0.91142
=
547
Closing
W.I.P Inventory:
Direct
Material
300
x 0.50
=
150
Direct
Labor
300
x 75% x 0.25714
=
58
F.O.H
300
x 75% x 0.15428
=
34
242
Abnormal
Loss
Direct
Material = 100 x 0.5
=
50
Direct
Labor = 50 x 0.25714
=
13
FOH
=
50 x 0.15428
= 8
71
860
Problem
Question
Q.
1
Orient
Industries. Limited produces a
product that passes through
two departments. Production
data
for the first month of its
operations are as follow:
Department
A Department B
Production
Costs:
Rupees
Rupees
Direct
materials
140,000
28,000
Conversion
costs
200,000
70,000
Units
Units
Production
units:
Started
/ received in process
23,000
13,000
Transferred
out
18,000
13,000
Still
in process
2/3
complete
3,000
146

Cost
& Management Accounting
(MGT-402)
VU
1/5
complete
2,500
In
department B there is an abnormal
loss of 1,500 units when
1/3 complete.
Required:
Prepare
cost of production report
for the month
Q.
2
Delight
Food Products produces 'Squash
Cubes" by continuous processing.
During February 19 -'
producing
department XYZ
received
8,000 cubes from the
preceding department aI1d
after
processing,
transferred 5,500 cubes to
next department. During the
month there was normal
loss
of
400 cubes at the end of
process. 600 cubes, 75%
converted, were lost due to
negligence of a
worker.
There was no work in process
beginning inventory, the ending inventory
was estimated as
60%
converted. Following product
costs were charged to the
department during February:
Rs.
Cost
from preceding
department
16,400
Direct
materials
2,000
Direct
labor
3,625
Factory
overhead
5,075
Rs.
27,000
In
department XYZ
all
materials are added at the
start of process.
Required: Cost
of production report for February
2006
Q.
3
Quantity
schedule of Mirza and
Company shows that 12,000
units were started in
process during
the
month of June. 7,000 units
were completed and transferred to
next department. 4,000
units,
25
% complete as to materials and 50%
complete as to labor and factory
overhead, were in
process
at the end of June. The
remaining units were lost
during processing. Costs
incurred by the
department
were materials Rs. 90,000
labor Rs. 70,000 and
factory overhead Rs. 50,000.
.
Required: Cost
of production report for the
month.
Q.
4
Tahir
Manufacturing Company uses
process costing. Costs of direct
materials, direct labor
and
factory
overhead incurred by department A
during April 2000, were
Rs. 25,000, Rs. 30,000
and Rs.
20,000
respectively. The quantity schedule
shows that 8,000 units
were started in process.
5,000
units
were transferred to next
department. 2,000 units were
still in process (all
materials, 50%
labor
and 25 % factory overhead). The remaining
units were lost, in
process.
Required:
Cost
of production report for
April, 2000.
Q.
5
During
April, 20,000 units were
transferred in from Department A at a
cost of Rs. 39,500.
Materials
cost of Rs. 6,500 and
conversion cost of Rs. 9,000
were added in Department B.
On
April
30, Department B had 5,000
units of work in process 60% complete as
to conversion costs.
Materials
are added in the beginning of
the process in Department
B.
Required: Cost
of production report.
147

Cost
& Management Accounting
(MGT-402)
VU
LESSON#
23 & 24
PROCESS
COSTING SYSTEM
(Opening
balance of work in process)
Work-in-process
and equivalent units
Partially-processed
units
At
the end of a period there may be
some units which have
been started but have
not been
completed.
These are closing
work-in-process units.
At
this stage we assume for
simplicity that there is no opening
work-in-process. In that case
the
output
for a period will consist of
two classes of finished
units of production:
·
Those that have been
started and fully processed
within the period
·
Those that have been
started during the period,
but not finished by the
end of the period.
This
closing
work-in-process will be completed during
the following period;
Further
costs will be incurred in
order to achieve
this.
Equivalent
units
Once
processing has started on a
unit; of output, to the
extent that it remains in an
uncompleted
state
it can be expressed as a proportion of a
completed unit. For example, if
100 units are exactly
half-way
through the production
process in terms of the amount of
cost they have absorbed,
they
are
effectively equal to 50 complete units.
Therefore, 100 units which
are half-complete can
be
regarded
as 50 equivalent units that
are complete.
Practice
Question
A
manufacturer starts processing on 1
March. In the month of March
he starts work on
20,000
units
of production. At the end of
March there are 1,500
units still in process and
it is estimated
that
each is two thirds complete.
Costs for the-period total
Rs19,500.
Calculate
the value of the completed units
and the work-in-process at 31
March.
In
practice it is unlikely that
all inputs to production
will take place at the
same time, as was
suggested
in the example above. For
instance, materials are
frequently added at the beginning of
a
process,
whereas labor may be applied
throughout the process.
Thus, work-in-process may
be
more
complete as regards one input or cost
element than as regards another.
Equivalent units must
thus
be calculated for each input
and costs applied on that
basis,
Practice
Question
In
this activity, use the
same data as in Activity 1
except that:
·
all
materials have been input to
the process
·
work-in-process
is only one-third complete as regards
labor
Costs
for the period are as
follows:
Materials
10,000
Labor
9,500
Total
19,500
Costs
for a process are allocated
to equivalent units to calculate
valuations for finished
goods and
work-in-process.
The
FIFO and weighted average methods of
cost allocation
In
the previous examples it was
assumed that there was no
opening stock of work-in-process. In
reality,
of course, this is unlikely to be
the case, and changes in
levels of work-in-process during
me
period
can give rise to problems.
There are basically two
methods of accounting for such
changes.
·
The weighted average (or
averaging) method
·
The FIFO method.
148
Cost
& Management Accounting
(MGT-402)
VU
Weighted
average method
In
the weighted average method opening stock
values are added to current
costs to provide an
overall
average cost per equivalent
unit. No distinction is therefore
made between units in
process
at
the start of the period and those
added during it and the
costs associated with
them
Problem
Question
FL
Manufacturing Co Ltd
Process
information for month ended
31 December
Work-in-process
1 December (15,000 units,
two-fifths complete)
Rs.
10,250 (work-in-process value made up
of: materials Rs
9,000
Plus
conversion costs
Rs1,250).
Units
started during
December
30,000
Units
completed during December
40,000
Work-in-process
31 December (half completed)
5,000
Material
cost added in month
24,750
Conversion
cost added in month
20,000
Materials
are wholly added at the
start of the process.
Conversion
takes place evenly
throughout the
process.
Calculate
the
values of finished production
for December and
work-in-process at 31 December,
using
the weighted average
method.
Choosing
the valuation method in practice
In
practice the FIFO method is
little used, for two
main reasons:
·
It is
more complicated to operate
·
In
process costing, it seems unrealistic to
relate costs for the
previous period to the
current
period
of activities.
Choosing
the valuation method in examinations
In
order to use the weighted
average or FIFO methods to account
for opening work-in-process
different
information is needed, as
follows:
Method
Information
needed
For
weighted average.
An
analysis of the opening work-in-process
value
into
cost elements (i.e.
materials, labor)
For
FIFO
The
degree of completion of the opening
work in
process
for each cost
element.
If
all of the information is
available so that either
method may be used, the
question will specify
the
required method.
Where
there is opening work-in-process, two
methods of cost allocation can be
used which make
different
assumptions and produce different stock
valuations. They are FIFO
and weighted
average.
PRACTICE
QUESTION
Q.
1
Mini
Soap Manufacturing unit
providing following
information
Units
of opening work in process
200
units
Units
put into the
process
800
units
Units
completed and transfer
out
1000
units
Units
of opening work in process 100% completed
as per direct material and 75% completed
with
direct
labor and factory overhead
cost.
149
Cost
& Management Accounting
(MGT-402)
VU
Cost
incurred on opening work in process:
Direct
Material
Rs.
6,000
Direct
Labor
2,000
Factory
overhead
1,000
9,000
Cost
incurred during the accounting period on units
put in the process:
Direct
Material
Rs.
20,000
Direct
Labor
10,000
Factory
overhead
8,000
38,000
Required:
Prepare cost of production
report of process-1 (using FIFO
and Weighted Average
method
of inventory costing)
Cost
of Production Report
Department-1
I-Quantity
Schedule:
Units
of opening work in process
200
Units
put in the process
800
1,000
Units
completed and transfer
out
1,000
II-Cost
Accumulated in the
Process:
Direct
Material (6,000 +
20,000)
26,000
Direct
Labor (2,000 +
10,000)
12,000
F.O.H
(1,000 + 8,000)
9,000
47,000
III-Calculation
of Equivalent Units Produced
(FIFO)
As
to Direct Material 200 x 0% +
800
800
As
to Conversion cost 200 x 25%
+ 800
850
IV-
Unit Cost (FIFO) :
Direct
Material
20,000
/ 800
=
25
Direct
Labor
10,000
/ 850
=
11.7647
F.O.H
8,000
/850
=
9.4118
=
46.1765
V-
Cost Apportionment/Accounting Treatment
(FIFO) :
Cost
of opening work in process
Cost
already incurred on opening WIP
Rs. 9000
Material
100%
complete
0
Labor
200 x 25 % = 50 x 11.7647 =
588
FOH
200 x 25 % = 50 x 9.4118 =
471
10,059
Cost
of units put into the
process during the
period
800
x 46.1765
36,947
47,000
150
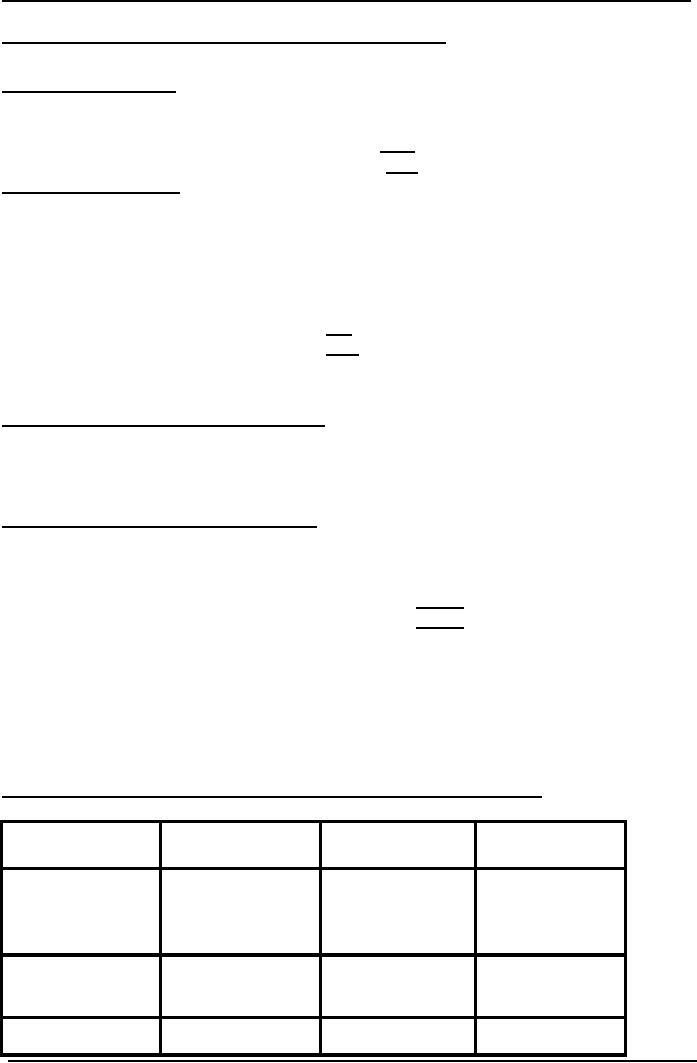
Cost
& Management Accounting
(MGT-402)
VU
III-Calculation
of Equivalent Units Produced
(W. Avg method)
Material
and Conversion cost = 1000
units
IV-
Unit Cost (W. Avg)
:
Direct
Material 26,000 /
1,000
=
26
Direct
Labor
12,000
/ 1,000
=
12
F.O.H
9,000
/ 1,000
= 9
47
V-
Cost Apportionment
Cost
of units transferred to the
next department:
1000
x
47
=
47,000
Q.
2
Mini
Soap Manufacturing unit
providing following
information:
Units
of opening work in process
200
Units
put into the
process
800
1000
Units
of closing work in process
300
Units
completed and transfer
out
700
Cost
incurred on opening work in
process:
Direct
Material
Rs.
6,000
Direct
Labor
2,000
Factory
overhead
1,000
9,000
Cost
incurred on units put in the
process:
Direct
Material
Rs.
20,000
Direct
Labor
10,000
Factory
overhead
8,000
38,000
47,000
Units
of opening work in process 100% completed
as per direct material and 75% completed
with
direct
labor but the units of
closing work in process 100% completed as
per material and 50%
direct
labor.
Required:
Prepare cost of production
report of process-1
Cost
of Production Report
Calculation
of Equivalent Units Produced
(Weighted Average Method)
Material
Labor
FOH
Completed
units
700
700
700
Opening
WIP
300
(300
x50%)
(300
x50%)
150
150
Total
1000
850
850
151
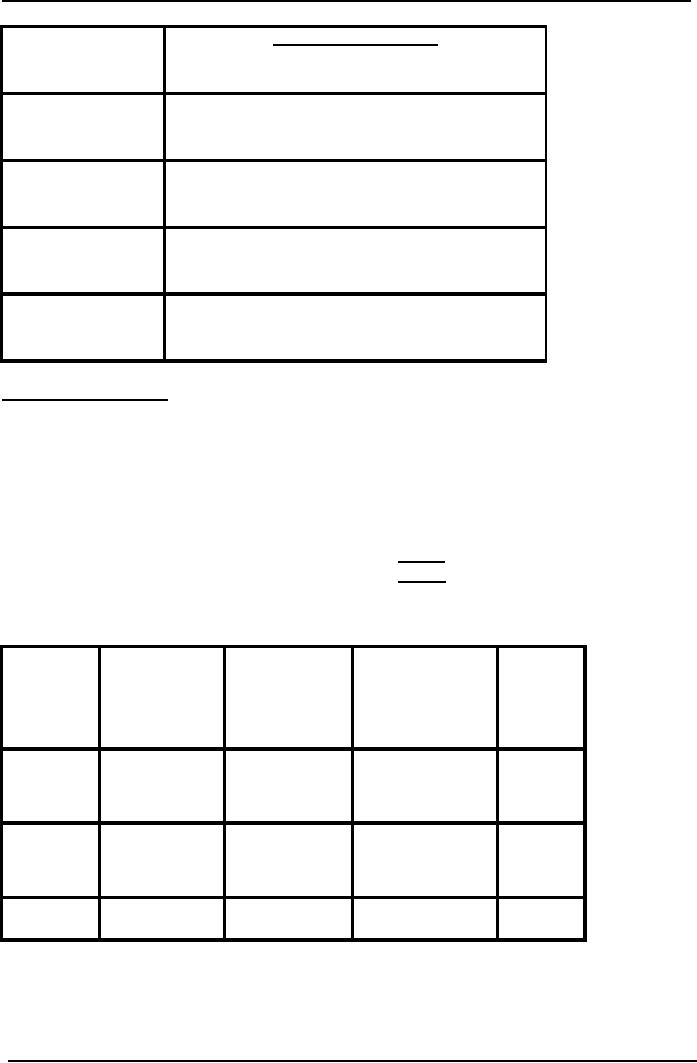
Cost
& Management Accounting
(MGT-402)
VU
Per
unit cost (W.Avg)
Material
26,000
/ 1000 = 26
Labor
12,000
/ 850= 14.1176
FOH
9,000
/ 850 = 10.5882
Total
50.7058
Cost
Apportionment
Cost
of units transferred to the
next department:
700
x
50.7058
=
35,494
Work
in process
Material
300
x 26 =
7,800
Labor
150
x 14.1176 =
2,118
FOH
150
x 10.5882 =
1,588
11,506
47,000
Equivalent
production (FIFO)
Opening
WIP Completed # of Closing work in
Total
units
(Current
process
period
)
(%
of completion)
Material
0
500
300
800
Labor
(200
x 25%)
500
(300
x 50%)
700
25
150
FOH
(200
x 25%)
500
(300
x 50%)
700
25
150
Cost
Per Unit (FIFO)
Direct
Material:
20,000
/ 800
=
25
Direct
Labor:
10,000
/ 700
=
14.2857
F.O.H
:
8,000
/ 700
=
11.4286
152
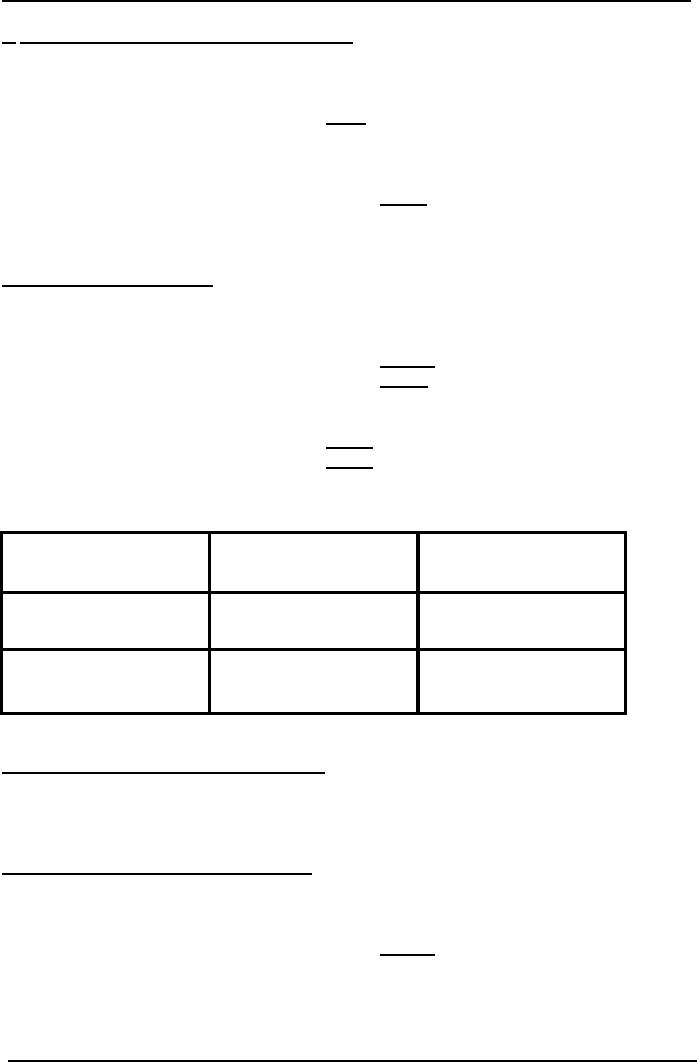
Cost
& Management Accounting
(MGT-402)
VU
1-
Cost of units transferred to next
department
a-
Opening work in
process
Cost
already incurred
9,000
Direct
Labor 200 x 25% = 50 x
14.2857 = 714
FOH
200
x 25% = 50 x 11.4286 =
571
10,285
b-
Cost of completed
units
500
x 50.7143
25,358
Cost
transferred to next
department
35,643
2-
Closing work in process
Material
300 x 25
=
7500
Labor
150
x 14.2857 = 2142
FOH
150 x 11.4286 =
1715
11,357
47,000
Q.
3
Units
of opening work in process
2,000
Units
produced during the period
16,000
18,000
Units
completed and transfer
out
14,800
Work
in progress at the
end
3,200
Stage
of completion
Material
Labor
& Overhead
Opening
WIP
100%
50%
Closing
WIP
100%
25%
Cost
incurred on opening work in
process:
Direct
Material
Rs.
24,000
Direct
Labor
3,200
Factory
overhead
3,200
30,400
Cost
incurred during the current period :
Direct
Material
Rs.
20,000
Direct
Labor
63,680
Factory
overhead
63,680
319,360
349,750
Required:
Prepare cost of production
report of process-1
153
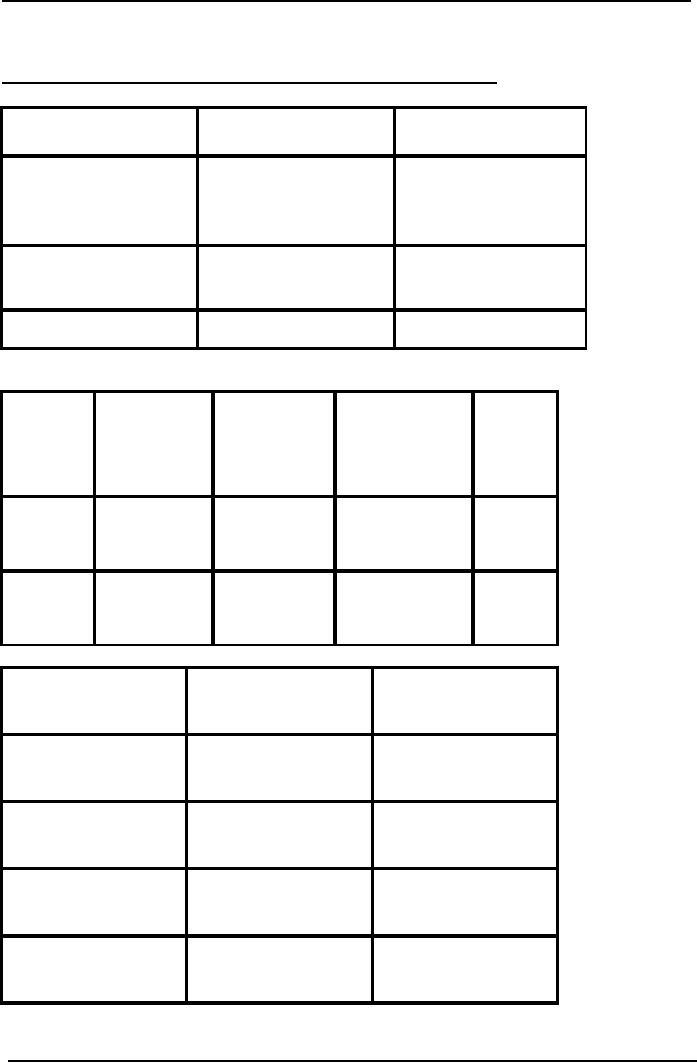
Cost
& Management Accounting
(MGT-402)
VU
Cost
of Production Report
Calculation
of Equivalent Units Produced (Weighted
Average Method)
Material
Labor
& FOH
Completed
units
14,800
14,800
Opening
WIP
3,200
(3,200
x50%)
800
Total
18,000
15,600
Equivalent
production (FIFO)
Opening
WIP Completed # of Closing work
in
Total
units
(Current
process
period
)
(%
of completion)
Material
0
12,800
3,200
16,000
Labor
&
(2000
x 50%)
12,800
(300
x 25%)
14,600
FOH
1000
800
Per
unit cost (W.Avg)
Per
unit cost (FIFO)
Material
2,16,000
/ 18,000 = 12
19,200
/ 16,000 =
12
Labor
66,880
/ 15,600 =
63,680
/ 14,600 =
4.2872
4.3616
FOH
66,880
/ 15,600 =
63,680
/ 14,600 = 4.3616
4.2872
Total
20.5744
20.7232
154

Cost
& Management Accounting
(MGT-402)
VU
Cost
Apportionment (Weighed Average
Method)
Transfer
to next department
14,800
X 20.5744 =
304,500
Work
in process
Material
3200
x 12 = 38,400
Labor
800
x 4.2872 = 3430
FOH
800
x 4.2872 = 3430
45,260
349,760
Cost
Apportionment (Weighed Average
Method)
1-
Cost of units transferred to next
department
a-
Opening work in
process
Cost
already incurred
30,400
Direct
Labor 1000 x 4.3616
=
4316
FOH
1000
x 4.3616 =
4316
39,122
b-
Cost of completed
units
12,800
x 20.7232
265,258
Cost
transferred to next
department
304,380
2-
Closing work in process
Material
3,200 x 12
=
38,400
Labor
800 x 4.3616
=
3,490
FOH
800 x 4.3616
=
3,490
45,380
349,760
155
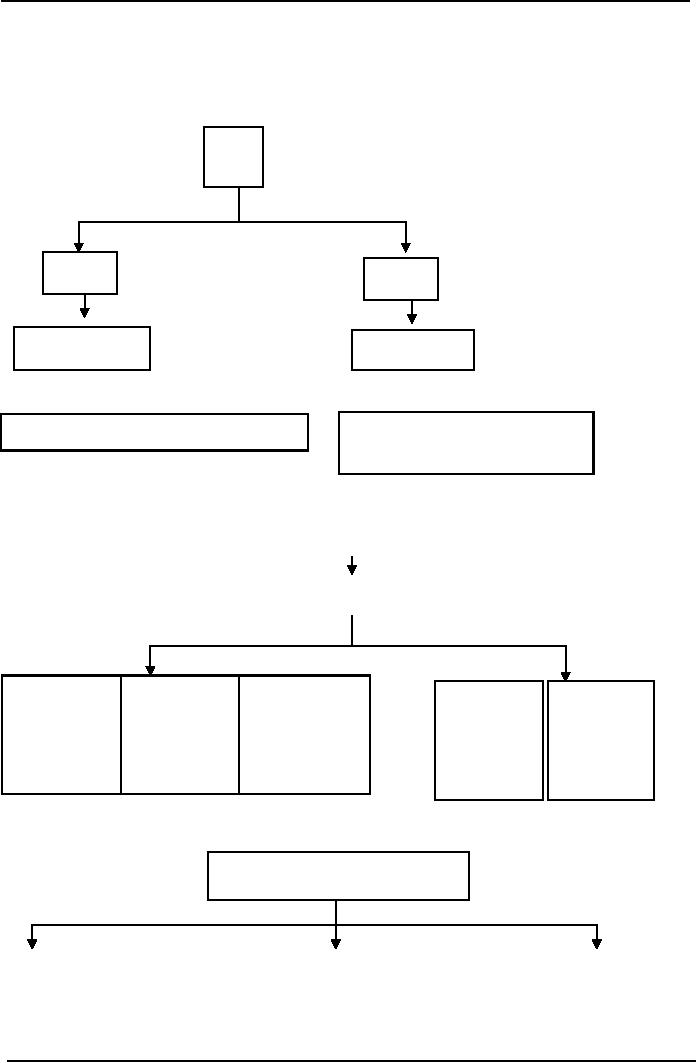
Cost
& Management Accounting
(MGT-402)
VU
LESSON#
25 & 26
COSTING/VALUATION
OF JOINT AND BY PRODUCTS
Following
are self explanatory diagrams
which help in understanding the concept
of joint product
and
by products.
Input
Output
Output
Joint
product
By
Product
Considerably
Significant
Incidental
Produce
Example:
Sugarcane Juice
Example:
Crude Oil (Diesel &
Petrol)
(Husk
or Pulp is a by product)
Department
A
(Cost
Accumulated)
Direct
Material, Direct Labor,
FOH
Joint
Product Joint Product Joint
Product
By
Product
By
Product
A
(a)
A
(b)
A
(c)
Requiring
no
Requiring
Direct
Material Direct Material
Direct Material
further
further
Direct
Labor Direct Labor
Direct Labor
process
process
FOH
FOH
FOH
For
by products:
Basis
of Cost Allocation
Physical
Quantity Ratio
Selling
Price Ratio
Hypothetical
Market
Value
Ratio
156

Cost
& Management Accounting
(MGT-402)
VU
Valuing
by-products and joint
products
By-products
Either
of the following methods may be
adopted when valuing
by-products:
(a)
The proceeds from the
sale of the by-product may
be treated as pure
profit
(b)
The proceeds from the
sale, less any handling and
selling expenses, may be applied in
reducing
the
cost of the main
products.
If
a by-product needs further
processing to improve its marketability,
such cost will be deducted
in
arriving
at net revenue, treated as in (a) or
(b) above.
Recorded
profits will be affected by the
method adopted if stocks of
the main product
are
maintained.
Accounting
for joint products
Joint
products are by definition, subject to
individual accounting procedures.
Joint costs may
require
apportionment between products if
only for joint valuation
purposes.
The
main bases for apportionment
are as follows:
Physical
measurement of joint
products
When
the unit of measurement is
different, e.g. liters and
kilos, some method should be
found of
expressing
them in a common unit. Some
joint costs are not
incurred strictly equally for
all Joint
products:
such costs can be separated
and apportioned by introducing
weighting factors.
Market
value
The
effect is to make each
product appear to be equally profitable.
Where certain products are
processed
after the point of
separation, further processing
costs must be deducted from
the market
values
before joint costs are
apportioned.
Technical
estimates of relative use of
common resources
Apportionment
is, of necessity, an arbitrary
calculation and product
costs which include such
an
apportionment
can be misleading if used as a
basis for decision-making.
Problems
of common costs
Even
if careful technical estimates are
made of relative benefits, common costs
apportionment will
inevitably
be an arbitrary calculation. When
providing information to assist
decision-making,
therefore,
the cost accountant will
emphasize cost revenue differences
arising from the
decision.
Here
are some examples of
decisions involving joint
products:
·
withdrawing, or adding, a
product
·
Special pricing
·
Economics of further
processing.
Apportioned
common costs are not
relevant to any of the above
decisions although a change
in
marketing
strategy may affect total
joint costs, e.g.
withdrawing a product may
allow capacity of the
joint
process to be reduced.
In
the short or medium term, it
is probably impractical and/or uneconomic
to alter the processing
structure.
The relative benefit derived by joint
products is, therefore,
irrelevant when considering
profitability
or marketing opportunities.
157

Cost
& Management Accounting
(MGT-402)
VU
PRACTICE
QUESTION
Q.
1
Physical
quantity method
Cost
Allocation at Split off
Point
1960
liter fresh milk put in
the process
Skim
Milk
1,000
Liter
Cream
500
Liter
Butter
200
Liter
Ghee
100
Liter
Yogurt
60
Liter
Miscellaneous
100 Liter
Cost
incurred for 1,960 liters of
milk is Rs. 15,680
Solution
Skim
Milk
=
15,680 / 1960 x 1000 =
8,000
Cream
=
15,680 / 1960 x 500 =
4,000
Butter
=
15,680 / 1960 x 200 =
1,600
Ghee
=
15,680 / 1960 x 100 =
800
Yogurt
=
15,680 / 1960 x 60 =
480
Miscellaneous
=
15,680 / 1960 x 100 =
800
Q.
2
Cost
incurred in the department Rs
70,000
Drum
sticks
Rs.
4 per gram
Breast
pieces
Rs.
6 per gram
Wings
Rs.
3 per gram
Miscellaneous
Rs. 2 per gram
Drum
stick
20,000
X 4
=
80,000
Breast
pieces
10,000
X 6
=
60,000
Wings
6,000
X 3
=
18,000
Miscellaneous
4,000
X 2
=
8,000
1,66,000
Solution
Drum
stick
=
70,000 / 1,66,000 x 80,000 =
33,735
Breast
pieces
=
70,000 / 1,66,000 x 60,000 =
25,300
Wings
=
70,000 / 1,66,000 x 18,000 =
7,590
Miscellaneous
=
70,000 / 1,66,000 x 8,000 =
3,375
70,000
Physical
Quantity Ratio
Total
quantity produced 40,000
grams
Drum
stick
20,000
Breast
pieces
10,000
Wings
6,000
Miscellaneous
4,000
40,000
158
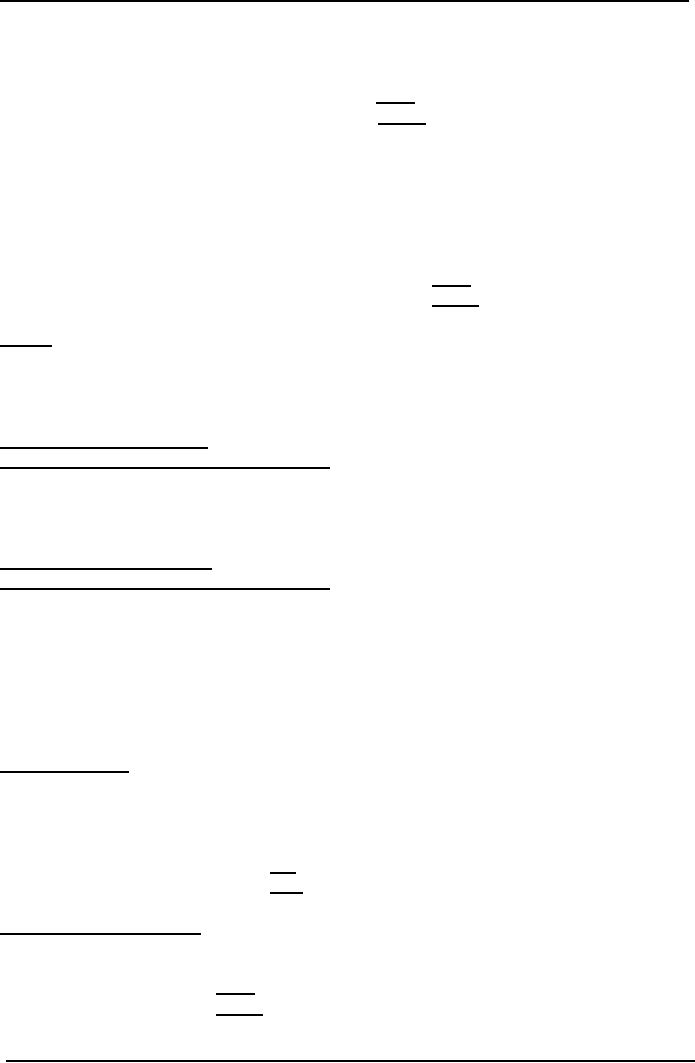
Cost
& Management Accounting
(MGT-402)
VU
Drum
stick
=
70,000 / 40,000 x
20,000
=
35,000
Breast
pieces
=
70,000 / 40,000 x
10,000
=
17,500
Wings
=
70,000 / 40,000 x
6000
=
10,500
Miscellaneous
= 70,000 / 40,000 x
4000
=
7,000
70,000
Q.
3. ABC
limited produces three products O, P
and Q by the operation. Cost accumulated
during
the
operation.
Direct
Material 1000 kg @ Rs 2 =
Rs.
2,000
Direct
Labor
5,000
FOH
8,000
15,000
Output
O
500
Kg
Sold
at split off point for Rs 20
/ kg
P
300
kg
Enters
into a second process
Q
200
kg
Enters
into a second process
Second
process for product P
Cost
incurred: Total
Per
Unit
Direct
Labor cost
Rs.
6,000
Rs.
20
FOH
Rs.
3,000
Rs.
10
Product
P is 100% complete & sold for Rs 70 /
kg
Second
process for product Q
Cost
incurred: Total
Per
Unit
Direct
Labor cost
Rs.
1,400
Rs.
7
FOH
Rs.
600
Rs.
3
Product
Q is 100% complete & sold for Rs 30 /
kg
Solution
Method
# 1
Physical
Quantity Ratio
Process-1
Quantity
Schedule
Units
put in the process 1,000
kg
Completed
units of product "O"
500
kg
Transfer
to further process
Product
"P"
300
Product
"Q"
200
1000
Cost
Accumulated as follow:
Direct
Material
2,000
Direct
Labor
5,000
FOH
8,000
15,000
159
Cost
& Management Accounting
(MGT-402)
VU
Cost
Allocation / Accounting
Treatment
Product
O
=
15,000
x500 / 1000 = 7,500
Product
P
=
15,000
x 300 / 1000 = 4,500
Product
Q
=
15,000
x 200 / 1000 = 7,500
Product
O
No
further process is required
Completed
& Sold
Sold
500 x 20 = 10,000
Cost
500 x 15 = 7,500
Gross
Profit
2,500
Product
P
Cost
Accumulated
Cost
received from Process
1
Rs.
4,500
Direct
Labor
6,000
FOH
3,000
13,500
Unit
Cost = 13,500 / 300 = 45 /
Kg
Transfer
to finished goods = 300 x 45 =
13,500
Sales
300 x 70
=
21,000
Less
Cost 300 x 45
=
13,500
7,500
Product
Q
Cost
Accumulated
Cost
received from Process
1
Rs.
3,000
Direct
Labor
1,400
FOH
600
5,000
Unit
Cost
5,000
/ 200 = 25 / Kg
Transfer
to finished goods = 200 x 25 =
5,000
Sales
200 x 30
=
6,000
Less
Cost 200 x 25
=
5,000
1,000
Method
# 2 Hypothetical market Value
Basis
O
P
Q
Rs
Rs
Rs
Final
Price
20
70
30
Additional
Cost per kg
In
further processing
Direct
Labor
-
20
7
Factory
Overhead
-
10
3
Hypothetical
Market Value
At
split off point
20
40
20
160
Cost
& Management Accounting
(MGT-402)
VU
Cost
Allocation in the
Process-1
Product
O (Finished) 15,000 / 80 x 20
=
3,750
Product
P Transferred to process II 15,000 / 80 x
40
=
7,500
Product
Q Transferred to process II 15,000 / 80 x
20
=
3,750
15,000
Product
P
Process
-II
Quantity
Schedule
Received
From process-I
300
Completed
and transfer out
300
Cost
Accumulated
Cost
received from
process-1
7,500
Cost
added
Direct
Labor
6,000
FOH
3,000
9,000
16,500
Cost
Apportionment / Accounting
Treatment
Cost
transfer to finished
good
Rs
16,500
16,500
/ 300 = 55 per kg
300
x 55 = 16500
Sales
300
x 70
=
21,000
Less
Cost
300
x 55
=
16,500
Gross
Profit
4,500
Product
Q
Process
-II
Quantity
Schedule
Received
From process-I
200
Completed
and transferred out
200
Cost
Accumulated
Cost
received from
process-1
3,750
Cost
added
Direct
Labor
1,400
FOH
600
5,750
Cost
Apportionment / Accounting
Treatment
Cost
transfer to finished
good
Rs
5,750
5750
/ 200 = 28.75 per kg
200
x 28.75 = 5,750
Sales
200 x 30
=
6,000
Less
Cost 300 x 55
=
5,750
250
By
Products
Some
examples of by products are given
below:
161
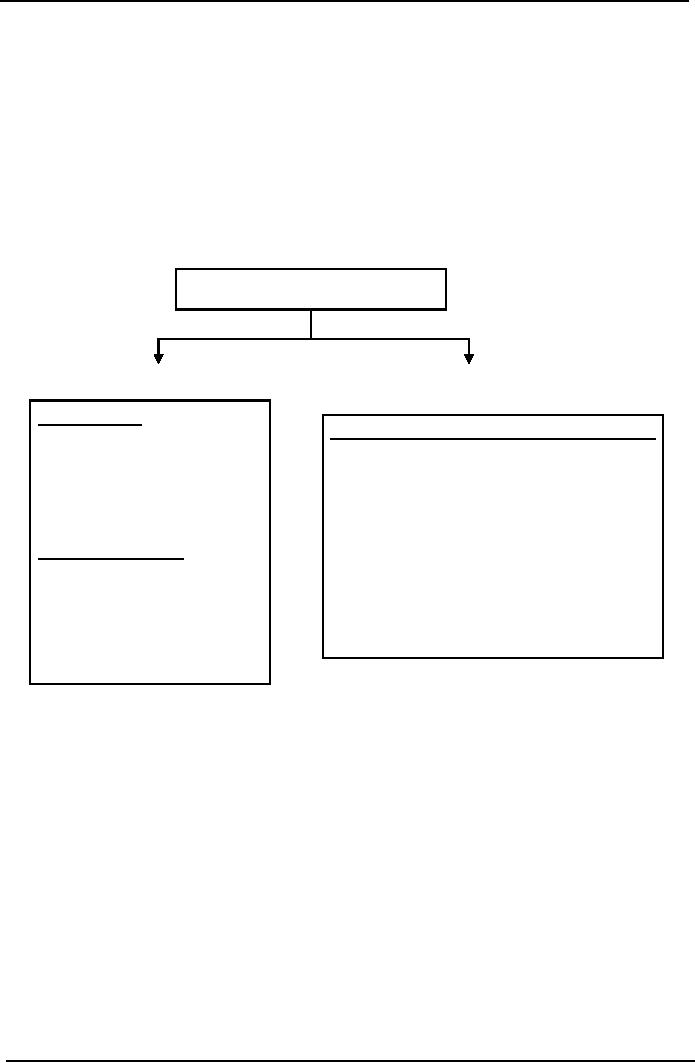
Cost
& Management Accounting
(MGT-402)
VU
Main
Product
By
Product
Soap
Glycerin
Meat
Hides
& Fats
Flour
Bran
Classification
of by product
By
product can be classified
into two categories:
1.
Requiting no further process,
for example Bran
2.
Requiting further processing,
for example Hides
Accounting
for By Products
Income
Approach
Costing
Approach
Sales
Income
Credit
the cost of main product with
the:
1-
Treat as other income
1-
Replacement cost / Opportunity
2-
Treat as a deduction form
Cost
of By Product
Cost
goods sold
3-
Treat as a deduction form
2-
Predetermined price /
Standard
Cost
goods manufactured
Cost
Realizable
Income
1-
Treat as a deduction form
Cost
goods manufactured
162
Cost
& Management Accounting
(MGT-402)
VU
PRACTICE
QUESTION
Following
is a question on by product:
Main
product
By
product
Opening
stock
-----
-----
Production
during the year
4,000
800
Closing
stock
400
100
Cost
incurred
64,000
-----
Cost
of 3600 units (64,000/4000x3600)
57,600
-----
Sales
price (Per unit)
30
2.50
Further
processing cost
0.50
Solution
Method
# 1
Rupees
Treat
as an other income
Sales
(3600 x 30)
108,000
Less
Cost of goods sold
Opening
stock
----
Production
cost
64,000
Less
Closing stock (16 x 400)
(6,400)
57,600
Gross
Profit
50,400
Add
other income
1,400
51,800
Sales
of By Product
(700
x 2.5)
1,750
Less
Further Processing cost (700
x 0.5)
350
1,400
Method
# 2
Rupees
Treat
as a deduction from cost of
goods sold
Sales
(3600 x 30)
108,000
Less
Cost of goods sold
Opening
stock
----
Production
cost
64,000
Less
Closing stock (16 x 400)
6,400
57,600
Less
Sales value of By Product
(1,400)
56,200
Gross
Profit
51,800
Method
# 3
Rupees
Treat
as a deduction from cost of
goods manufactured
Sales
(3600 x 30)
108,000
Less
Cost of goods sold
Opening
stock
----
Production
cost (64,000
1,400)
62,600
Less
Closing stock (62,600 x 10%)
6,260
56,340
Gross
Profit
56,660
163
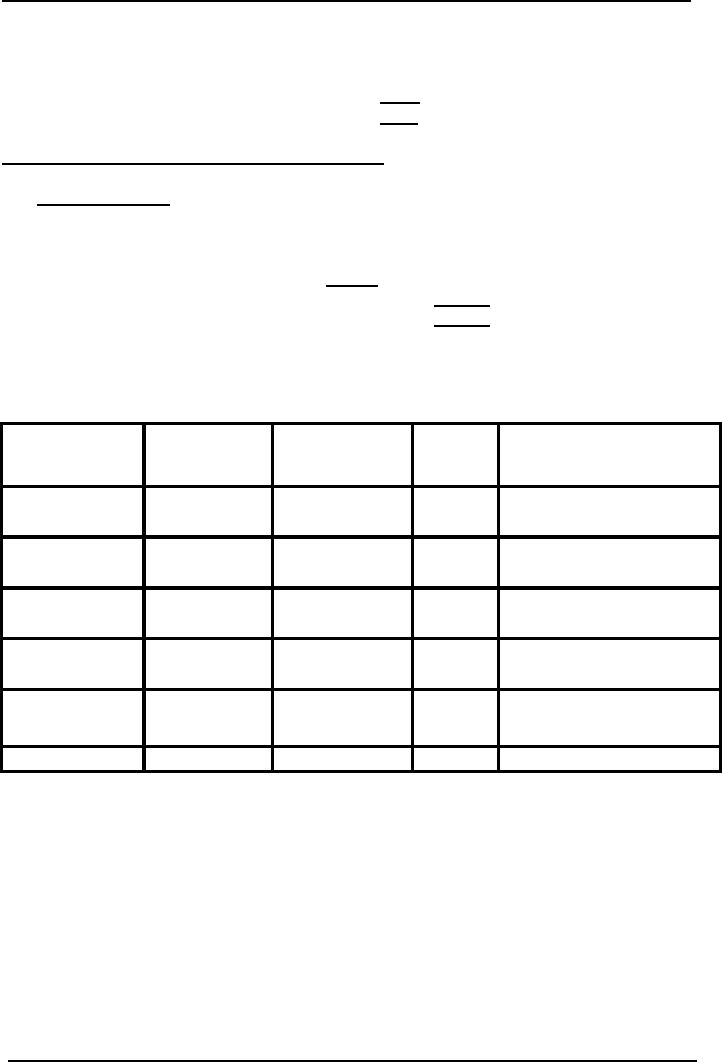
Cost
& Management Accounting
(MGT-402)
VU
Realizable
Value Basis
Production
cost on By Product
800
x 2.50 =
2,000
Additional
cost on By Product
800
x 0.50 =
400
Realizable
Value
1,600
Treat
as a deduction from cost of
goods manufactured
Sales
(3600 x 30)
108,000
Less
Cost of goods sold
Opening
stock
----
Production
cost (64,000
1,600)
62,400
Less
Closing stock
(62,400/4,000=15.6
x 400)
6,240
56,160
Gross
Profit
51,840
Further
example of by product
Joint
Cost Rs. 206,800
Further
Cost
Sales
Price Market Value
Incurred
per
pound
Grade
1
20,000
lb
1
5
(5-1)
= 4 x 20,000
80,000
Grade
2
40,000
0.2
4
(4-0.2)
= 3.8 x 40,000
152,000
Grade
3
60,000
0.5
3
(3-0.5)
= 2.5 x 60,000
150,000
Grade
4
80,000
0.2
2
(2-0.2)
= 1.8 x 80,000
144,000
Grade
5
50,000
0.1
1
(1-0.1)
= 0.9 x 50,000
45,000
Total
250,000
Multiple
Choice Questions
A
chemical compound is made by
raw material being processed
through two processes.
The
output
of Process A is passed to Process B where
further material is added to the
mix. The details
of
the process costs for
the financial period number 10
were as shown below:
Process
A
Direct
material
2,000
kilograms at Rs5 per kg
Direct
labor
Rs
7,200
Process
plant time 140 hours at
Rs60 per hour
Process
B
Direct
material
1,400
kilograms at Rs12 per kg
Direct
labor
Rs
4,200
Process
plant time 80 hours at
Rs72.50 per hour
The
departmental overhead for Period 10
was Rs 6,840 and is absorbed
into the costs of
each
164

Cost
& Management Accounting
(MGT-402)
VU
process
on direct labor cost.
Process
A
Process
B
Expected
output was
80%
of input
90%
of input
Actual
output was
1,400
kgs
2,620
kgs
Assume
no finished stock at the beginning of the
period and no work-in-progress at either
the
beginning
or the end of the
period.
Normal
loss is contaminated material which is sold as
scrap for Rs0.50 per kg
from Process A and
Rs1.825
per kg from Process B, for
both of which immediate
payment is received.
Q.
1
For
process A what is the scrap
value of the normal
loss?
A
Rs
200
B
Rs
2,000
C
Rs
1,000
D
Rs
0
Q.
2
What
is the abnormal loss for
process A in units?
A
100
B
200
C
300
D
400
Q.
3
What
is the cost per kg for
process A?
A
Rs 18,575
B
Rs 13,454
C
Rs 14.575
D
Rs 16,575
Problem
Question
Q.
1
Kong
CO. manufactures two products, one in
process A, the other in
process B. The
following
information
applies to the processes for
Period.
All
materials are input at the
start of each process, conversion
costs (labor and overhead)
are
incurred
evenly throughout the
process, and losses are
identified at the end of
process A and can
be
sold for 10p per liter.
The dosing work-in-progress is % of
the way through the
process.
Write
up the accounts for process A
and for process B
Process
A
Process
B
Material
input-1
4.000
liters costing
200
kg costing
Rs
3,000
Rs
2,000
Labor
and overhead
Rs
3,440
Rs
3,900
Transfers
to finished goods
13,000
liters
180
kg
Opening
work-in-progress
Nil
Nil
Closing
work-in-progress
Nil
20
kg
Normal
loss as % of input
10%
Nil
Q.
2
Mineral
Separators Ltd operates a
process which produces four
unrefined minerals known as W,
X.
Y and Z. The joint costs
for operating the process
for Period V were as
below.
Process
overhead is absorbed by adding
25% of the labor cost.
The output for Period V
was as
165

Cost
& Management Accounting
(MGT-402)
VU
shown
below.
There
were no stocks of unrefined
materials at the beginning of Period V,
and no work-in-
progress,
but the stocks shown
below were on hand at the
end of the period, although
there was
no
work-in-progress at that
date.
The
price received per ton of
unrefined mineral sold is shown
below and it is confidently
expected
that
these prices will be
maintained.
You
are required:
(a)
To calculate the cost value of
the closing stock, using sales value as
the basis of your
calculation.
(b)
To calculate the cost value of
dosing stock, using weight of output as
the basis of your
calculation.
166
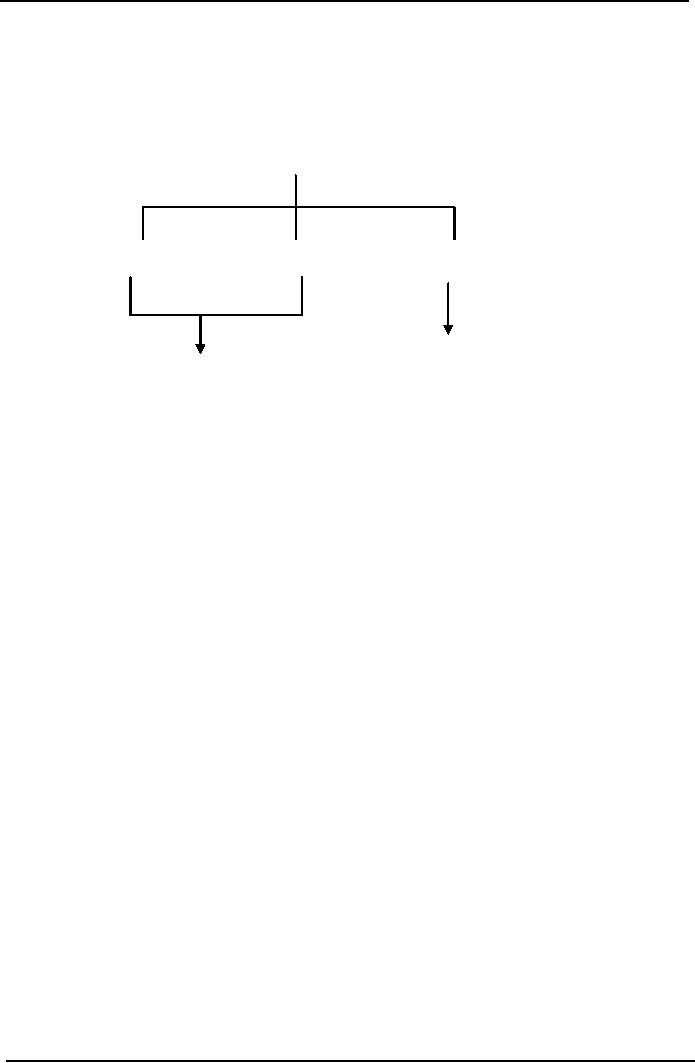
Cost
& Management Accounting
(MGT-402)
VU
LESSON#
27 & 28
MARGINAL
AND ABSORPTION COSTING
(Product
costing systems)
Following
diagram helps to recall the
behavior of different cost
elements.
Cost
Elements
Direct
Material
Direct
Labor
Factory
Overhead Cost
Variable
& Fixed Cost
Variable
Cost
Marginal
cost is the cost the
variable cost that changes
with the production of each
next unit.
Marginal
and Absorption Costing
So
far we
have
been looking at the various
different types of cost and
have gradually built up
the
total
cost of a cost unit by
aggregating the cost of direct
materials, direct labor, direct
expenses,
variable
overheads and fixed
overheads (absorbed into
cost units). We can display
this total cost as
part
of a profit and loss account
(namely cost of sales). In
doing so we must remember to
adjust
the
profit and loss account
for any overhead under- or
over-absorbed.
This
adjustment is only necessary
because we are including
fixed overheads in the cost
of the cost
unit.
In other words, we are presenting
cost information according to
absorption costing
principles.
However, there is another
method of presenting cost information,
i.e. marginal costing.
Marginal
Costing
Under
this system, we do not
attempt to absorb fixed
overheads into cost units,
and so we avoid
the
difficulties of setting absorption rate,
adjusting for under or over-absorbed
overhead, etc.
Cost
units are valued at their marginal
cost only (not their
fully absorbed cost). In other
words the
cost
of a cost unit is presented as
the total of direct materials, direct
labor, direct expenses
and
variable
overheads (but not fixed
overheads).
Of
course, this does not
mean that we can simply
ignore fixed overheads It is simply
that we
choose
to treat all fixed overheads as period
costs, rather than trying to
attribute them to
individual
cost
units You will find that
this presentation of cost information
has distinct advantages
over-
absorption
costing when it comes to decision
making.
A
key concept in marginal costing is that of
contribution margin.
Contribution
Margin is defined as
the sales value of a cost
unit minus its variable
cost.
Absorption
and marginal
costing
167
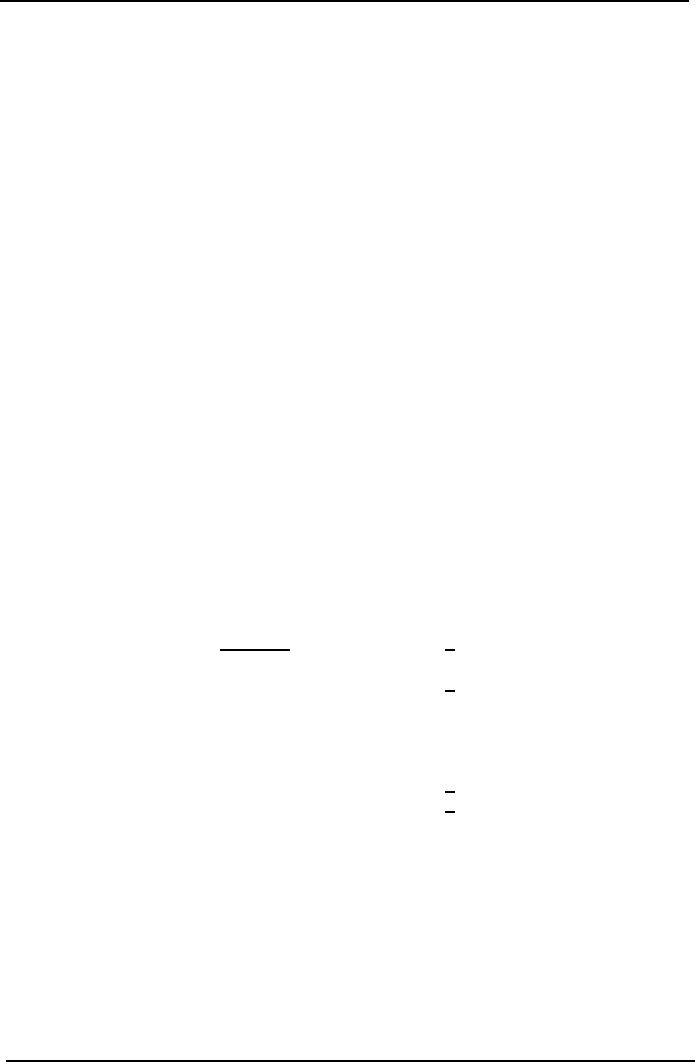
Cost
& Management Accounting
(MGT-402)
VU
In
absorption
costing, fixed
manufacturing overheads are
absorbed into cost units.
Thus stock is
valued
at absorption cost and fixed
manufacturing overheads are
charged in the profit and
loss
account
of the period in which the
units are sold.
In
marginal
costing,
fixed manufacturing overheads
are not absorbed into
cost units, Stock is
valued
at marginal (or variable) cost and
fixed manufacturing overheads
are treated as period
costs
and
are charged in the profit
and loss account of the
period in which the overheads
are incurred.
Practice
Question
A
Company produces a single
product and has the
following budget:
Company
Budget Cost Per
Unit
Rs.
Selling
price
10
Direct
materials
3
Direct
wages
2
Variable
overhead
1
Fixed
production overhead is Rs.
10,000 per month; production
volume is 5,000 units per
month.
Calculate
the cost per unit to be
used for stock valuation
under:
(a)
Absorption costing
(b)
Marginal costing.
Solution
(a)
Absorption cost per
unit
Rs
Direct
materials
3
Direct
wages
2
Variable
overhead
1
Absorbed
fixed overhead
Rs
10,000
2
5000
units
Cost
per Unit
8
(b)
Marginal
cost per unit
Direct
materials
3
Direct
wages
2
Variable
overhead
1
Cost
per Unit
6
The
stock valuation will be different
for marginal and absorption costing.
Under absorption
costing
stock will include variable
and fixed overheads whereas
under marginal costing stock will
only
include variable
overheads.
Further
practice question explaining the concept
of product cost, period cost
and cost per
unit
under
two product costing
systems:
168
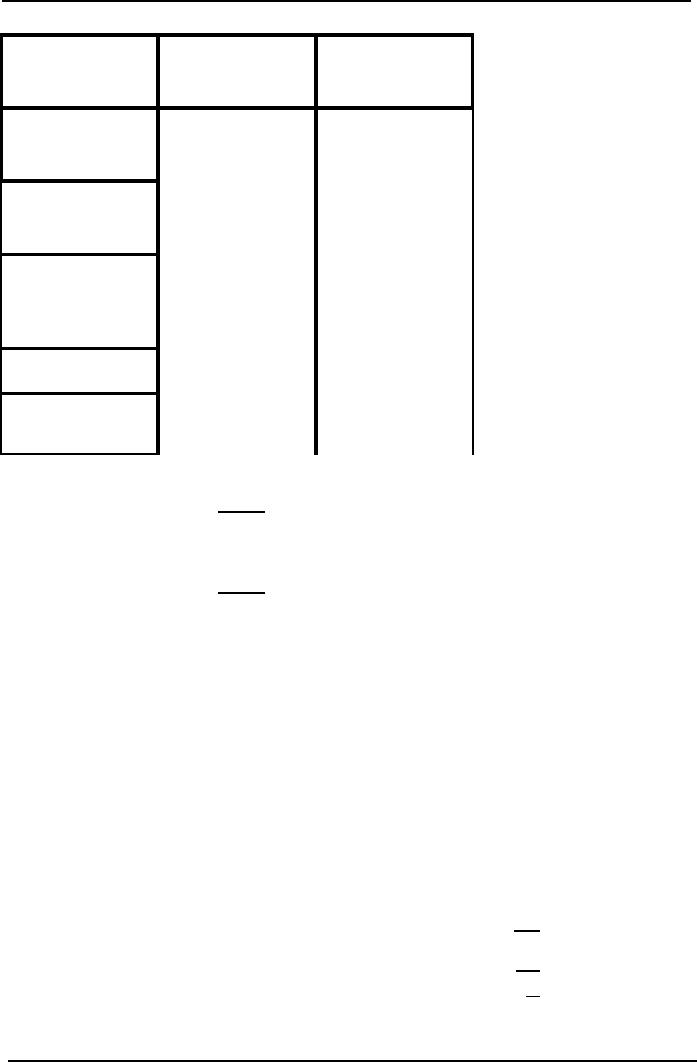
Cost
& Management Accounting
(MGT-402)
VU
Absorption
Costing
Marginal
Costing
100
units
100
units
Direct
Material
8,000
8,000
Rs.
80 per unit
5,000
5,000
Direct
Labor
Rs.
50 per unit
3,000
3,000
Factory
Overhead
2,000
Variable
FOH
Fixed
FOH
18,000
16,000
Product
Cost
2,000
Fixed
Cost
(Period
Expenses)
Cost
per Unit
Under
Absorption costing
18,000
Rs.
180 per unit
100
Under
Marginal costing
16,000
Rs.
160 per unit
100
Contribution
Margin
Contribution
margin is the difference
between sales and the
variable cost of
sales.
This
can be written as:
Contribution
margin = Sales less
variable
costs of sales
Contribution
margin is short for
"contribution to fixed costs
and profits".
The
idea is that after deducting
the variable costs from
sales, the figure remaining is
the amount
that
contributes to fixed costs,
and once fixed costs
are covered the remaining
amount is that of
profits.
Contribution
and profit
Marginal
costing values goods at variable
cost of production (or marginal cost)
and contribution
can
be shown as follows;
Marginal
costing: Profit calculation
Rs
X
Sales
(X)
Less:
variable costs
X
Contribution
margin
(X)
Less:
fixed costs
X
Profit
Profit
is contribution less
fixed
costs. In absorption costing this is
effectively calculated in one
stage
as the cost of sales already
includes fixed costs
169
Cost
& Management Accounting
(MGT-402)
VU
Absorption
costing: profit calculation
Rs
Sales
X
Less:
absorption cost
(X)
Profit
X
Profit
statements under absorption
and marginal costing
To
produce financial statements in
accordance with IFRS 2,
absorption costing must be used,
but
either
marginal or absorption costing can be
useful for internal
management reporting the
choice
made
will affect:
·
The way
in
which profit information is
presented
·
The level of reported profit if
sales do not exactly equal
production (i.e. stock is increasing
or
decreasing).
PRACTICE
QUESTION
This
example continues with the
Company from the above
practice question.
Show
profit statements for the
month if sales are 4,800
units and production is
5,000 units under
(a)
Total absorption costing
(b)
Marginal costing.
Solution
(a)
Profit statement under absorption
casting
Rs.
Rs
Sales
(4,800 @ Rs10)
48,000
Less:
Cost
of sates
Opening
stock
Production
(5,000
@ Rs. 8)
40,000
Less:
Closing stock
(200 @ Rs. 8)
(1,600)
(38.400)
Operating
profit
9,600
(b)
Profit statement under marginal
costing
Sales
(4.800 @ Rs10)
48,000
Less:
Cost
of sates
Opening
stock
Production
(5,000 @ Rs6)
30,000
Less:
Closing stock (200 @ Rs6)
(1,200)
(28,800)
Contribution
19,200
Less:
Fixed overheads
10,000
Operating
profit
9,200
170
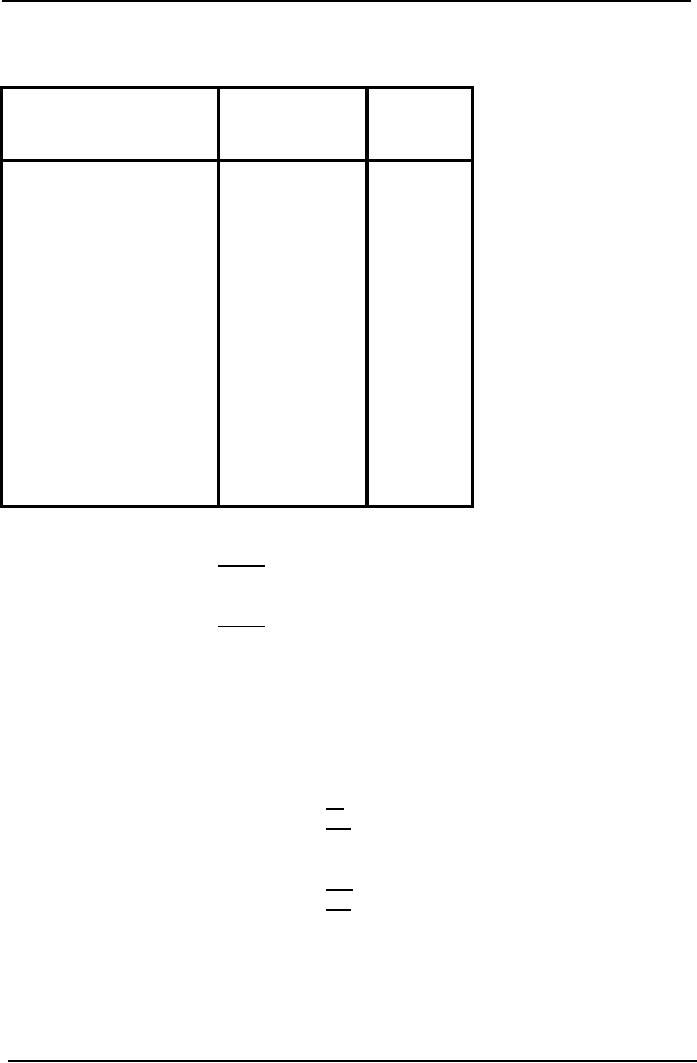
Cost
& Management Accounting
(MGT-402)
VU
PRACTICE
QUESTION
Absorption
Costing
Marginal
100
units
Costing
100
units
Direct
Material
8,000
8,000
Rs.
80 per unit
Direct
Labor
5,000
5,000
Rs.
50 per unit
Factory
Overhead
Variable
FOH
3,000
3,000
Fixed
FOH
2,000
Product
Cost
18,000
16,000
Fixed
Cost
(Period
Expenses)
2,000
Cost
per Unit
Under
Absorption costing
18,000
Rs.
180 per unit
100
Under
Marginal costing
16,000
Rs.
160 per unit
100
Prepare
income statements under absorption
and marginal costing systems assuming
the following
facts:
a)
All
produced units Sold
b)
No.
of units sold
80
No.
of units in closing stock
20
No.
of units produced
100
c)
No.
of units sold
110
No.
of units in opening stock
10
No.
of units produced
100
171
Cost
& Management Accounting
(MGT-402)
VU
Selling
price Rs. 240 per
unit
Solution
a)
All
Units Sold
Absorption
Marginal
costing
costing
Sales
(110 x 240)
24,000
24,000
Less
Product cost
100
x 180
18,000
100
x 160
16,000
Gross
profit
6,000
Contribution
margin
8,000
Less
Fixed cost
0
(2000)
Profit
6,000
6,000
b)
80
units sold & 20 units in closing
stock
Absorption
costing
Marginal
costing
Sales
80 x 240
19,200
19,200
Production
cost
100
x 180 =
18,000
100
x 160 =
16,000
Less
closing stock
20
x 180 =
(3600)
20
x 160 =
(3,200)
14,600
12,800
Less
Fixed cost
2,000
Contribution
Margin
4,600
Profit
4,600
4,400
c)
110
units sold
Absorption
costing
Marginal
costing
Sales
110 x 240
26,400
26,400
Opening
stock
10
x 180 =
1,800
10
x 160 =
1,600
Production
cost
100
x 180 =
18,000
100
x 160 =
16,000
19,800
17,600
Less
Fixed cost
2,000
Contribution
Margin
6,600
Profit
6,600
6,800
Reconciliation
of the difference in profit
The
difference in profit is due to there
being a movement in stock levels - an
increase from 0 to
200
units over the
month.
172
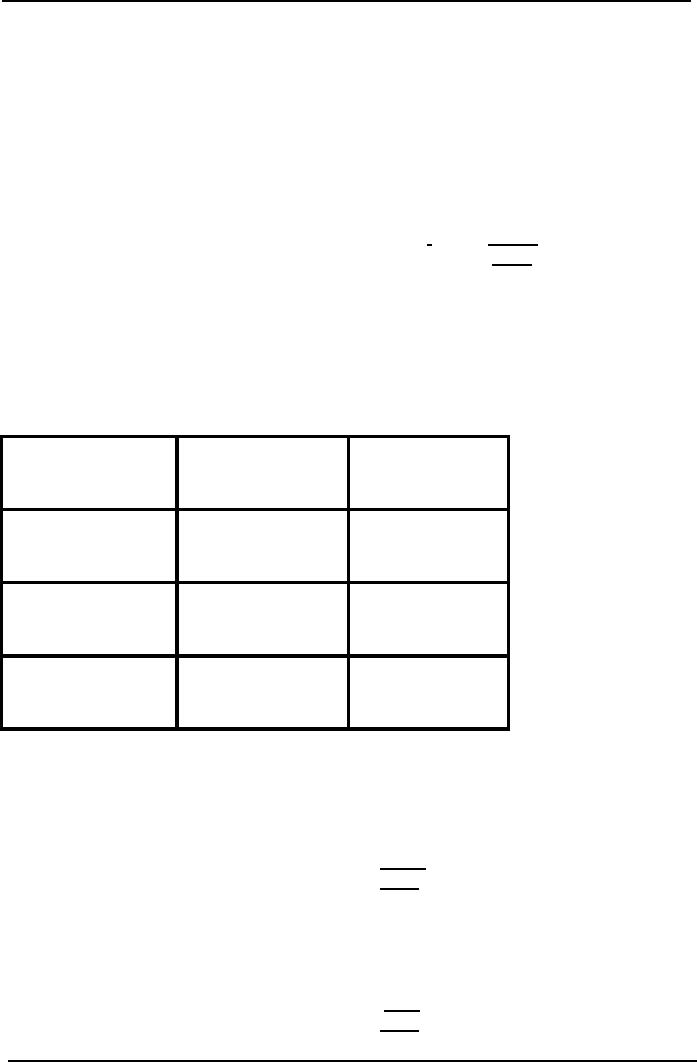
Cost
& Management Accounting
(MGT-402)
VU
Under
absorption costing closing stock has been
valued at Rs 1,600 (i.e. Rs 8 per
unit which
includes
Rs 2 of absorbed fixed overheads).
Under marginal costing the increase in
stock is valued
at
Rs 1,200 (i.e. at Rs 6 per
unit) and all fixed
overheads are charged to the
profit and loss
account.
Only
if stock is rising or falling will
absorption costing give a different
profit figure from
marginal
costing.
If sales equal production,
the fixed overheads absorbed
into cost of sales under
absorption
costing
will be the same as the
period costs charged under marginal
costing and thus the
profit
figure
will be the same.
The
two profit figures can
therefore be reconciled as
follows:
Rs
Absorption
costing profit
9,600
Less:
fixed costs included in the
increase in stock (200 x
Rs2)
(400)
Marginal
costing profit
9,200
If
stock levels are rising from
opening to closing balance
Absorption
Costing profit > Margin Costing
profit
If
stock levels are falling
from opening to closing
balance
Absorption
Costing profit < Margin Costing
profit
(Fixed
costs carried forward are
charged in this period, under
absorption costing)
If
stock levels are the
same
Absorption
Costing profit = Margin Costing
profit
Absorption
Costing Marginal
Costing
Produced
units = Units
Same
Profit
Same
Profit
sold
Produced
units > Units
More
Profit
Less
Profit
sold
Produced
units < Units
Less
Profit
More
Profit
sold
Reconciliation
of the above practice question
b)
80
units sold & 20 units in closing
stock
Rs
Absorption
Profit
4,800
Less
Closing Stock @ Fixed FOH Rate
20
x
20
(400)
Marginal
Costing Profit
4,400
c)
110
units sold with an opening stock of 10
units
Absorption
Profit
6,600
Add
Opening Stock @ Fixed FOH
Rate
10
x
20
200
Marginal
Costing Profit
6,800
173

Cost
& Management Accounting
(MGT-402)
VU
Reconciliation
formula to learn
Rs
Profit
as per absorption costing
system
xxx
Add
Opening stock @ fixed FOH rate at opening
date
xxx
Less
Closing stock @ fixed FOH rate at closing
date
xxx
Profit
as per marginal costing system
xxx
Advantages
of marginal costing
(Relative
to the absorption
costing)
Preparation
of routine operating statements using
absorption costing is considered less
informative
for
the following
reasons:
1.
Profit per unit is a
misleading figure: in the
example above the operating
margin of Rs2 per
unit
arises because fixed
overhead per unit is based
on output of 5,000 units. If
another basis
were
used margin per unit
would differ even though
fixed overhead was the
same amount in
total
2.
Build-up or run-down of stocks of
finished goods can distort
comparison of period operating
statements
and obscure the effect of
increasing or decreasing
sales.
3.
Comparison between products can be
misleading because of the
effect of arbitrary
apportionment
of fixed costs. Where two or
more products are
manufactured in a factory
and
share
all production facilities, the
fixed overhead can only be
apportioned on an arbitrary
basis.
4.
Marginal costing emphasizes variable
costs per unit and
fixed costs in total whereas
absorption
costing
accounts for all production
costs to calculate unit
cost. Marginal costing
therefore
reflects
the behavior of costs in
relation to activity. Since
most decision-making problems
involve
changes to activity, marginal costing is
more appropriate for short-run
decision-making
than
absorption costing.
PRACTICE
QUESTION
This
practice question illustrates the
misleading effect on profit
which absorption costing can
have.
A
company sells a product for
Rs10. and incurs Rs4 of
variable costs in its manufacture.
The fixed
costs
are Rs900 per year
and are absorbed on the
basis of the normal
production volume of
250
units
per year. The results for
the last four years,
when no expenditure variances
arose- were as
follows:
2nd year
3rd year
4th
year Total
Item
1st
year
units
units
units
units
Opening
stock
200
300
300
Production
300
250
200
200
950
300
450
500
500
950
Closing
stock
200
300
300
200
200
Sales
100
150
200
300
750
Rs
Rs
Rs
Rs
Rs
Sales
value
1,000
1,500
2,000
3,000
7,500
Prepare
a profit statement under absorption
and marginal costing.
174
Cost
& Management Accounting
(MGT-402)
VU
Solution
The
profit statement under absorption costing
would be as follows:
1st year
2nd year
3rd year
4th year
Items
Total
Rs.
Rs.
Rs.
Rs.
Rs.
Opening
stock @ Rs7.60
1,520
2,280
2,280
Variable
costs
of
1,200
1,000
800
800
3,800
production
@ Rs4
Fixed
costs ® 900/250
1,080
900
720
720
3,420
=Rs3.60
2,280
3,420
3,800
3,800
7,220
Closing
stock @Rs7.60
1,520
2,280
2,280
1,520
1,520
Cost
of sales
(760)
(1,140)
(1,520)
(2,280)
(5,700)
(Under)/over
absorption
180
Nil
(180)
(180)
(180)
(w)
Net
Profit
420
360
300
540
1,620
Working:
Calculation
of over / under
absorption
Fixed
cost control account
Incurred
Year 1
900
Absorbed
1,080
300
x Rs. 3.60
Over
absorption
180
1,080
1,080
Year
2
900
250
x Rs. 3.60
Year
3
900
200
x Rs. 3.60
720
Under
absorption
180
900
900
Year
4
900
200
x 3.60
720
Under
absorption
180
900
900
175
Cost
& Management Accounting
(MGT-402)
VU
If
marginal costing had been used
instead of absorption, the results
would have
been
shown as
follows:
Item
1st
year
2nd
year
3rd
year
4th
year
Total
Rs
Rs
Rs
Rs
Rs
Sales
1,000
1,500
2,000
3,000
7,500
Variable
cost of sales
(@
Rs4)
400
600
800
1,200
3,000
Contribution
margin 600
900
1,200
1,800
4,500
Fixed
costs
900
900
900
900
3,600
Net
profit/ (loss)
(300)
-
300
900
900
The
marginal presentation indicates clearly that
the business must sell at
least 150 units per
year to
break
even, i.e. Rs900 + (10 -
4), whereas it appeared, using
absorption costing, that even at
100
units
it was making a healthy
profit.
The
total profit for the
four years is less under
the marginal principle because
the closing stocks at
the
end of the fourth year
are valued at Rs800 (Rs4 x
200) instead of Rs 1,520,
i.e. Rs720 of the
fixed
costs are being carried
forward under the absorption
principle.
The
profit figures shown may be reconciled as
follows:
Year
1
Year
2
Yea
3
Yea
r4
Total
Rs
Rs
Rs
Rs
Rs
Profit
/ (loss)
Under
marginal costing
(300)
Nil
300
900
900
Add:
Fixed overheads
Absorbed
in stock increase
200
x Rs3.60 =
720
100
x Rs3.60=
360
200
x Rs3.60=
720
Less:
Fixed overheads
Absorbed
in stock decrease
100
x 3.60=
(360)
Profit
per absorption
420
360
300
540
1,620
Problem
Questions
Q.1.
A
factory manufactures three components X,
Y and Z and the budgeted
production for the
year
is 1,000 units1,500 units and
2,000 units respectively. Fixed overhead
amounts to Rs6.750
and
has
been apportioned on the
basis of budgeted units: Rs
1,500 to X, Rs 2,250 to Y and Rs
3,000 to
Z.
Sales and variable costs
are as follows:
X
Y
Z
Selling
price Rs.
4
6
5
Variable
cost Rs.
1
4
4
Q.
2. A
company that manufactures one product
has calculated its cost on a
quarterly production
budget
of 10.000 units. The selling
price was Rs 5 per unit.
Sales in the four successive
quarters of
the
last year were as
follows:
Quarter
1
10,000
units
Quarter
2
9,000
units
Quarter
3
7,000
units
176

Cost
& Management Accounting
(MGT-402)
VU
Quarter
4
5,500
units
The
level of stock at the beginning of the
year was 1,000 units
and the company maintained
its
stock
of finished products at the
same level at the end of
each of the four
quarters.
Based
on its quarterly production budget, the
cost per unit was as
follows:
Cost
per unit
Rs.
Prime
cost
3.50
Production
overhead
0.75
Selling
and administration
overhead
0.30
Total
4.55
Fixed
production overhead, which
has been taken into account
in calculating the above figures,
was
Rs 5,000 per quarter.
Selling and administration
overhead was treated as
fixed, and was
charged
against sales in the period in
which it was
incurred.
You
are required to present a tabular
statement to bring out the
effect on net profit of
the
declining
volume of sales over the
four quarters given, assuming in
respect of fixed
production
overhead
that the company:
(a)
Absorbs it at the budgeted rate
per unit
(b)
Does not absorb it into
the product cost, but
charges it against sales in
each quarter (i.e.
the
company
uses marginal costing).
Advantages
of Absorption Costing
(Relative
to marginal costing)
Absorption
costing is widely used and
you must understand both
principles.
The
only difference between using
absorption costing and marginal costing as
the basis of stock
valuation
is the treatment of fixed
production costs.
The
arguments used in favor of absorption
costing are as follows:
1.
Fixed costs are incurred
within the production
function, and without those
facilities
production
would not be possible. Consequently such
costs can be related to
production
and
should be included in stock
valuation.
2.
Absorption costing follows the
matching concept by carrying forward a
proportion of the
production
cost in the stock valuation to be matched
against the sales
value
3.
When the items are
sold.
4.
It is necessary to include fixed
overhead in stock values for
financial statements
routine
cost
accounting using absorption costing
produces stock values which
include a share of
fixed
overhead.
5.
Overhead allotment is the
only practicable way of obtaining
job costs for estimating
prices
and
profit analysis.
6.
Analysis of under-/over-absorbed overhead is
useful to identify inefficient
utilization of
production
resources.
Arguments
against absorption
costing
The
fixed costs do not change as
a result of a change in the
level of activity. Therefore such
costs
cannot
be related to production and
should not be included in
the stock valuation.
The
inclusion of fixed costs in
the stock valuation conflicts
with the prudence concept,
therefore
the
fixed costs should be
written off in the period in
which they are
incurred.
177
Cost
& Management Accounting
(MGT-402)
VU
PRACTICE
QUESTION
Following
information relates to a manufacturing
company
Selling
price
Rs.
20 per unit
Units
produced
30,000
Units
sold
20,000
Variable
cost
Direct
material
Rs.
5 per unit
Direct
labor
Rs.
3 per unit
F.O.H
Rs.
1 per unit
Selling
& administrative expenses
Rs.
2 per unit
Fixed
cost
F.O.H
Rs
120,000
Selling
& administrative expenses
Rs.
15,000
Solution
Working
for cost per unit
under
Absorption
Costing
Fixed
FOH Rate
120,000/30,000
=
4
Variable
FOH Rate
Direct
Material
5
Direct
Labor
3
FOH
1
9
13
Marginal
Costing
Variable
FOH Rate
Direct
Material
5
Direct
Labor
3
FOH
1
9
Income
Statement under Absorption Costing
System
Rupees
Sales
(20,000 x 20)
400,000
Less
Cost of goods sold
Opening
stock
0
Add
Production cost
(13
x 30,000)
390,000
Less
Closing stock
(13
x 10,000)
130,000
260,000
Gross
Profit
140,000
Less
Operating expenses
Selling
& Administrative expenses
Variable
expenses
(20,000
x 2) =
40,000
Fixed
expenses
15,000
55,000
Net
profit
85,000
178
Cost
& Management Accounting
(MGT-402)
VU
Income
Statement under Marginal Costing
System
Rupees
Sales
400,000
Less
Variable cost of goods sold
Opening
stock
0
Add
Variable production cost
(9
x 30,000)
270,000
Less
Closing stock
(9
x 10,000)
90,000
180,000
Gross
contribution margin
220,000
Less
Variable Selling & Admin
Expenses
(2
x 20,000)
40,000
Contribution
margin
180,000
Less
Fixed expenses
Production
120,000
Selling
& Admin Expenses
15,000
135,000
Net
Profit
45,000
Reconciliation
Profit
as absorption costing
85,000
Less
Closing stock (10,000 x 4)
40,000
Profit
as per Marginal costing
45,000
Multiple
Choice Questions
Q.1.
When
comparing the profits reported using marginal costing
with those reported using
absorption
costing in a period when closing stock was
1,400 units, opening stock was
2,000 units,
and
the actual production was
11,200 units at a total cost
of Rs 4.50 per unit compared
to a target
cost
of Rs 5.00 per unit, which
of the following statements is
correct?
A
Absorption costing reports profits Rs
2,700 higher
B
Absorption costing reports profits Rs
2,700 lower
C
Absorption costing reports profits Rs
3,000 higher
D
There is insufficient data to
calculate the difference between
the reported profits
Q.
2. When
comparing the profits reported under
marginal and absorption costing during a
period
when
the level of stocks
increased:
A.
An
absorption costing profits will be
higher and closing stock valuations
lower than those
under
marginal
costing
B.
An
absorption costing profits will be
higher and closing stock valuations
higher than those
under
marginal costing
C.
The
marginal costing profits will be higher
and closing stock valuations lower
than those under
absorption
costing
D. The
marginal costing profits will be lower
and closing stock valuations higher
than those under
absorption
costing
Q.
3. Contribution
margin is:
A.
Sales less total
costs
B.
Sales less variable
costs
C.
Variable costs of production less
labor costs
D.
None of the above
179
Cost
& Management Accounting
(MGT-402)
VU
Problem
Question
Rays
Company manufactures and sells electric
blankets.
The
selling price is Rs 12.
Each
blanket has the unit
cost set out
below.
Administration
costs are incurred at the
rate of Rs20 per
annum.
The
company achieved the
production and sales of blankets
set out below.
The
following information is also
relevant:
1.
The overhead costs of Rs2
and Rs3 per unit
have been calculated on the
basis of a budgeted
production
volume of 90 units.
2.
There was no
inflation.
3.
There, was no opening stock.
Unit
cost
Rs.
Direct
material
2
Direct
labor
1
Variable
production overhead
2
Fixed
production overhead
3
8
Year
1
2
3
Production
100
110
90
Sales
90
110
95
You
are required:
(a)
To prepare an operating statement for
each year using
(i)
Marginal costing and (ii)
absorption costing
(b)
To explain why the profit
figures reported under the two techniques
disagree.
180
Cost
& Management Accounting
(MGT-402)
VU
LESSON#
29
COST
VOLUME PROFIT
ANALYSIS
(Contribution
Margin Approach)
This
topic is based on your knowledge of
cost behavior and shows
how this is applied in
a
decision-making
situation. Cost-volume-profit (CVP)
analysis is a technique which
uses cost
behavior
theory to analyze the
activity level as to the
contribution margin and fixed
cost
relationship
and the level at which
there is neither a profit
nor a loss (the break-even
activity level).
This
is important management information
because managers need to
know the minimum
activity
level
that must be achieved in
order that the business
does not incur
losses.
CVP
analysis may also be used to
predict profit levels at different
volumes of activity based
upon
the
assumption that costs and
revenues exhibit a linear relationship
with the level of
activity.
Cost-volume-profit
analysis determines how
costs and profit react to a
change in the volume
or
level
of activity, so that management
can decide the 'best'
activity level.
Following
are the assumptions which
are used in CVP
analysis.
1.
Variable costs and selling price (and
hence contribution) per unit
are assumed to be
unaffected
by
a change in activity
level.
2.
Fixed costs, whilst not affected in
total by a change in the
activity level, will change
per unit as
the
activity level changes and
there are more (or
less) units over which to
"share out" the
fixed
costs
If fixed costs per unit
change with the activity
level, then profit per
unit must also
change.
Thus,
cost-volume-profit analysis is always
based on contribution per
unit (assumed to be
constant
unless
a question clearly says otherwise) and
never on profit per unit
because profit per
unit
changes
every time a few more or
less units are
made.
CVP
is a relationship of four
variables
Sales
Volume
Variable
cost
Cost
Fixed
cost
Cost
Net
income
Profit
This
may be understood through
the following equation
Volume
@
sales price
=
Revenue
Cost
matching with the
sales
=
(Cost)
Result
=
Profit
CVP
analysis is a tool for
decision making. There are
two approaches of CVP
analysis:
1.
Contribution margin
approach
2.
Break even analysis
approach
Contribution
Margin Approach & CVP
Analysis
Contribution
margin contributes to meet
the fixed cost. Once
the fixed cost has
been met the
incremental
contribution margin is the
profit.
Income
Statement as per the marginal costing
system is used as a Standard
format of Income
Statement
to analyze the Cost-Volume-Profit
relationship.
Rs.
181
Cost
& Management Accounting
(MGT-402)
VU
Sales
xxx
Variable
Cost
xxx
Contribution
Margin
xxx
Fixed
Cost
xxx
Profit
xxx
PRACTICE
QUESTION
Basic
question
90
units of product "PR" is sold
for Rs. 100 per
unit. Variable cost relating to
production and
selling
is Rs. 75 per unit and
fixed cost is Rs.
2,250.
Q.
1. Management
decides to increase its sales by 10
units.
Required:
Prepare
income statement and analyze.
Solution
Rs.
Rs.
Rs.
Sales
(90 x 100)
9,000
(10 x 100)
1,000
10,000
Variable
cost (90 x 75)
(6,750)
(10 x 75)
(750)
(7,500)
Contribution
margin
2,250
250
2,500
Fixed
cost
(2,250)
0
2,250
Profit
/ Loss
0
250
250
Analysis
This
shows physical increase in volume
causes an increase in contribution
margin and if there
is
not
increase in the fixed cost
because of such change, the
incremental contribution margin is
added
in
the final profits.
Q.
2. Management
decides to increase its sales
price by 10%. Continue with
the Q. 1.
Required:
Prepare
income statement and analyze.
Solution
Sales
100
x Rs 110
11,000
Variable
cost 100 x Rs. 75
(7,500)
Contribution
margin
3,500
Fixed
cost
(2,250)
Profit
1,250
Analysis
This
shows increase in sales
price per unit causes an
increase in the contribution margin, as
there is
not
change in the volume the
fixed will remain unchanged. So the
incremental change is
contribution
margin is included into the
profit.
Q.
3. Management
decides to decrease its sales
price by 10%. Continue with
the Q. 1.
Required:
Prepare
income statement and analyze.
Sales
100
x Rs 90
9,000
Variable
cost 100 x Rs 75
(7,500)
Contribution
margin
1,500
182
Cost
& Management Accounting
(MGT-402)
VU
Fixed
cost
(2,250)
Loss
(750)
Analysis
This
shows decrease in sales
price per unit causes a
decrease in the contribution margin, as
there is
not
change in the volume the
fixed will remain unchanged. So the
change in contribution margin
is
subtracted
from the profits, which
result into a loss of Rs.
750 in this case.
Normally
a decrease in sales price
should case an increase in
the sales volume.
Q.4.
Management
decides to decrease its sales
price by 10% and expects an
increase in sales
volume
by 50%. Continue with the Q.
1.
Required:
Prepare
income statement and analyse.
Solution
Sales
150
x Rs 90
13,500
Variable
cost 150 x Rs 75
(11,250)
Contribution
margin
2,250
Fixed
cost
(2,250)
Loss
0
Analysis
This
shows decrease in sales
price per unit causes a
decrease of Rs. 1,000 in the
contribution
margin,
as well as an increase in volume is
causing an increase in the
profit, this results in an
increase
in profit.
Here
in this scenario the
increase in the volume must
be more than 50% to earn
profits.
Q.5.
Management
decides to decrease its sales
price by 10% and expects an
increase in sales
volume
by 200%. Continue with the
Q. 1.
Required:
Prepare
income statement and analyse.
Solution
Sales
200
x Rs 90
18,000
Variable
cost 200 x Rs 75
(15,000)
Contribution
margin
3,000
Fixed
cost
(2,250)
Profit
750
Analysis
This
shows decrease in sales
price per unit causes a
decrease of Rs. 1,000 in the
contribution
margin,
as well as an increase in volume is
causing an increase in the
profit, this results in an
increase
in profit.
Here
in this scenario the
increase in the volume must
be more than 50% to earn
profits.
Q.6.
Management
decides to increase its sales
volume by 100% and it is
also assumed that
the
fixed
cost also increase upto
Rs. 2,500. Continue with
the Q. 5.
Required:
Prepare
income statement and analyse.
Solution
Sales
200
x Rs 90
18,000
Variable
cost 200 x Rs 75
(15,000)
Contribution
margin
3,000
Fixed
cost
(2,500)
Profit
500
Analysis
183
Cost
& Management Accounting
(MGT-402)
VU
This
shows a decrease in fixed
cost causes a decrease in
the profits.
Q.7.
Management
decides to increase its sales
volume by 100% and it is
also assumed that
the
fixed
cost also increase upto
Rs. 2,500, and also there is
an increase of 20% in the
variable cost.
Continue
with the Q. 6.
Required:
Prepare
income statement and analyse.
Solution
Sales
200
x Rs 90
18,000
Variable
cost 200 x Rs 90
(18,000)
Contribution
margin
0
Fixed
cost
(2,500)
Loss
(2,500)
Sales
***
Variable
cost
(***)
Contribution
margin
***
Fixed
cost
(***)
Profit
/ Loss
***
This
lesson ends up at following
lessons:
1.
At zero contribution margin
the loss will be equal to
the fixed cost
2.
Increase in variable cost
reduces the contribution
margin
3.
Sales Variable cost = Contribution
margin
4.
Contribution margin + Variable cost =
Sales
5.
Contribution margin Fixed cost =
Profit
6.
Profit + Fixed cost = Contribution
margin
7.
Sales - Variable cost = Fixed cost +
Profit
184

Cost
& Management Accounting
(MGT-402)
VU
LESSON#
30
COST
VOLUME PROFIT
ANALYSIS
(Break-even
Approach)
Break-even
Cost-volume-profit
analysis can be used to
calculate break-even.
Break-even
is the point where sales revenue
equals total cost, i.e.
(here is neither a profit
nor a loss.
Profit
(or loss) is the difference
between contribution margin
and fixed costs.
Thus
the break-even point occurs where
contribution margin equals
fixed costs
Target
Contribution Margin
Target
contribution margin is the
amount which if equal to
fixed cost will give
nil net profit,
whereas,
if we need to earn a target
profit, such profit will be
added up into the fixed
cost to have
target
contribution margin.
Contribution
margin per unit can be
assumed to be constant for
all levels of output in the
relevant
range.
Similarly, fixed costs can
be assumed to be a constant amount in
total.
The
relationships may be depicted
thus:
Contribution
Margin per unit
Selling
price per unit less
variable
costs per unit
Total
contribution
Volume
x (Selling price per unit
less
variable
costs per unit)
Target
Contribution Margin
Fixed
costs + Profit target
Target
Sales in number of units
Target
Contribution Margin
Unit
contribution
Contribution
may be calculated in total, or on a
per-unit basis using selling prices
and variable costs
per
unit.
The
difference between contribution and
fixed costs is profit (or
loss); thus when
contribution
equals
fixed costs, break-even occurs. In
this way a target profit may
be converted into a
target
contribution
margin which may be used to
calculate the number of
units required to achieve
the
desired
target profit.
Contribution
margin to sales
ratio
Contribution
to sales ratio (C/S ratio)
=
Contribution
Margin in Rs
Sales
in Rs
Note:
you may encounter the
term profit to volume (or
P/V) ratio, which is
synonymous with the
contribution
to sales ratio. Profit to
volume is an inaccurate description,
however, and should
not
be
used. The C/S ratio is
conveniently written as a
percentage.
Break
even point refers to the
volume (sales) at which the
entity earns no profit and
suffers no
loss.
It
is the point where
Contribution
margin = Fixed cost
And
Target
profit = 0
Contribution
margin Fixed cost = 0
Profit
Contribution
margin = Fixed cost + 0
Profit
At
break even point the
target contribution is equal to
the fixed cost
Contribution
Margin Fixed cost =
Profit
185
Cost
& Management Accounting
(MGT-402)
VU
Contribution
margin = Fixed cost +
Profit
Practice
Question
Q.
1
Income
Statement
Rs.
Sales
700
units x Rs 8
5,600
Variable
cost 700 units x Rs 6
4,200
Contribution
margin
1,400
Fixed
cost
1,000
Profit
400
Variable
cost over sales
4,200
x 100 = 75%
5,600
Contribution
margin over sales
1,400
x 100 = 25%
5,600
Per
Unit Calculation
Sales
price
Rs
8
Less
Variable cost
(6)
Contribution
Margin
2
6
/ 8 x 100 = 75%
2
/ 8 x 100 = 25%
Total
per
unit
%
Sales
700
units x Rs 8
5,600
8
100%
Variable
cost 700 units x Rs 6
4,200
6
75%
Contribution
margin
1,400
2
25%
Fixed
cost
1,000
Profit
400
Break
even sales in
Rupees
Remember
the formula to calculate required
amount in absence of certain
information:
Given
Amount x
%
of required amount =
Required
Amount
%
of given amount
Here,
to calculate break even
sale, we need contribution
margin to be equal to the
fixed cost so
that
the profit is zero.
Now
if the target contribution
margin is equal to Rs. 1,000
then what would be the
sales at this
point?
Now
the above formula will be
applied to calculate breakeven
sales:
Target
CM is the given amount and its % is
25, so the sale which is
100% will be:
Rs
1,000 x
100
= Rs 4,000
25
OR
186
Cost
& Management Accounting
(MGT-402)
VU
Rs
1,000 x 1 =
Rs.
4,000
25
OR
Rs
1,000 =
Rs.
4,000
25
So,
Break
even Sales in Rs. =
Fixed
cost
C/S
ratio
Check
Income
Statement
Rs.
Sales
500
units x Rs 8
4,000
Variable
cost 500 units x Rs 6
3,000
Contribution
margin
1,000
Fixed
cost
1,000
Profit
0
Break
even sales in units
Simple
formula:
Break
even sales in Rupees =
number of units
Sales
price per unit
4,000
= 500 units
8
Direct
formula
Target
CM
CM
per unit
Here
the target contribution
margin is equal to the
fixed
Fixed
Cost
CM
per unit
Rs.
1,000
=
500 units
2
Break
even sales in Rupees
=
Target
CM
Contribution
to sales ratio
Break
even sales in units=
Target
CM
Contribution
margin per unit
Q.
2
Calculate
Sales to target profit of
Rs. 500, using the
information given in practice question
no. 1.
Sales
***
Variable
cost
(***)
Contribution
margin
***
Fixed
cost
1,000
Profit
500.
187
Cost
& Management Accounting
(MGT-402)
VU
Target
contribution margin = Fixed cost +
Target profit
=
1,000
+
500
=
1,500
Sales
to earn target profit of Rs.
500
=
Rs 1,500 x 100 = Rs.
6,000
25
=
Rs
1,500 = Rs. 6,000
0.25
Check
Income
Statement
Rs.
Sales
6,000
Less
Variable cost
4,500
Contribution
Margin
1,500
Less
Fixed cost
1,000
Profit
500
Fixed
cost + Target profit
Contribution
to sales ratio
Problem
Question
A
company sold fans at Rs 2,000 each.
Variable cost Rs. 1,200 each
and fixed cost Rs.
610,000.
Calculate:
a.
Calculate break even sales
in Rupees.
b.
Break even sales in
units.
c.
Sales in units to earn a
profit of Rs. 20,000.
Multiple
Choice Questions
The
following details relate to a shop
which currently sells 25,000
pairs of shoes
annually.
Selling
price per pair of
shoes
Rs.40
Purchase
cost per pair of
shoes
Rs.25
Total
annual fixed costs
Rs.
Salaries
100,000
Advertising
40,000
Other
fixed expenses
100,000
Q.
1
What
is the contribution per pair
of shoes?
A
Rs.15
B
Rs.30
C
Rs.7.50
D
Rs.18
Q.
2
What
is the break-even number of
pairs of shoes?
A
14,000
B
16,000
C
28,000
D
32,000
188
Cost
& Management Accounting
(MGT-402)
VU
LESSON#
31
BREAK
EVEN ANALYSIS MARGIN OF
SAFETY
A
company sold fans at Rs 2,000 each.
Variable cost Rs. 1200 each
and fixed cost Rs.
60,000.
Calculate:
a.
Calculate break even sales
in Rupees.
b.
Break even sales in
units.
c.
Sales in units to earn a
profit of Rs. 20,000.
Contribution
to sales ratio = Contribution
margin
Sales
=
800 / 2,000 = 0.4
a)
Break-even sales in Rupees
=
Fixed
cost
C/S
Ratio
=
60,000 / 0.4 = Rs.
150,000
b)
Break-even sales in units
=
Fixed
cost
Contribution
margin per unit
=
60,000 / 800 = 75
units
c)
Target profit Rs
20,000
Target
contribution = Target profit + Fixed
cost
=
Target
contribution margin
Contribution
margin per unit
=
80,000 / 800 = 1,000
units
Check
Break even sales
Sales
75 x 2,000
150,000
Less
Variable cost (150,000 x 60%)
90,000
Contribution
margin
60,000
Less
Fixed cost
60,000
Profit
0
Check
Target Profit
Sales
100 x 2,000
200,000
Less
Variable cost (200,000 x 60%)
90,000
Contribution
margin
80,000
Less
Fixed cost
60,000
Profit
20,000
Margin
of Safety (MOS)
The
margin of safety is the difference
between budgeted sales
volume and break-even
sales
volume;
it indicates the vulnerability of a
business to a fall in demand. It is
often expressed as a
percentage
of budgeted sales
Budgeted
sales Break-even sales =
Margin of safety
MOS
ratio =
MOS
x 100 = %
Budgeted
Sales
189
Cost
& Management Accounting
(MGT-402)
VU
PRACTICE
QUESTION
Q.
1
Budgeted
Income statement
Rs.
Budgeted
Sales 700 units x Rs
8
5,600
Variable
cost 700 units x Rs 8
4,200
Contribution
margin
1,400
Fixed
cost
1,000
Profit
400
Break
even Sales 500 units x Rs
8
4,000
Variable
cost 500 units x Rs 6
3,000
Contribution
margin
1,000
Fixed
cost
1,000
Profit
0
Percentage
of MOS can be calculated in
different ways:
·
Based
on Budgeted sales
Budgeted
sales Break-even
sales
=
5,600 4,000 =
1,600
Margin
of safety x 100 = %
Budgeted
sales
1,600
x 100 = 28.57%
5,600
·
Using
Budget profit
Budgeted
profit
x
100 = %
Budgeted
contribution margin
400
x 100 = 28.57%
1,400
·
Using
profit and contribution
ratio
Profit
to sales ratio x 100 =
%
Contribution
to sales
Profit
to sales ratio =
400
/ 5,600 x 100 = 7.14%
Contribution
to sales ratio = 1,400 /
5,600 x 100 = 25%
7.14%
x 100 = 28.57%
25%
190
Cost
& Management Accounting
(MGT-402)
VU
Q.
2
Budgeted
Income Statement
Rs.
Budgeted
sales
10,000
Less
variable cost
6,000
Contribution
margin
4,000
Less
Fixed cost
2,500
Profit
1,500
Calculate
Margin of safety
ratio?
Budgeted
profit
x
100 = %
Budgeted
contribution margin
1,500
/ 1,000 x 100 = 37.5%
P/S
Ratio x 100 = %
C/S
Ratio
Profit
/ Sales x 100 = 1,500 /
10,000 x 100 = 15%
Contribution
margin / Sales x 100 = 4,000
/ 10,000 x 100 = 40%
Margin
of safety ratio =
15%
x 100 = 37.5%
40%
Q.
3
Sales
= Rs. 50,000
Margin
of safety = 25%
Calculate
break even sales?
Step
I
Calculate
absolute amount of
MOS
MOS
= 50,000 x 25% = Rs.
12,500
Step
II
Calculate:
Breakeven sales through the
following formula:
MOS
= Budgeted sales - Break
even sales
Budgeted
sales - MOS = Break even
sales
50,000
-12,500 = 37,500
Q.
4
Sales
= Rs. 50,000
MOS
ratio = 25%
Budgeted
profit = Rs. 2,500
a).
Compute projected profit
b).
Prepare Budgeted sales
sheet
Budgeted
sales
50,000
Less
Variable cost
40,000
Contribution
margin
10,000
191
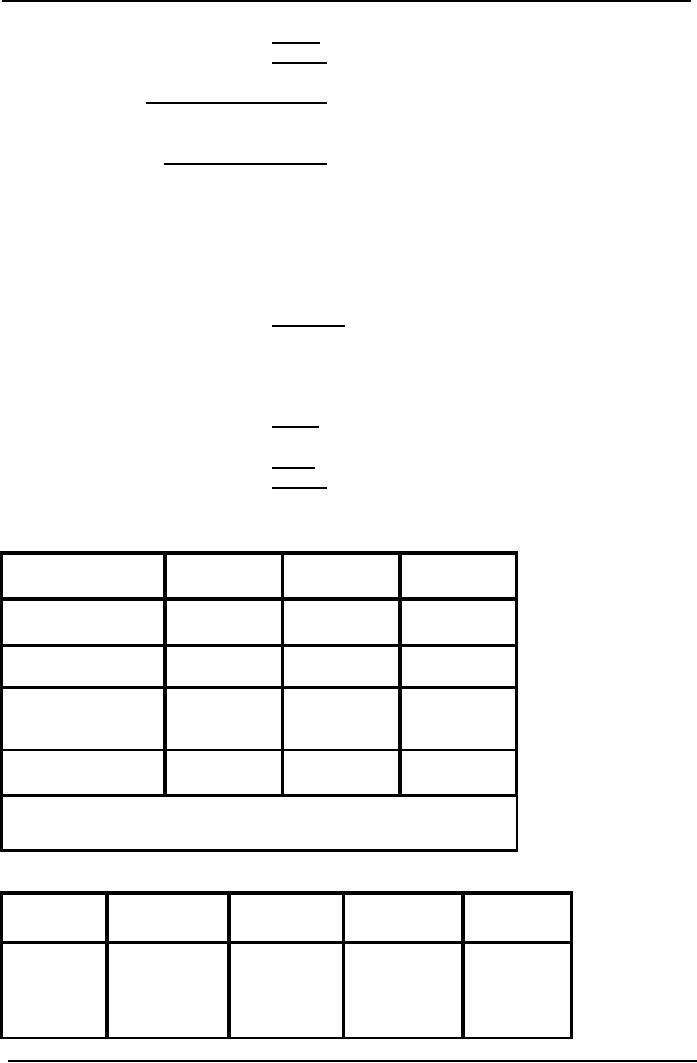
Cost
& Management Accounting
(MGT-402)
VU
Less
Fixed cost
7,500
Profit
2,500
MOS
ratio =
Profit
Contribution
margin
=
2500
Contribution
margin
0.25
contribution margin =
2,500
Contribution
margin = 2,500 / 0.25
Contribution
margin = Rs. 10,000
Break
even sales =
Fixed
cost
C/S
ratio
Budgeted
sales
37,500
Less
variable cost
30,000
Contribution
margin
7,500
Less
Fixed cost
7,500
Profit
0
Q.
4
Combined
Break-even sales
X
Y
Z
Rupees
Rupees
Rupees
Selling
price (P.U)
2.50
4
10
Variable
cost (P.U)
(1.50)
(2)
(4)
Contribution
margin
1
2
6
(P.U)
Sales
Volume
80,000
30,000
15,000
Fixed
cost
Rs.
1,50,000
Solution
X
Y
Z
Total
Rupees
Rupees
Rupees
Rupees
Contribution
(1
x 80,000)
(2
x 30,000)
(6
x 15,000)
2,30,000
margin
=80,000
=
60,000
=
90,000
192
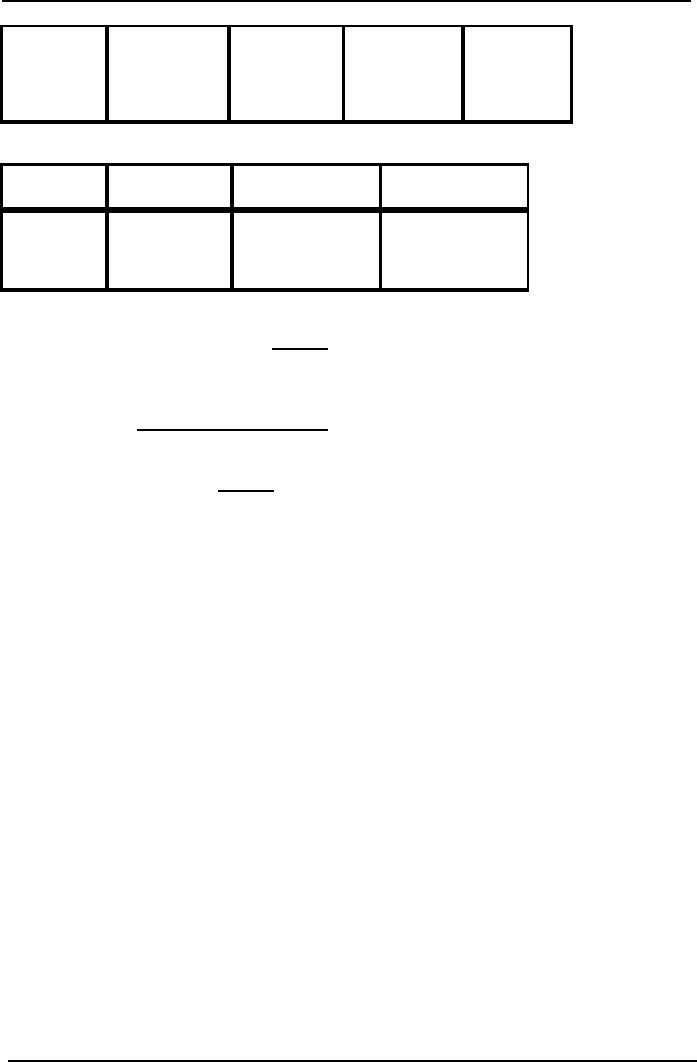
Cost
& Management Accounting
(MGT-402)
VU
Sales
(2.5
x 80,000)
(4
x 30,000)
(10
x 15,000)
4,70,000
=
2,00,000
=
1,20,000
=
1,50,000
Product
wise contribution to sales
ratio
X
Y
Z
Contribution
80,000
/
60,000
/ 1,20,000 x 90,000 / 1,50,000
x
margin
ratio
2,00,000
x 100
100
100
=
40%
=
50%
=
60%
Combined
contribution to sales
ratio
230,000
470,000
=
48.936 or 0.489
Break
even sales = Target
contribution margin
C/S
ratio
=
150,000
0.48936
=
306,523
PRACTICE
QUESTION
Q.
1
Victoria
Company produces a single
product. Last year's income statement is
as follows:
Sales
(29,000 units)
Rs.
1,218,000
Less:
Variable costs:
812,000
Contribution
margin
406,000
Less:
Fixed expenses
300,000
Net
income
106,000
Required:
1.
Compute the break-even point
in units and sales
Rs.
2.
What was the margin of
safety for Victoria last
year?
3.
Suppose that Victoria
Company is considering an investment in
new technology that
will
increase
fixed costs by Rs. 250,000
per year but will
lower variable costs to 45%
of sales.
Units
sold will remain unchanged. Prepare a
budgeted income statement assuming
that
Victoria
makes this investment. What
is the new break-even point
in units and sales
Rs,
assuming
that the investment is
made?
Q.
2
Crown
Star Products produces two
different types of lamps, a
floor lamp and a desk
lamp. Floor
lamps
sell for Rs. 30,
Desk lamps for Rs.
20, the projected income statement for
the coming year
follows:
Sales
Rs.
600,000
Less:
Variable costs;
400,000
Contribution
margin
200,000
193
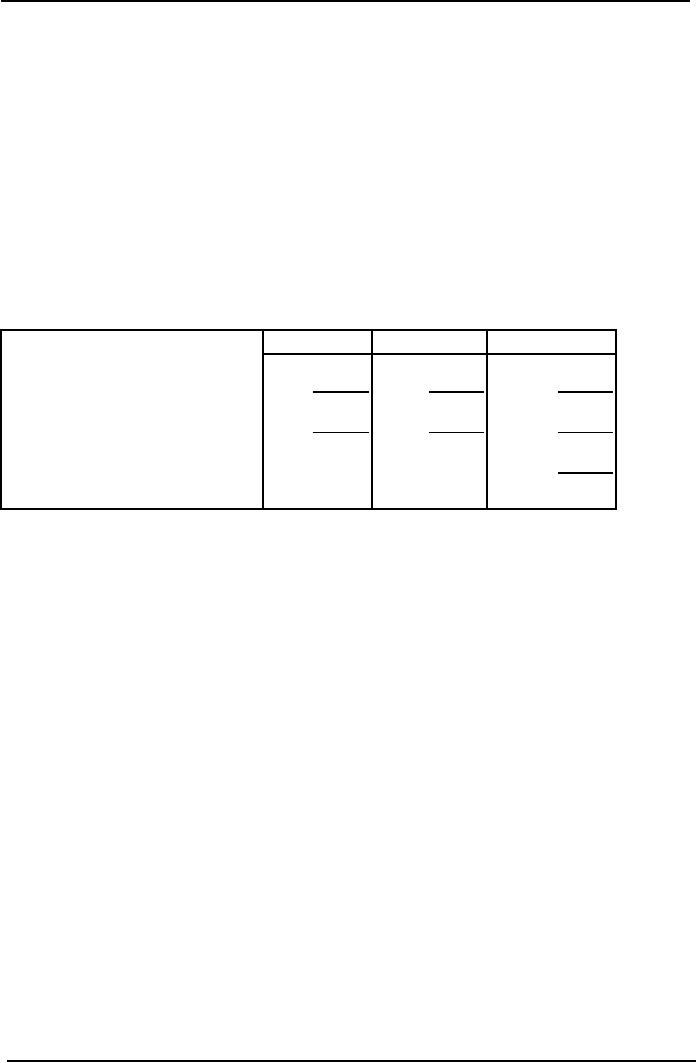
Cost
& Management Accounting
(MGT-402)
VU
Less:
Fixed expenses
150,000
Net
income
50,000
The
owner of Crown Star
estimates that 60% of the
sales revenues will be produced by
floor lamps
with
the remaining 40% by desk
lamps. Floor lamps are
also responsible for 60% of
the variable
expenses.
Of the fixed expenses, one
third is common to both
products, and one-half are
directly
to
the floor lamp product
line.
Required:
1.
Compute the sales revenue
that must be earned for
Crown Star to reach at break
even.
Compute
the number of floor lamps
and desk lamps separately
that must be sold for Crown
Star
to
break even.
Question
No. 3
Unicorn
Enterprises produces two strategy
games, Mystical Wars and
Magical Dragons. The
projected
income for the coming year,
segmented by product line,
follows:
Wars
Dragons
Total
Sales
Rs.
500,000
Rs.
800,000
Rs.
1,300,000
Less:
Variable costs
230,000
460,000
690,000
Contribution
margin
270,000
340,000
10,000
Less:
Direct fixed expenses
120,000
180,000
300,000
Product
margin
150,000
160,000
310,000
Less:
Common fixed expenses
210,000
Operating
income
100,000
The
selling prices are Rs.
10 for
Mystical Wars and Rs.
20 for
Magical Dragons.
Required:
1.
Compute the number of
games of each kind that
must be sold for Unicorn Enterprises
to
reach
its break-even.
2.
Compute the revenue that
must be earned to produce a net income of
10% of sales revenue.
Question
No. 4
Khalid
is a salt merchant who
supplies salt to general merchants in
Lahore city. In the year of
2000
he
sold 35,000 bags of salt.
One bag consists of 50kg
salt. He purchases slat in
raw form and
then
grinds
it, fills it in bags and
then sold it, Sale price
per bag is Rs.
45.
He
purchases the raw salt ®
Rs. 400 per ton (1
ton consist of 1000 kg). Grinding
cost is Rs, 7 per
bag,
carriage outward cost is Rs.
5 per bag, he also purchases
empty bags ® 400 per
100 bags.
Rent
of
shop Rs, 1500 per month.
Electricity and phone
expense is Rs, 16000 per
year (assume fixed).
Depreciation
of plant is Rs. 3,680 per
year.
In
the year 2001 it is expected
that sale price and
demand will remain the same
but all the
variable
costs
will increased by 15%. All
the fixed costs will
also increase by 10%.
Required:
1.
Break even point in units
and Rs. in both
years.
2.
Income statements of both
years.
3.
If he wants to earn Rs. 350,000 in
the year of 2001 how
many bags he has to
sell.
4.
Assume that demand in 2001
will remain the same he wants to
keep same contribution
margin
ratio
as in year 2000 what'-will be
the new selling price per
bag.
194

Cost
& Management Accounting
(MGT-402)
VU
LESSON#
32
BREAKEVEN
ANALYSIS CHARTS AND
GRAPHS
The
conventional break-even chart
The
conventional break-even chart
plots total costs and
total revenues at different
output levels
and
shows the activity level at
which break-even is
achieved.
Conventional
break-even chart
The
chart or graph is constructed as
follows:
·
Plot fixed costs, as a
straight line parallel to the
horizontal axis
·
Plot sales revenue and
variable costs from the
origin
·
Total costs represent fixed
plus variable costs.
The
point at which the sales
revenue and total cost lines
intersect indicates the breakeven
level of
output.
The amount of profit or loss
at any given output can be read
off the chart.
By
multiplying the sales volume
by the unit price at the
break-even point the level
of revenue
needed
to break even can be
determined.
The
chart is normally drawn up to
the budgeted sales
volume.
The
difference between the
budgeted sales volume and
break-even sales volume is referred to
as
the
margin of safety.
Usefulness
of charts
The
conventional form of break-even charts
was described above. Many
variations of such charts
exist
to illustrate the main relationships of
costs, volume and
profit.
Unclear
or complex charts should, however, be
avoided, as a chart which is
not easily understood
defeats
its own object.
Generally,
break-even charts are most
useful for the following
purposes:
·
comparing products, time periods or
actual outcomes versus planned
outcomes
·
showing the effect of
changes in circumstances or to
plans
·
giving a broad picture of
events,
195
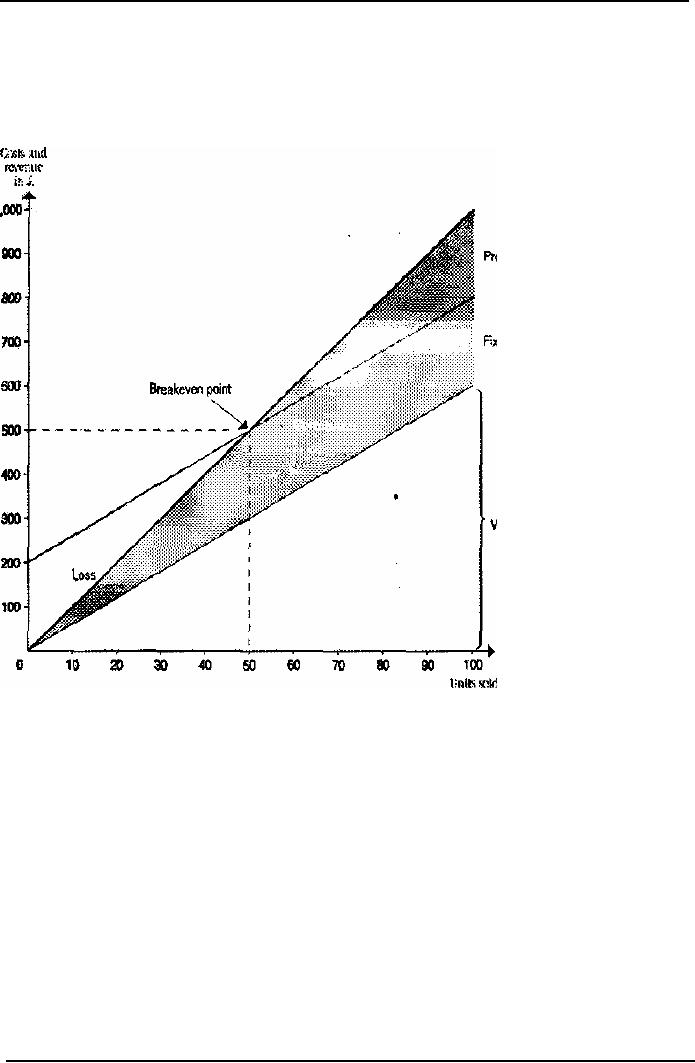
Cost
& Management Accounting
(MGT-402)
VU
Contribution
break-even charts
A
contribution break-even chart is
constructed with the
variable costs at the foot
of the diagram
and
the fixed costs shown
above the variable cost
line.
The
total cost line will be in
the same position as in the
break-even chart illustrated
above; but by
using
the revised layout it is
possible to read off the
figures of contribution at various
volume
levels,
as shown in the following
diagram.
Profit-volume
chart
A
profit-volume chart is a graph which
simply depicts the net
profit and loss at any given
level of
activity.
196
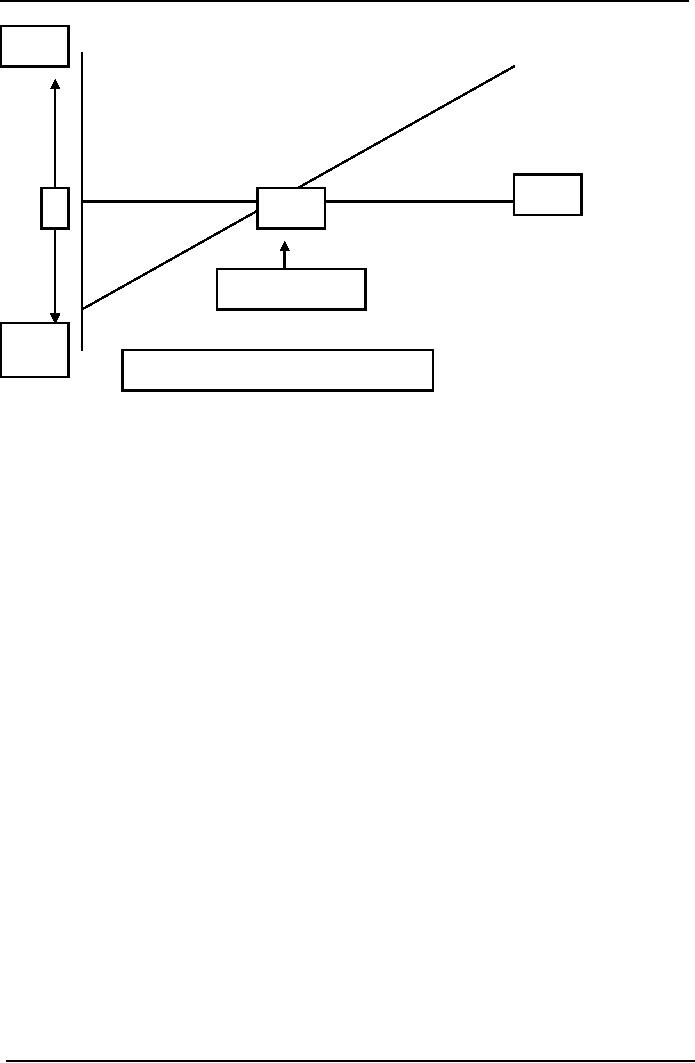
Cost
& Management Accounting
(MGT-402)
VU
Profit
Sales
0
500
Breakeven
Point
Loss
1,000
Loss
= Fixed cost at zero sales
activity
From
the above chart the
amount of net profit or loss
can be read off for any
given level of sales
activity,
unlike a break-even chart
which shows both costs
and revenues over a given
range of
activity
but does not highlight
directly the amounts of
profits or losses at the various
levels.
·
The
points to note in the
construction of a profit-volume chart
are as follows:
·
The
horizontal axis represents
sales (in units or sales
value, as appropriate). This is the same
as
for
a break-even chart.
·
The
vertical axis shows net
profit above the horizontal
sales axis and net
loss below.
·
When
sales are zero, the net
loss equals the fixed
costs and one extreme of the
'profit-volume'
line
is determined. Therefore this is
one-point on the graph or
chart.
·
If
variable cost per unit
and fixed costs in total
are both constant throughout
the relevant range
of
activity under consideration, the
profit-volume chart is,
depicted by a straight line
(as
illustrated
above). Therefore, to draw
that line it is only
necessary to know the profit
(or loss)
at
one level of sales. The
'profit-volume ' line is then
drawn between this point
and the one for
zero
sales, extended as
necessary.
·
If
there are changes in the
variable cost per unit or
total fixed costs at various activities,
it
would
be necessary to calculate the
profit (or loss) at each
point where the cost
structure
changes
and to plot these on the
chart. The 'profit-volume'
line will then be a series
of straight
lines
joining these points
together, as shown in the
simple illustration
below.
197
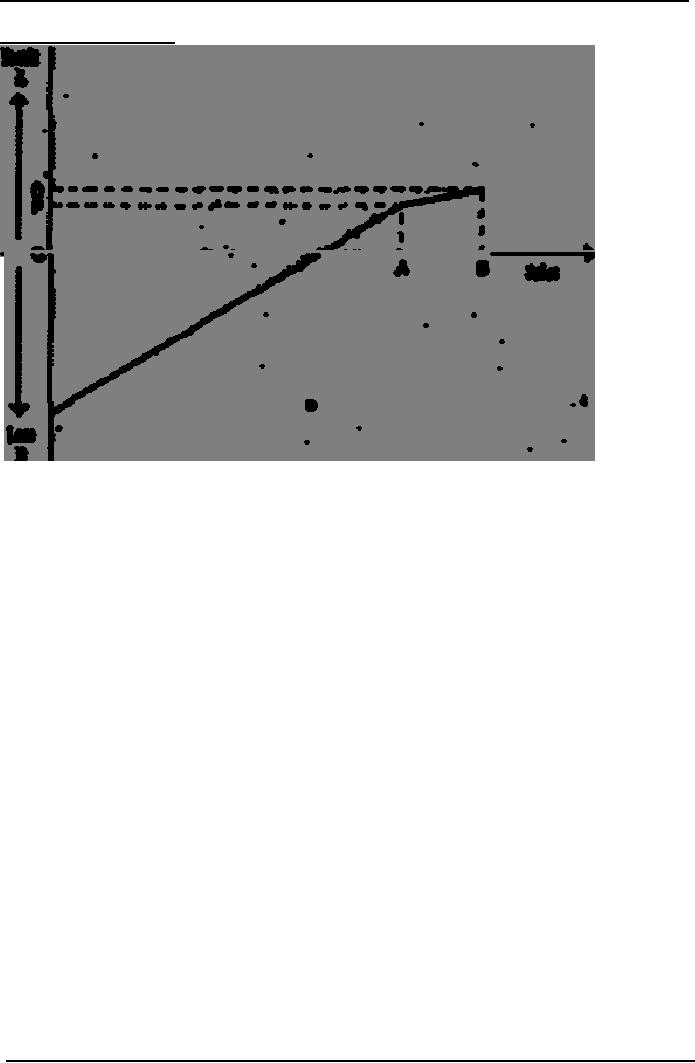
Cost
& Management Accounting
(MGT-402)
VU
Profit-volume
chart (2)
This
illustration depicts the
situation where the variable
cost per unit increases
after a certain level
of
activity (OA), e.g. because
of overtime premiums that
are incurred when production
(and sales)
exceed
a particular level.
Points
to note:
·
The
profit (OP) at sales level
OA would be determined and
plotted.
·
Similarly
the profit (OQ) at sales
level of OB would be determined and
plotted.
·
The
loss at zero sales activity
(= fixed costs) can be
plotted.
·
The
"profit-volume' line is then
drawn by joining these
points, as illustrated.
As
long as we make the
assumptions that contribution
per unit is constant, and
fixed costs do not
change,
we can draw straight-line
graphs to show profit or
costs and revenues at all
possible
activity
levels.
MULTIPLE
CHOICE QUESTIONS
1.
If
contribution margin is
positive?
(a)
Profit will occur.
(b)
Both a profit and loss
are possible.
(c)
Profit will occur if the
fixed expenses are greater
than the contribution
margin.
(d)
A loss will occur if the
contribution margin is greater
than fixed expenses.
2. At
the breakeven point:
(a)
Profit is Rs. 0.
(b)
. Fixed Cost + Variable Cost =
Safes
(c)
Fixed Cost = Contribution
Margin
(d)
All of the above
198

Cost
& Management Accounting
(MGT-402)
VU
3.
A
completed CVP graph will show
that profit or loss at any
level of sales is measured
by:
(a)
A
vertical line between the
fixed cost line and
the x axis.
(b)
A
horizontal line between the
revenue line and the y
axis.
(c)
A
vertical line between the
total revenue line and the
total expenses line.
(d)
A
horizontal line between the
total revenue line and the
total expenses line.
4.
Contribution
margin ratio is:
(a)
Total
Contribution Margin /
Sales.
(b)
Sales
/ Contribution Margin per
unit,
(c)
Fixed
cost / Contribution margin
per unit.
(d)
Sales
/ Variable costs.
5.
The
impact on net operating income of any given dollar
change in total sales can be
computed
by
applying which ratio to the
dollar change?
(a)
Profit margin.
(b)
Variable cost ratio.
(c)
Contribution Margin.
(d)
Ratio of Variable to Fixed Expenses.
6.
The
Hino Corporation has a
breakeven point when sales
are Rs. 160,000 and
variable costs at
that
level of sales are Rs.
100,000. How much would
contribution margin increase or
decrease, if
variable
expenses dropped by Rs.
20,000?
(a)
37.5%.
(b)
60%.
(c)
12.5%.
(d)
26%
7.
Which
of the following represents
the CVP equation?
(a)
Sales
= Contribution margin + Fixed expenses +
Profits
(b)
Sales
= Contribution margin ratio + Fixed
expenses + Profits
(c)
Sales
= Variable expenses + Fixed expenses +
Profits
(d)
Sales
= Variable expenses - Fixed expenses +
Profits
8.
Margin
of Safety is a term best
described as the excess
of:
(a)
Contribution
margin over fixed
expenses.
(b)
Total
expenses over the breakeven
point.
(c)
Sales
over the breakeven
point.
(d)
Sales
over total costs.
Point
out which of the following statements are
TRUE/FALSE
1.
Cost-volume-profit
(CVP) analysis summarizes the effects of
change on an organization's
volume
of activity on its costs, revenue, and
profit.
2.
The
break-even point is the
volume of activity where an organization's
revenues and expenses
are
equal,
3.
Total
contribution margin can be
calculated by subtracting total
fixed costs from
total
revenues.
4.
Contribution
margin / Sales price per
unit = Contribution margin
ratio.
5.
The
sales price of a single unit
minus the unit's variable
expenses is called the unit
contribution
margin-
199

Cost
& Management Accounting
(MGT-402)
VU
6.
The
contribution-margin ratio of a firm is
determined by dividing the per
unit contribution
margin
by the per unit sales
price.
7.
The
safety margin of an enterprise is the
difference between the budgeted
sales revenue and
the
break-even sales revenue-
8.
A company's
break-even sales revenues
are Rs, 400,000, and its
contribution margin is 40%.
If
fixed
costs increase by Rs.
24,000, breakeven sales will
increase to Rs.
440,000.
9.
If
the total contribution
margin at break-even sales is
Rs, 45,000, then the
fixed costs must
also
be Rs. 45,000,
10.
If a company
sells 50 units of A at Rs. 8
contribution margin and 200
units of B at a Rs. 6
contribution
margin, the weighted-average contribution
margin is Rs. 7.00.
200

Cost
& Management Accounting
(MGT-402)
VU
LESSON-33
WHAT
IS A BUDGET?
A
budget is a plan expressed in
quantitative, usually monetary terms,
covering a specific period of
time,
usually one year. In other
words, a budget is a systematic plan
for the utilization
of
manpower
and material resources. In a business
organization a budget represents an
estimate of
future
costs and revenues. Budgets
may be divided into two
basic classes; Capital
Budgets and
Operating
Budgets, Capital budgets are
directed towards proposed expenditures
for new projects
and
often require special financing
(this topic is discussed in
the next Unit). The
operating budgets
are
directed towards achieving short-term operational
goals of the organization,
for instance,
production
or profit goals in a business
firm. Operating budgets may
be sub-divided into various
departmental
or functional budgets. The
main characteristics of a budget
are:
It
is prepared in advance and is derived
from the long, term
strategy of the
organization.
It
relates to future period for
which objectives or goals have
already been laid
down.
It
is expressed in quantitative form,
physical or monetary units, or
both.
Different
types of budgets are
prepared for different
purposes e.g. Sales. Budget,
Production
Budget.
Administrative Expense Budget, Raw
material Budget, etc. All these
sectional budgets are
afterwards
integrated into a master budget- which
represents an overall plan of
the organization. A
budget
helps us in the following
ways:
1.
It brings about efficiency and
improvement in the working of
the organization.
2.
It is a way of communicating the plans to
various units of the organization. By
establishing
the
divisional, departmental, sectional
budgets, exact responsibilities
are assigned. It thus
minimizes
the possibilities of buck-passing if
the budget figures are not
met.
3.
It is a way or motivating managers to
achieve the goals set
for the units.
4.
It serves as a benchmark for
controlling on going. Operations.
5.
It helps in developing a team spirit
where participation in budgeting is
encouraged.
6.
It helps in reducing wastage's and
losses by revealing them in time
for corrective action.
7.
It serves as a basis for evaluating
the performance of
managers.
8.
It serves as a means of educating
the managers.
Budgetary
control
No
system .of planning can be
successful without having an
effective and efficient
system of
control.
Budgeting is closely connected with control.
The exercise of control in
the organization
with
the help of budgets is known
as budgetary control. The process of
budgetary control includes
(i)
preparation of various budgets (ii)
continuous comparison of actual
performance with budgetary
performance
and (iii) revision of
budgets in the light of
changed circumstances.
A
system of budgetary control should
not become rigid. There
should be enough scope
for
flexibility
to provide for individual
initiative and drive. Budgetary
control is an important device
for
making
the organization more
efficient on all fronts. It is an
important tool for
controlling costs
and
achieving the overall objectives.
Installing
a budgetary control system
Having
understood the meaning and
significance of budgetary control in an
organization, it will be
useful
for you to know how a
budgetary control system can be installed
in the organization.
This
requires,
first of all, finding
answers to the following
questions in the context of an
organization:
201

Cost
& Management Accounting
(MGT-402)
VU
What
is likely to happen?
What
can be made to
happen?
What
are the objectives to be
achieved?
What
are the constraints and to
what extent their effects
can be minimized?
Having
found answers to the above
questions, the following
steps may be taken for
installing an
effective
system of budgetary control in an
organization.
Organization
for budgeting
The
setting up of a definite plan of
organization is the first
step towards installing budgetary
control
system in an organization. A Budget
Manual should, be prepared
giving details of the
powers,
duties, responsibilities and
areas of operation of each executive in
the organization.
Responsibility
for budgeting
The
responsibility for preparation and
implementation of the budgets
may be fixed as
under:
Budget
controller
Although
the Chief Executive is
finally responsible for the
budget programme, it is better if a
large
part
of the supervisory responsibility is
delegated to an official designated as
Budget Controller or
Budget
Director. Such a person should
have knowledge of the technical details
of the business and
should
report directly to the
President or the Chief
Executive of the
organization.
Budget
committee
The
Budget Controller is assisted 'in his
work by the Budget Committee. The
Committee may
consist
of Heads of various departments, viz.,
Production, Sales. Finance Personnel,
Purchase, etc.
with
the Budget Controller as its Chairman. It is generally
the responsibility of the.
Budget
Committee
to submit discusses and
finally approves the budget figures. Each
head of the
department
should have his own Sub-committee
with executives working
under him as its
members.
Fixation
of the Budget Period
Budget
period' means the period for
which a budget is prepared and employed.
The budget period
depends
upon the nature of the
business and the control
techniques. For example, a
seasonal
industry
will budget for each season,
while an industry requiring
long periods to complete
work
will
budget for four, five or
even larger number, of
years. However, it is necessary
for control
purposes
to prepare budgets both for
long as well as short
periods.
Budget
procedures
Having
established the budget organization
and fixed the budget period,
the actual work or
budgetary
control can be taken upon
the following
pattern:
Key
factor
It
is also termed as limiting factor.
The extent of influence of
this factor must first be
assessed in
order
to ensure that the budget
targets are met It would be
desirable to prepare first
the budget
relating
to this particular factor,
and then prepare the
other budgets. We are giving
below an
illustrative
list of key factors in certain
industries.
202

Cost
& Management Accounting
(MGT-402)
VU
Industry
Key
factor
Motor
Car
Sales
demand
Aluminum
Power
Petroleum
Refinery
Supply
of crude oil
Electro-optics
Skilled
technicians
Hydral
Power generation
Monsoon
The
key factors should be
correctly identified and
examined. The key factors
need not be a
permanent
nature. In the long run,
the management may overcome
the key factors by
introducing
new
products, by changing material mix or by
working overtime or extra shifts
etc.
Making
a Forecast
A
forecast is an estimate of the
future financial conditions or operating
results. Any estimation is
based
on consideration of probabilities. An estimate differs
from a budget in that the
latter
embodies
an operating plan or an organization. A budget
envisages a commitment to certain
objectives
or targets, which the
management seeks to attain on the
basis of the forecasts
prepared.
A
forecast on the other hand
is an estimate based on probabilities of an
event. A forecast may
be
prepared
in financial or physical terms for sales,
production cost, or other
resources required for
business.
Instead of just one forecast a
number of alternative forecasts may be
considered with a
view
to obtaining the most
realistic overall
plan.
Preparing
budgets
After
the forecasts have been
finalized the preparation of budgets
follows. The budget
activity
starts
with the preparation of the
said budget. Then, production budget is
prepared on the basis
of
sales
budget and the production
capacity available. Financial budget
(i.e. cash or working
capital
budget)
will be prepared on the
basis of sale forecast and
production budget. All these
budgets are
combined
and coordinated into -a master budget-
The budgets may be revised
in the course of the
financial
period if it becomes necessary to do so in
view of the unexpected developments,
which
have
already taken place or are
likely to take place.
Choice
between Fixed and Flexible
Budgets
A
budget may be fixed or flexible. A
fixed budget is based on a fixed
volume of activity, 11
may
lose
its effectiveness in planning and
controlling if the actual
capacity utilization is different
from
what
was planned for any particular
unit of time e.g. a month or
a quarter. The flexible budget
is
more
useful for changing levels of
activity, as it considers fixed
and variable costs
separately. Fixed
costs,
as you are aware, remain unchanged
over a certain range of output such
costs change when
there
is a change in capacity level.
The variable costs change in
direct proportion to output if
flexible
budgeting approach is adopted, the budget
controller can analyze the
variance between
actual
costs and budgeted costs
depending upon the actual
level of activity attained
during a period
of
time.
203
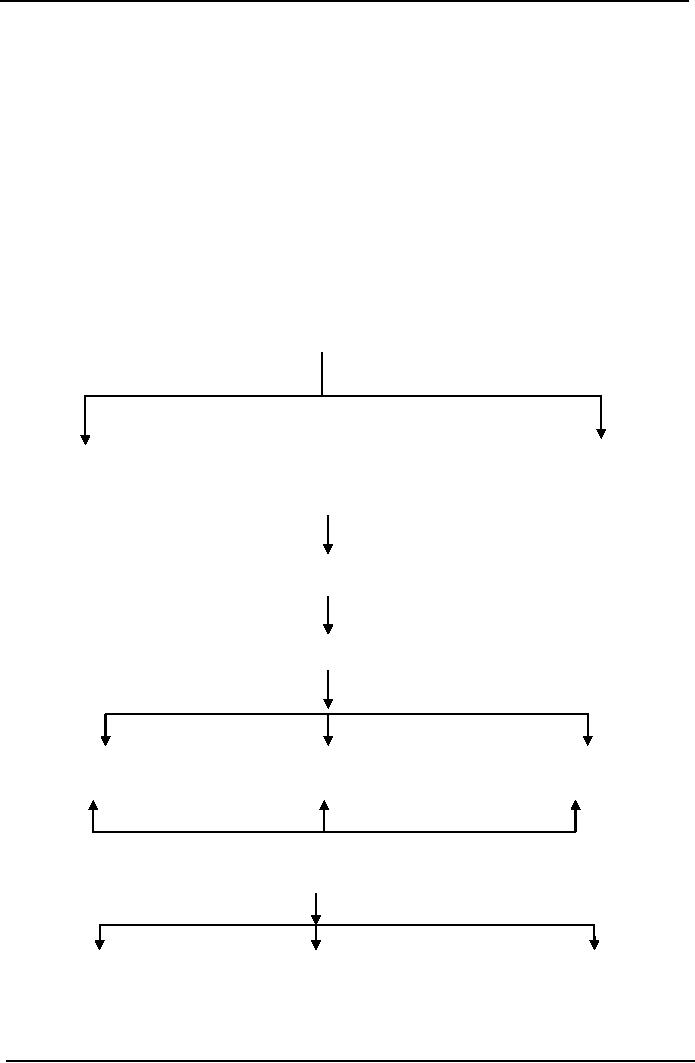
Cost
& Management Accounting
(MGT-402)
VU
Objective
of Budget
Profit
maximization.
Maximization
of sales.
Volume
growth.
To
compete with the
competitors.
Development
of new areas of operation.
Quality
of service.
Work-force
efficiency.
Divisions
of Budget
Division
of Budgets
Functional
Budget
Master
Budget
Functional
Budget
Sales
Budget
Production
Budget
Raw
material
Labor
Factory
overhead
Cost
of goods
sold
Selling
&
General
&
Financial
distribution
Administrative
charges
expenses
expenses
budget
budget
budget
204

Cost
& Management Accounting
(MGT-402)
VU
LESSON#
34 & 35
Production
& Sales Budget
Budgets
can be classified into
different categories on the
basis of Time, Function, or
Flexibility.
The
different budgets covered
under each category are
shown in the following
chart:
Chart:
clarification of Budgets
Time
Function
Flexibility
·
Long
term
Sales
Fixed
·
Short
term
Production
Flexible
·
Current
Cost
of Production
·
Rolling
Purchase
Personnel
Research
Capital
Expenditure
Cash
Master
Let
us discuss some of the
budgets covered in the above
classification.
Rolling
budget
Some
organizations follow the practice of
preparing a willing or progressive budget in
such
organizations;
budget for a year in advance
will always be there. Immediately
after a month, or a
quarter,
passes, as-the case may
be, a new budget is prepared
for a twelve months. The
figures for
the
month/quarter, which has
rolled down, are dropped and
the figures for the next
month /
quarter
are added. For example, if a
budget has been prepared for
the year 19X7, after the
expiry
of
the first quarter ending
31st March 19X7, a new budget
forth full year ending 31ft
March, 19X8
will
be prepared by dropping the figures
for the quarter which
has past (i.e. quarter
ending 31st
March
19X7) and adding-the figures for the
new quarter-ending 31st
March 19X8. The figures
for
the
remaining three quarters ending 31st
December 19X7 may also be
revised, if necessary.
This
process
will continue whenever a
quarter ends and a new
quarter begins.
Sales
budget
Sales
Budget generally forms the fundamental
basis on which all other
budgets are built the
budget
is
based on projected sales to be achieved
in a budget period. The Sales Manager is
directly
responsible
for the preparation and
execution of this budget. Be usually
taking into consideration
the
following organizational and
environmental factors while preparing
the tales budget:
Availability
of material or supplies
Internal
External
Past
sales figures and
trends
General
trade prospects
Salesmen's
estimates
Seasonal
fluctuation
Plant
capacity
Potential
market
Orders
on hand
Government
controls, rule
and
regulator
relating to the industry
Availability
of material or supplies
Political
situation and its impact on
Market
Cost
of distribution of goods
Financial
aspect
205

Cost
& Management Accounting
(MGT-402)
VU
It
is desirable to break up the
entire sales budget on the
basis of different products,
time periods
and
sales areas or
territories.
Illustration
1
Shad
on Ltd. has three sales
divisions at A town, B town and C
town. It sells two products
X and
Y.
The budgeted sales for
the month Jan at each
place are given
blow:-
A
Product
X
[50,000
units @ Rs. 16 each
Product
Y
[35,000
units @ Rs. 10 each
B
Product
Y
[55,000
units @ Rs. 10 each
C
Product
X
[75,000
units @ Rs. 16 each
The
Budge sales during the
Feb were:
Madras
A
Product
X
62,500
units @ Rs. 16 each
Product
Y
37,500
units @ Rs. 10 each
Bangalore
B
Product
Y
62,500
units @ Rs. 10 each
Hyderabad
C Product X
77,500
units @ Rs. 16 each
From
the reports of the sales
department it was estimated
that the sales budget for
the year ending.
31st
March than 19x6 budget in
the following
respects:
Madras
A
Product
X
4,000
units
Product
Y
2,500
units
Bangalore
B
Product
Y
6,500
units
Hyderabad
C Product X
5,000
units
Intensive
safes campaign in Bangalore
and Hyderabad is likely to result in
additional sales of
12,500
units of product I in Bangalore
and 9,000 units of Product
II in Hyderabad, Let us prepare
a
sales budget for the period ending
31st December, 19X7.
206
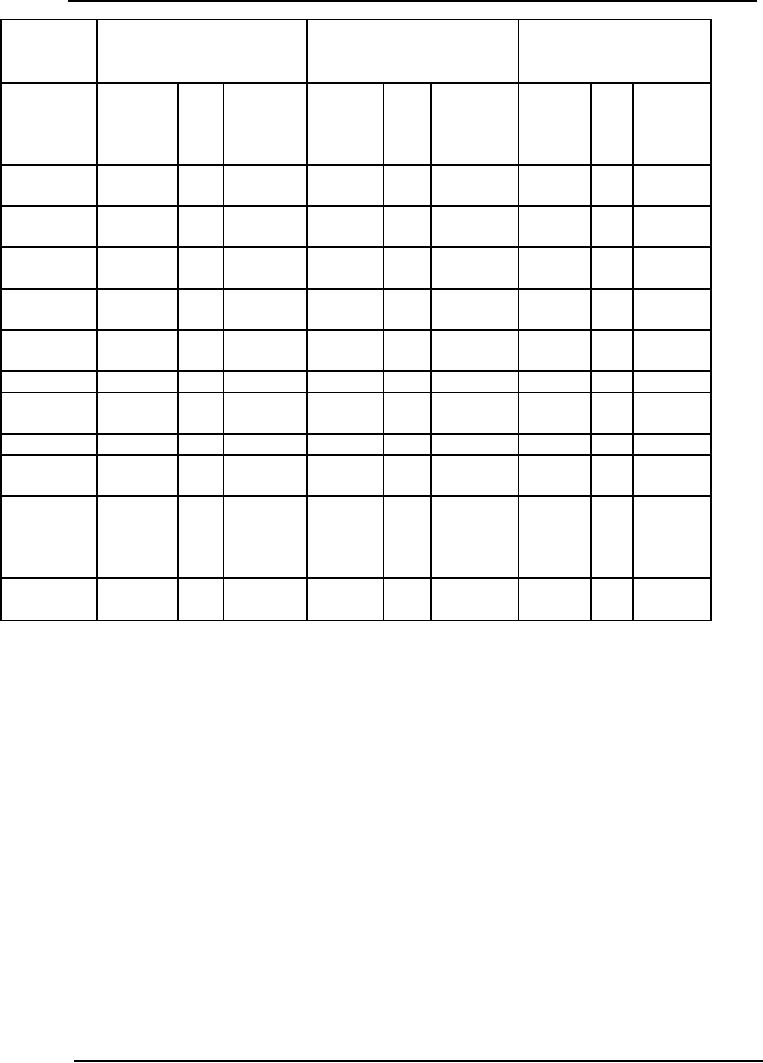
Cost
& Management Accounting
(MGT-402)
VU
Division
Mar
Jan
Feb
Product
Qty.
Price
Value
Qty.
Pr
Value
Qty.
Pric
Value
(Units)
(Rs.
(Rs.)
(Units)
ice
(Rs.)
(Units)
e
(Rs.)
)
(Rs.)
(Rs.
)
Town
A
54,000
16
8,64,000
50,000
16
8,00,000
62,500
16
10,00,00
X
0
37,500
16
3,75,000
35,000
10
3,50,000
37,500
10
3,75,000
Y
Total
91,500
----
12,2,9000
85,000
----
11,50,000
----
13,75,00
0
Banglore
12,500
10
2,00,000
----
-----
16
X
Town B
61,500
10
6,15,000
55,000
10
5,50,000
62,500
10
6,25,000
Y
Total
74,500
---
8,15,000
55,000
5,50,000
62,500
----
6,25,000
Hyderabad
80,000
16
12,80,000
75,000
16
12,00,000
77,500
16
12,40,00
IX
0
II
Y
9,000
10
90,000
----
----
10
Total
89,000
----
13,80,000
75,000
12,00,000
----
12,40,00
0
Product
1,46,500
16
23,44,000
1,25,000
16
20,00,000
1,40,00
16
22,40,00
X
1,08,500
10
10,80,000
90,000
10
9,00,000
0
10
0
Product
II
1,00,00
10,00,00
Y
0
0
Total
2,54,500
----
34,24,000
2,15,000
29,00,000
2,40,00
----
32,40,00
0
0
Production
budget
This
budget provides an estimate of the total
volume of production distributed
product-wise with
the
scheduling of operations by days, weeks
and months and a forecast of
the inventory of
finished
products.
Generally, the production budget is
based on the sales -budget.
The responsibility for
the
overall
production budget lies with
Works Manager and that of
departmental production budgets
with
departmental works management Production
budget may be expressed in physical or
financial
terms
or both in relation to production.
The production budgets
attempt to answer questions
like:
(i)
What
is to be produced?
(ii)
When
it is to be produced?
(iii)
How
it is to be produced?
(iv)
Where
it is to be produced?
The
production budget envisages the
production program for achieving the
sales target it serves
as
a
basis Job preparation of related cost-
budgets, e.g., materials
cost budget, labor cost budget,
etc.
It
easily facilities the preparation of a
cash budget. The production budget is
prepared after taking
into
consideration several factors like:
(i)
Inventory
policies. (II)
Sales
requirements, (iii)
Production
stability, (iv)
Plant
capacity, (v)
Availability
of materials and labor,
(vi)
Time
taken in
production
process, etc.
207

Cost
& Management Accounting
(MGT-402)
VU
Activity
2
From
the following details of
Mysore Cement Works Limited, complete
the production budget
for
the
three-month period ending March 31,
19x6 (Production budget for
product P has already
been
worked
out.
Estimated
stock
Estimated
sale during
Desired
closing stock
Type
of product
on
Jan 1, 19x6
Jan-March
1986
on
March 31, 19x6
(Units)
(Units)
(Units)
1,000
5,000
1,500
P
Q
1,500
7,500
2,500
R
2,000
6,500
1,500
S
1,500
6,000
1,000
208

Cost
& Management Accounting
(MGT-402)
VU
LESSON
36 & 37
FLEXIBLE
BUDGET
When
a company's activities can be estimated
within close limits, the
fixed budget is satisfactory.
However,
completely predictable situations exist in
only a few cases. If
business conditions
change
radically,
causing actual operations to differ
widely from fixed budget
plans, this management
tool
is
not reliable or effective.
The fact that costs
and expenses are affected by
fluctuations in volume
limits
the use of the fixed budget
and leads to the use of
the flexible budget. To illustrate,
the cost
of
operating an automobile per mile
depends on the number of
miles driven. The more a
car is
used
per year, the more it
costs to operate it but the
less it costs per mile. If
the owner prepares an
estimate
of the total cost and
compares actual expenses
with the budget at year-end,
success in
keeping
expenses within the allowed
limits cannot be determined without
accounting for the
mileage
factor. The reason for
this lies in the nature of
the expenses, some of which
arc fixed while
others
are variable or semi
variable. Insurance, taxes, registration,
and garaging are fixed
costs,
which
remain the same whether the
car is operated 1,000 or
20.000 miles. The costs of
tires, gas,
and
repairs are variable costs,
which depend largely upon
the miles driven.
Obsolescence and
depreciation
result in a semi-variable cost.
Which fluctuates to some
degree but does not
vary
directly
with the usage of the
car?
The
underlying principle of a flexible budget
is the need for some
norm of expenditures for any
given
volume of business. This
norm should be known beforehand in
order to provide a guide
to
actual
expenditures. To recognize this principle
is to accept the fact that
every business is dynamic,
ever
changing, and never static. It is
erroneous, if not futile, to expect a
business lo conform to a
fixed,
preconceived pattern.
The
preparation of a flexible budget results from
the development of formulas
for each department
and
for each account within a
department or cost center.
The formula for each
account indicates
the
fixed amount and/or a
variable rate. The fixed
amount and variable rate
remain constant within
prescribed
ranges of activity. The
variable portion of the
formula is a rate expressed in
relation to a
base
such as direct labor hours, direct labor
cost or machine hours.
The
application of the formulas to the
level of activity actually
experienced produces the
allowable
expenditures
for the volume of activity
attained. These budget figures are
compared with actual
costs
in order to measure the performance of
each department. This ready-made
comparison
makes
the flexible budget a valuable instrument
for cost control, because it
assists in evaluating the
effects
of varying volumes of activity on
profits and on the cash
position,
Originally,
the flexible budget idea was
applied principally 10 the
control of departmental factory
overhead.
Now however, the idea is
applied lo the entire budget. So
that production as well
as
marketing
and administrative bud-gels is prepared
on a flexible budget basis.
Capacity
and volume
The
discussion of the actual preparation of a
flexible budget must be preceded by a
basic
understanding
of the term "capacity." The
terms "capacity" and "volume" (or
activity) are used in
connection
with the construction and
use of both fixed and
flexible budgets. Capacity is
that fixed
amount
of '
"plant
and machinery and number of
personnel for which management
has
committed
itself and with which it
expects to conduct the
business. Volume is the
variable factor
in
business. It is related to capacity by
the fact that volume
(activity) attempts to make the
best use
of
existing capacity.
209

Cost
& Management Accounting
(MGT-402)
VU
Any
budget is a forecast of sales, costs,
and expenses. Material, labor,
factory overhead, marketing
expenses,
and administrative expenses must be
brought into harmony with
the sales volume.
Sales
volume
is measured not only by
sales the market could
absorb, but also by plant
capacity and
machinery
available to produce the goods. A
plant or a department may produce
the goods. A
plant
or department may produce 1,000
units or work 10.000 hours,
but this volume (or
activity)
may
not be ' compatible with the
capacity of the plant or
department. The production
of
1.000'units
or the working of 10.000
hours may be greater or smaller
than the amount of sales
the
company
can safely expect to achieve
in a given market during a given period.
The
following terms are used in
referring to capacity levels' theoretical practical,
expected actual,
and
normal. Current Internal
Revenue Service regulations permit
the use of practical,
expected
actual
or normal capacity in assigning
factory overhead costs to
inventories.
Theoretical
Capacity. The
theoretical capacity of a department is its
capacity to produce at full
speed
without interruptions. It is achieved if
the plant-or department
produces at 100 percent of its
rated
capacity,
Practical
Capacity. It is
highly improbable that any company
can operate at theoretical
capacity.
Allowances
must be made for unavoidable
interruptions, such as time lost
for repairs,
inefficiencies,
breakdowns, setups. failures, unsatisfactory
materials, delays in delivery of
materials
or
supplies, labor shortages
and absences, Sundays, holidays,
vacations, inventory taking, and
pat-
tern
and model changes. The
number of work shifts must
also be considered. These
allowances
reduce
theoretical capacity to the practical
capacity level. This
reduction is caused by
internal
influences
and does not consider
the chief external cause,
lack of customers' orders.
Reduction
from
theoretical to practical capacity typically
ranges from 15 percent to 25 percent,
which results
in
a practical capacity level or 75 percent lo 85 percent
of theoretical capacity.
Expected
Actual Capacity. Expected
actual capacity is based on a short-range
outlook. The use
of
expected actual capacity is
feasible with firms whose
products are of a seasonal
natureČ and
market
and style changes allow
price adjustments according to
competitive conditions
and
customer
demands.
Normal
Capacity. Firms
may modify the above
capacity levels by considering the
Utilization of
the
plant or various departments in the light
of meeting average sales demands
over a period long
enough
to level out the peaks
and valleys which come with
seasonal and cyclical variations.
Finding
a
satisfactory and logical balance between
plant capacity and sales
volume is one of the
important
problems
of business management.
Once
the normal (or average)
capacity level has been
established, overhead costs
can be estimated
and
factory overhead rates
computed. The use of these
rates will cause all
overhead of the period
to
be absorbed, provided normal
capacity and normal expenses
prevail during the
period.
Purposes
of Establishing Normal Capacity. Although
there may be some differences
between a
normal
long-run volume and the
sales volume expected in the
next period, normal capacity
is
useful
in establishing sales prices
and controlling costs. It is
the basis for the
entire budget system,
and
it can be used for the
following purposes and
aims:
1.
Preparation of departmental flexible budgets
and computation of predetermined
factory
overhead
rates,
2.
Compilation of the standard
cost of each product.
3.
Scheduling production.
210

Cost
& Management Accounting
(MGT-402)
VU
4.
Assigning cost to
inventories.
5.
Measurement of the effects of changing volumes of
production.
6.
Determination of the break-even
point.
Although
other capacity assumptions
are sometimes used due to
existing circumstances, normal
capacity
fulfills both long- and
short-term purposes. The
long-term utilization of the
normal
capacity
level relates the marketing
phase and therewith the
pricing policy of the
business 10 the
production
phase over a long period of
time, leveling out
fluctuations that are of
short duration
and
of comparatively minor significance.
The short-term utilization
relates to management's
analysis
of changes or fluctuations that
occur during an operating year.
This short-term
utilization
measures
temporary idleness and aids
in an analysis of its causes.
Factors
Involved in Determining Normal
Capacity. In determining the
normal capacity of a
plant,
both
its physical capacity and average
sales expectancy must be
considered; neither plant
capacity
nor
sales potential alone is
sufficient. As previously mentioned,
sales expectancy should
be
determined
for a period long enough to
level out cyclical variations rather
than on the sales
expectancy
for a short period of time. It
should also be noted that
outmoded machinery
and
machinery
bought for future use
must be excluded from the
considerations which lead to
the
determination
of the normal capacity
level-Calculation of the normal
capacity of a plant
requires
many
different judgment factors. Normal
capacity should be determined first
for the business as a
whole
and then broken down by
plants and departments. Determination of
a departmental
capacity
figure might indicate that
for a certain department the planned
program is an overload
while
in another ii will result in
excess capacity. The
capacities of several departments will
seldom
be
in such perfect balance as to produce an unhampered
flow of production. For the
department
with
the overload, often termed the
"bottleneck" department, actions such as
the following might
have
to be taken;
1.
Working
overtime.
2.
Introducing
an additional shift.
3.
Temporarily
transferring operations to another
department where spare capacity is
available.
4.
Subcontracting
the excess load.
5.
Purchasing
additional equipment.
On
the other hand, the
excess facilities of other departments
might have to be reduced. Or
the
safes
department might be asked lo
search for additional orders to
utilize the spare capacity
in
these
departments.
The
effect of the various capacity
levels on predetermined factory overhead
rates is illustrated
below.
If the 75 percent capacity level is
considered to be the normal operating
level, the
overhead
rate is $2.40 per direct
labor hour.
211
Cost
& Management Accounting
(MGT-402)
VU
EFFECT
OF VARIOUS CAPACITY LEVELS ON
PREDETERMINED
FACTORY
OVERHEAD RATES
ITEM
NORMAL
PRACTICAL
THEORETICAL
CAPACITY
CAPACITY
CAPACITY
Percentage
of
75%
85%
100%
production
capacity
Direct
labor hours
7,500
hrs.
8,500
hrs.
10,000
hrs.
Budgeted
factory
overhead
Fixed
Rs.
12,000
Rs.
12,000
Rs.
12,000
Variable
6,000
6,800
8,000
Total
Rs.
18,000
Rs.
18,800
Rs.
20,000
Fixed
factory overhead
Rs.
1.60
Rs.
1.41
Rs.
1.20
rate
per direct labor
hours
Variable
factory
.80
.80
.80
overhead
rate per direct
labor
hour
Total
factory overhead
Rs.
2.40
Rs.
2.21
Rs.
2.00
rate
per direct labor hour
At
higher capacity levels [he
rate is lower, because the
fixed overhead is
spread
A
distinction must be made
between idle and excess
capacity. Idle capacity results
from the
temporary
idleness of production or distribution
facilities due to a lack of orders.
Idle facilities are
restored
to full use as soon as the
need arises. Their cost is
usually part of the expense
total used in
selling
up the overhead rate and is
at all limes a part of the
product cost. However, as
explained in
the
factory overhead and
standard cost chapters, the
cost of idle capacity can be
isolated both for
control
purposes and for the
guidance of management-
Excess
Capacity. Conversely, results
either from greater productive
capacity than the
company
could
ever hope to use. or from an
imbalance in equipment or machinery.
This imbalance
involves
the excess capacity of one
machine in contrast with the
output of other machines
with
which
it must be synchronized. Any expense
arising from excess capacity
should be excluded
from
the factory overhead rate and
from the product cost.
The expense should be treated as
a
deduction
in the income statement. In
many instances. It may be wise to
dispose of excess
plant
and
equipment.
ANALYSIS
OF COST BEHAVIOR
The
success of a flexible budget depends
upon careful study and
analysis of the relationship
of
expenses
to volume of activity or production
and results in classifying expenses as
fixed, variable,
and
semi variable,
Fixed
Expenses
A
fixed expense remains the
same in total as activity
increases or decreases. Fixed factory
overhead
includes
conventional items such as straight-line
depreciation, property insurance,
and real estate
taxes-
Other expenses not
inherently fixed acquire the
fixed characteristic through
the dictates of
management
policy.
212

Cost
& Management Accounting
(MGT-402)
VU
The
classification of an expense as fixed is
valid only on the assumption
that the underlying
conditions
remain unchanged. Thus, there is really
nothing irrevocably fixed
with respect to any
expense
classified as fixed. In the
long run all expenses
are variably. In the short
run, some fixed
expenses,
some times called programmed
fixed expenses, will change
because of changes in
the
volume
of activity or for such reasons as
changes in the umber and
salaries of the
management
groups.
Other fixed expenses (e.g.,
depreciation or a long-term lease
agreement) may commit
management
for a much longer period
time; therefore, they have
been labeled committed
fixed
expenses.
Variable
Expenses
A
variable expense is expected to
increase proportionately with an
increase in activity and
decrease
proportionately
with a decrease in activity. Variable
expenses include the cost of
supplies, indirect
factory
labor, receiving, storing, rework,
perishable tools, and
maintenance of machinery and
tools.
A
measure of activity such as direct
labor hour or dollars.
213

Cost
& Management Accounting
(MGT-402)
VU
LESSON#
38
TYPES
OF BUDGET
Cash
Budget
The
cash budget the management
in:
Determining
the future is a summary of
the firm's expected cash
inflows and outflows over
a
particular
period of time. In other words,
cash budget involves a projection of
future cash
receipts
and cash disbursements over
various time intervals.
·
A
cash budget helps cash needs
of the firm
·
Planning
for financing of those
needs
·
Exercising
control over cash and
liquidity of the
firm.
The
overall objective of a cash budget is to
enable the firm to meet
all its commitments in
time
and
at the same time prevent
accumulation at any lime of unnecessary
large cash balances
with
it-
Format
of Cash Budget
XYZ
Ltd
Cash
Budget
For
the month of Jan-March
Jan
Feb
March
Opening
balance
Add
Receipts
(Anticipated cash
Receipt
from all sources)
Less
Payments
(Anticipated utilization of
cash)
Excess
/ Deficit
Bank
barrowing / Overdraft
Closing
balance
Activity
D.A
Corporation has following
information relating to the month of
January:
Opening
cash balance Rs. 20,000.
Cash receipts are: Credit
sales Rs. 1, 40,000, Cash
sales Rs.
80,000,
Loan Rs. 2,00,000, Disposal
of machine Rs. 60,000, further
capital Rs. 1,20,000.
Cash
payments are: Payment to creditor Rs.
60,000, Cash purchase Rs.
60,000, machine
purchase
Rs. 3,50,000, Administrative
expenses Rs. 40,000, Selling
expenses Rs. 75,000
and
Interest
on loan Rs. 5,000
214

Cost
& Management Accounting
(MGT-402)
VU
Solution
Jan
Opening
balance
20,000
Add
Receipts
Receipt
from sales:
Credit
sales
1,
40,000
Cash
sales
80,000
Loan
2,00,000
Further
capital
1,20,000
Disposal
of machine
60,000
6,00,000
6,
20,000
Less
Payments
Purchases:
Payment
to creditor
60,000
Cash
purchase
60,000
Machine
purchase
3,50,000
Administrative
expenses
40,000
Selling
expenses
75,000
Interest
on loan
5,000
5,90,000
Closing
balance
30,000
215
Table of Contents:
- COST CLASSIFICATION AND COST BEHAVIOR INTRODUCTION:COST CLASSIFICATION,
- IMPORTANT TERMINOLOGIES:Cost Center, Profit Centre, Differential Cost or Incremental cost
- FINANCIAL STATEMENTS:Inventory, Direct Material Consumed, Total Factory Cost
- FINANCIAL STATEMENTS:Adjustment in the Entire Production, Adjustment in the Income Statement
- PROBLEMS IN PREPARATION OF FINANCIAL STATEMENTS:Gross Profit Margin Rate, Net Profit Ratio
- MORE ABOUT PREPARATION OF FINANCIAL STATEMENTS:Conversion Cost
- MATERIAL:Inventory, Perpetual Inventory System, Weighted Average Method (W.Avg)
- CONTROL OVER MATERIAL:Order Level, Maximum Stock Level, Danger Level
- ECONOMIC ORDERING QUANTITY:EOQ Graph, PROBLEMS
- ACCOUNTING FOR LOSSES:Spoiled output, Accounting treatment, Inventory Turnover Ratio
- LABOR:Direct Labor Cost, Mechanical Methods, MAKING PAYMENTS TO EMPLOYEES
- PAYROLL AND INCENTIVES:Systems of Wages, Premium Plans
- PIECE RATE BASE PREMIUM PLANS:Suitability of Piece Rate System, GROUP BONUS SYSTEMS
- LABOR TURNOVER AND LABOR EFFICIENCY RATIOS & FACTORY OVERHEAD COST
- ALLOCATION AND APPORTIONMENT OF FOH COST
- FACTORY OVERHEAD COST:Marketing, Research and development
- FACTORY OVERHEAD COST:Spending Variance, Capacity/Volume Variance
- JOB ORDER COSTING SYSTEM:Direct Materials, Direct Labor, Factory Overhead
- PROCESS COSTING SYSTEM:Data Collection, Cost of Completed Output
- PROCESS COSTING SYSTEM:Cost of Production Report, Quantity Schedule
- PROCESS COSTING SYSTEM:Normal Loss at the End of Process
- PROCESS COSTING SYSTEM:PRACTICE QUESTION
- PROCESS COSTING SYSTEM:Partially-processed units, Equivalent units
- PROCESS COSTING SYSTEM:Weighted average method, Cost of Production Report
- COSTING/VALUATION OF JOINT AND BY PRODUCTS:Accounting for joint products
- COSTING/VALUATION OF JOINT AND BY PRODUCTS:Problems of common costs
- MARGINAL AND ABSORPTION COSTING:Contribution Margin, Marginal cost per unit
- MARGINAL AND ABSORPTION COSTING:Contribution and profit
- COST VOLUME PROFIT ANALYSIS:Contribution Margin Approach & CVP Analysis
- COST VOLUME PROFIT ANALYSIS:Target Contribution Margin
- BREAK EVEN ANALYSIS MARGIN OF SAFETY:Margin of Safety (MOS), Using Budget profit
- BREAKEVEN ANALYSIS CHARTS AND GRAPHS:Usefulness of charts
- WHAT IS A BUDGET?:Budgetary control, Making a Forecast, Preparing budgets
- Production & Sales Budget:Rolling budget, Sales budget
- Production & Sales Budget:Illustration 1, Production budget
- FLEXIBLE BUDGET:Capacity and volume, Theoretical Capacity
- FLEXIBLE BUDGET:ANALYSIS OF COST BEHAVIOR, Fixed Expenses
- TYPES OF BUDGET:Format of Cash Budget,
- Complex Cash Budget & Flexible Budget:Comparing actual with original budget
- FLEXIBLE & ZERO BASE BUDGETING:Efficiency Ratio, Performance budgeting
- DECISION MAKING IN MANAGEMENT ACCOUNTING:Spare capacity costs, Sunk cost
- DECISION MAKING:Size of fund, Income statement
- DECISION MAKING:Avoidable Costs, Non-Relevant Variable Costs, Absorbed Overhead
- DECISION MAKING CHOICE OF PRODUCT (PRODUCT MIX) DECISIONS
- DECISION MAKING CHOICE OF PRODUCT (PRODUCT MIX) DECISIONS:MAKE OR BUY DECISIONS