 |
Scheduling Tools: GANTT CHARTS, PERT, CPM |
| << Schedule: Scheduling Fundamentals |
| Risk and Change Management: Risk Management Concepts >> |

Software
Project Management
(CS615)
LECTURE
# 38
8.
Scheduling
8.3
Scheduling
Tools
i.
GANTT
CHARTS
There
are various tools that
help you create a schedule.
One of the simplest
project
management tools used to represent the
timeline of activities is the
Gantt
chart.
Long
before the advent of
computers, Henry L. Gantt
lent his name to a
simple
and very
useful graphical representation of a
project development
schedule.
The
Gantt chart shows almost
all of the information
contained in the
schedule
activity
list, but in a much more
digestible way. The schedule
information is more
easily
grasped and understood, and the
activities can be easily compared.
The
Gantt
chart enables us to see at
any given time, which
activities should be
occurring
in the project.
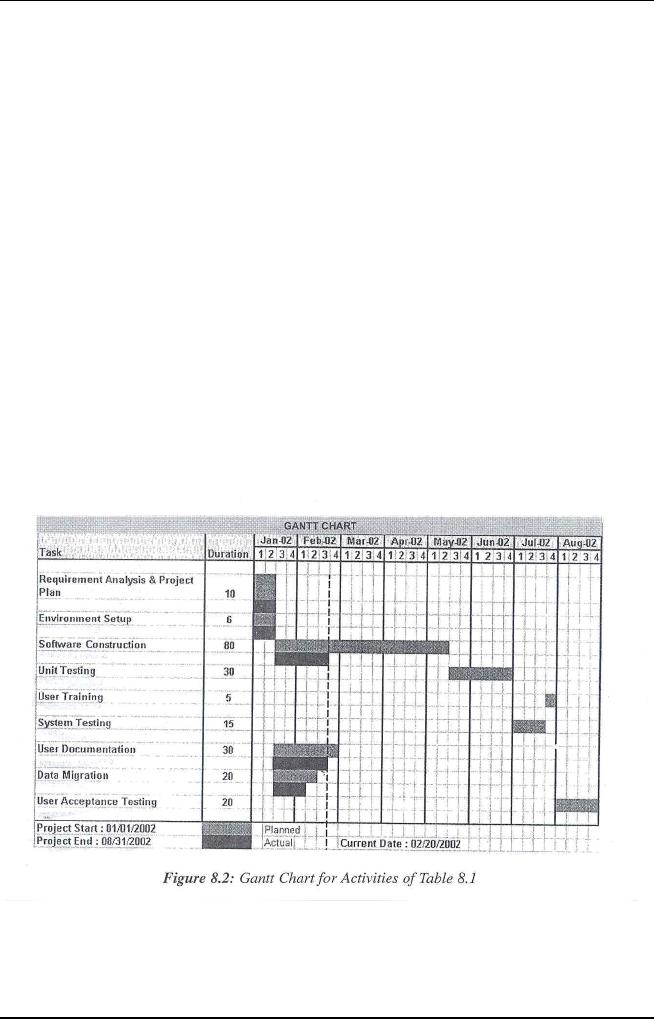
A Gantt
chart has horizontal bars
plotted on a chart to represent a
schedule. In a
Gantt
chart, you plot time on
the horizontal axis and
activities on the vertical
axis.
You represent an
activity by a horizontal bar on the
Gantt chart. The position of
a
horizontal
bar shows the start and end
time of an activity and the
length of the bar
show
its duration. You can have one
look at the Gantt chart and
make out the
progress
of the project. Figure 1
displays a sample Gantt
chart.
290
Software
Project Management
(CS615)
D
C
B
A
Activities
10
20
30
40
50
60
PLANNED
Time
(Person days)
ACTUAL
Figure
1:
Example Gantt Chart
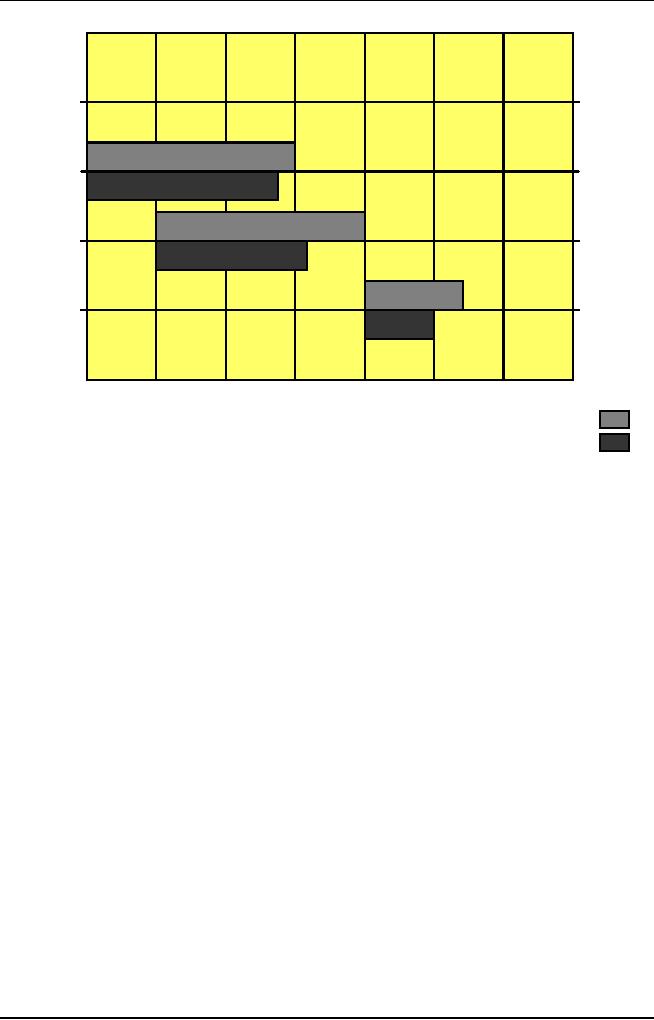
In Figure
1, activity D starts on day 1 of the
project. The planned
duration of this
activity
is 20 days. The planned
duration is shown in a lighter
shade on the Gantt
chart.
This is done to differentiate planned
duration from the current
status of the
activity.
In the case of activity D,
the current duration of the
activity is 19 days.
Therefore,
activity D is still one day
short of completion. This can be
discerned
from
the length of the gray and
black bars. Activity C,
planned for completion
on
day
40, is much behind schedule.
This can be observed from the
smaller length of
the
black bar in the Gantt
chart.
To
understand how you can use a
Gantt chart to schedule a
project, consider an
example.
Table 1 display a set of
activities in a software project and
the start and
end time
for each activity.
291
Software
Project Management
(CS615)
Table
1: Project
Activities and Time Allocation
Details
292

Software
Project Management
(CS615)
line
indicates the status of the
project on a specific day.
The left side of the
line
indicates
the tasks that are
completed. On-going activities
run across the line.
The
future
activities lie completely to
the right of the line.
After drawing the
Gantt
chart
you can extend the bars
every week to a length
proportional to the
work
completed
during the week. Therefore,
the bars describe the status
of the-project
at any
point of time.
This
process of creating a Gantt
chart as discussed above is manual.
Nowadays,
automated
tools are available for
creating Gantt charts. For
example, you can use
Microsoft® ProjectTM 2000
developed by Microsoft to create a
project schedule
automatically.
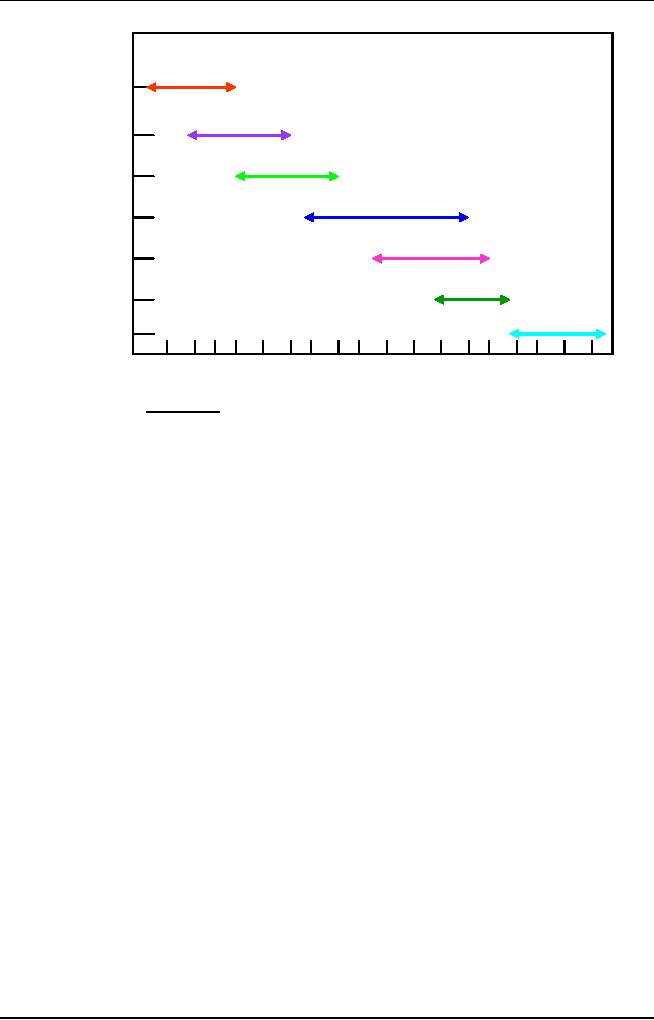
Figure 3
is another example of a Gantt
chart. The symbols used in
the chart are
widely
accepted, though not
standardized. The inverted
triangle, for example,
is
commonly
used to represent a significant event,
such as a major
milestone.
The
Gantt chart in Fig. 3 demonstrates
the ease with which
important schedule
information
can be quickly perceived. We can
immediately see that, except
for the
maintenance
phase, all phases overlap,
and that from November to
mid-December
1992
three high level activities
overlap.
Major
milestones
SRR
=
Software requirements
review
POR
=
Preliminary design review
COR
=
Critical design review
TRR
=
Test readiness review
ATP
=
Acceptance test procedure
293
Software
Project Management
(CS615)
SPR
Requirements
analysis
PDR
Top
level design
CDR
Detailed
design
Implementation
TRR
Integration
ATP
Testing
Maintenance
Jan
Feb Mar Apr May
Jun Jul Aug Sep
Oct Nov Dec Jan
Feb Mar Apr
1992
May
Jun
1993
Major
milestones
SRR =
Software requirements review
PDR =
Preliminary design
review
CDR =
Critical design
review
TRR =
Test readiness review
ATP =
Acceptance test procedure
Figure
3: High
level Gantt chart -project
development schedule.
More
detailed charts can also include
the names of the engineers
assigned to each
activity,
and the equipment that will be
needed for each activity.
This information
can be
added next to the activity
time lines in the graph, or
as an inserted
reference
table (similar to the list
of major milestones in fig
10.1). Some
variations
of the Gantt chart do
include this type of
information on the chart,
but
this can
cause clutter, which is
contrary to the main
objective of the chart;
to
enable
important schedule information to be
grasped quickly.
It is also
important to understand what
Gantt charts do not provide.
In a Gantt
chart, it
is difficult to provide information on
the amount of resources
required to
complete
each activity. A common
mistake is to conclude that if
five engineers
are
assigned to integration, and the
integration activity starts in
mid-September
1992 and
ends in mid-January 1993 (four
months), then integration
requires 20
work
months. In fact, integration
may start with only one
engineer, with one
more
joining
during the second month, and
the remaining three engineers
joining during
the
third month. The integration
team may then be reduced to three
engineers
during
the fourth integration
month.
Figure 3
includes only seven activities. As
more detail becomes
available, lower
level
activities can be included on the
chart. When the chart
has more activities
than it
can reasonably carry (a subjective
decision), additional charts
may be
294
Software
Project Management
(CS615)
added.
For example, the design
activity can be presented on a separate
Gantt chart
(see
Fig. 4).
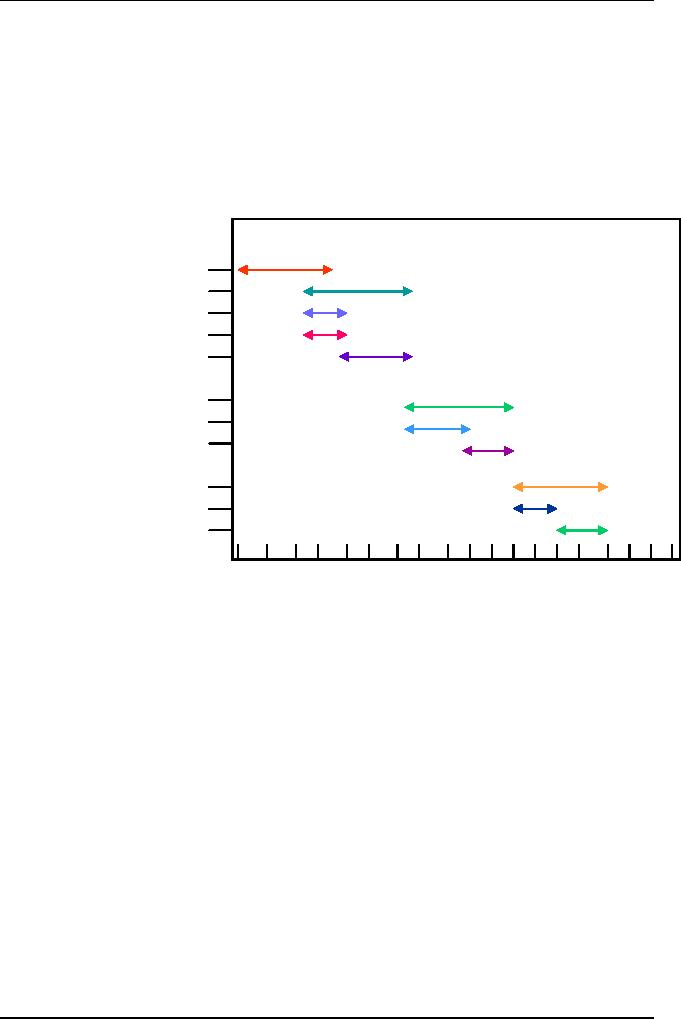
Figure 4
presents both high and low
level activities. For
example, 'Integrate
phase
1 model'
contains three low level
activities: 'Integrate executive',
'Integrate
operating
system' and 'Integrate user interface'.
This provides the continuity
link
between
the detailed Gantt chart
(Fig. 4) and the higher
level chart (Fig.
3).
Set
up
integration
site
Integrate
phase
I
model
Integrate
executive
Integrate
operating
system
Integrate
user
interface
Integrate
phase
TRR
II
model
Sep
15
Oct
Nov
Dec
Jan
1992
1993
Figure
4: Detailed
Gantt chart -integration
schedule
Note
that each period of one
month in Fig. 3 has been
divided into four
weeks.
Though
not completely accurate, this is a
common approximation, used also
in
estimation
and apart from being convenient; it also
provides some slack for
minor
scheduling
adjustments.
Similar
detailed Gantt charts can be
prepared for each of the
major project
development
phases. Non-development activities will
also appear on the
Gantt
chart,
such as 'Procurement of development
tools', or 'Market research'. This
is
particularly
useful when certain
development activities are dependent on
other
non-development
activities, such as the
procurement of development tools
(e.g. a
compiler)
that need to be completed
before the implementation
activities can
begin. In
cases where such dependent
relationships may have been
overlooked,
they will
often emerge from' a review
of the Gantt chart. This
type of dependence
295

Software
Project Management
(CS615)
between
activities is best presented in
another type of chart,
called a Network
precedence
chart or a PERT
chart.
Network
Scheduling Techniques
To plan
the activities in a project,
you can also use
network-scheduling
techniques.
Network scheduling techniques
use network schedules to trace
the
completion
of predetermined activities.
There
are two basic
network-scheduling techniques:
·
PERT
and
·
CPM
You can
use either of these
techniques to analyze a wide
variety of projects. Each
technique
depicts a project as a sequence of
activities. This helps you
perform an
analysis
of individual activities or the
complete project.
The
network-scheduling techniques also enable
you to analyze the
dependencies
that
exist between the
activities.
Using
PERT and CPM, individually or in
combination, helps you
complete a
project
on time. By using these
techniques, you can determine
the latest time by
when an
activity should start to be
completed on time.
Despite
the different approaches
followed by PERT and CPM,
both techniques
have
some common components. These
include:
a)
Activities
b)
Nodes
c)
Network
d)
Critical
path
a)
Activities
Activities
are the basic building
blocks of network schedules. An activity
is
defined
as a task that consumes time, effort,
money, or any other resource. It
is
necessary
to specify all the
activities of a project by breaking
down a project into
several
steps.
You need
to define the steps in such
a way that they are
distinct, homogeneous
tasks
for which you can estimate resource
requirements.
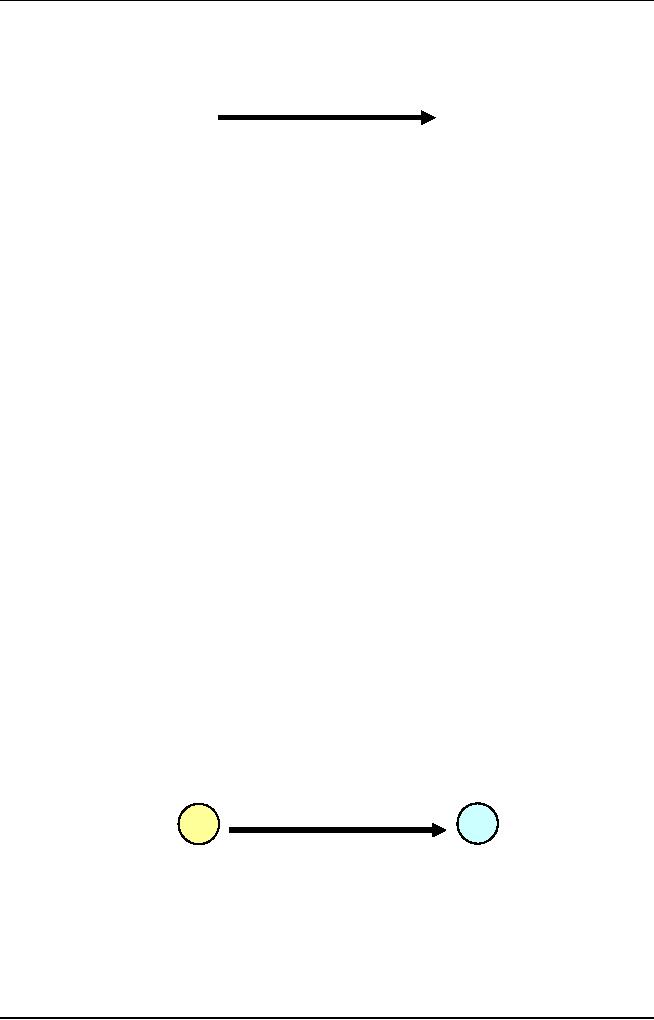
Each
activity is represented on a network
schedule by using an arrow
with its
head
indicating the direction in
which the project will progress. Each
activity is
identified
by a description or an alphabet. In
addition, the estimated duration
of
296
Software
Project Management
(CS615)
each
activity is placed below the
activity. Figure 5 shows an
activity with
expected
duration of 15 days.
A
15
Days
Figure
5:
An
Activity
After
identifying all the
activities in a project, it is necessary
to schedule them.
This
enables you to arrange the
activities in the order of
completion. You
sequence
the activities based on
their types.
The
different activities that
are possible in a project are
predecessor, successor,
and
concurrent activities.
Predecessor
activities need to end before
the next can begin. After a
predecessor
activity
is completed, the successor
activity becomes the
predecessor for
another
activity.
However, unlike the
predecessor arid successor
activities, the
concurrent
activities
can be completed simultaneously with
other activities.
Some
activities in a project, irrespective of
whether they are
predecessor,
successor,
or concurrent, may depict a
float period. Float is the
amount of time by
which an
activity may be delayed
without affecting the
completion date of
the
entire
project. However, the
complex dependencies that
exist between
activities
result in
sequencing constraints for
projects. To a large extent,
these constraints
limit
the flexibility that you
may otherwise have in
project planning.
b)
Nodes
A node on a
network schedule is that
point in time at which an
activity either
begins or
ends. The point where an
activity begins is called a tail node and
the
point
where it end is called its
head node. On a network
schedule, a circle
represents
a node. A number identifies
each node in a network schedule.
Figure 6
represents
the tail and head nodes
for the activity of
interviewing clients in a
project.
2
1
Figure
6: An
Activity Connecting Two
Nodes
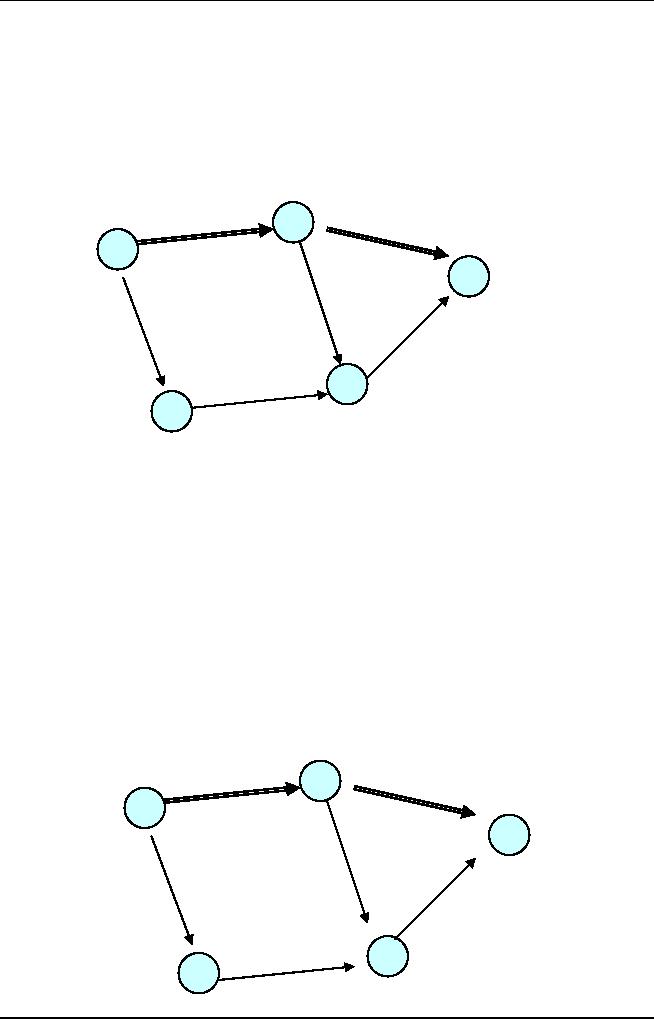
c)
Network
297
Software
Project Management
(CS615)
A network
is the graphic representation of
the activities in a project. It depicts
all
the
activities and nodes in the
project. On- a network, the
arrows terminating at a
node need
to be completed before the
following activity can begin.
Figure 7
shows a
sample network consisting of five
activities in a project.
2
1
5
4
3
Figure
7: Sample
Network Schedule
d)
Critical Path
The
critical path is the longest
path through a network. It consists of
those
activities
that cannot be completed
concurrent1y. In other words,
the critical path
represents
the maximum duration for a
project. You can determine the
maximum
duration
by adding the duration of
each activity on the
critical path. Typically,
a
double
line in a network schedule
represents the critical path
for that project.
Figure
8.6 shows the critical
path for a network.
2
1
1
5
5
4
2
6
4
3
3
298
Software
Project Management
(CS615)
Figure
8: Network
Schedule with Critical Path
Identified
All the
activities on the critical
path are critical for a
project. If an activity on
the
critical
path is delayed, the entire
project is delayed by the
same amount of time.
You need
to monitor the activities on
the critical path because
the project depends
on the
successful completion of these
activities. If required, additional
resources
can be
applied to these activities to
shorten the project
duration. However,
some
of these
activities may also depict a
float period.
8.6
Rules
for Creating a Network
Schedule
There
are a few basic rules
that are followed while
constructing a network
schedule.
1. Each
activity has a preceding node and a
succeeding node.
2. Each node
has a distinct number. As a
convention, the number that
is assigned
to the
head of the arrow is greater
than the number that is
assigned to the tail.
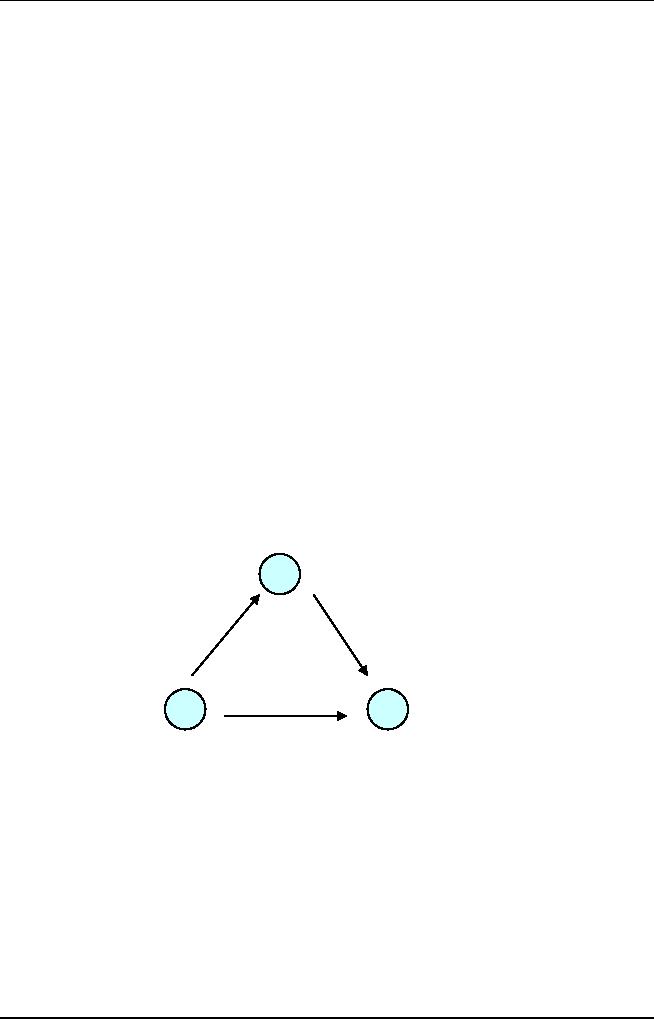
3. The
network schedule has no
loops. For example, in
Figure 9, activity 1 is
the
predecessor
of both activity 2 and activity 3.
This places activities l, 2, and
3
in a
loop.
3
1
2
Fig
9: A
loop is not permitted
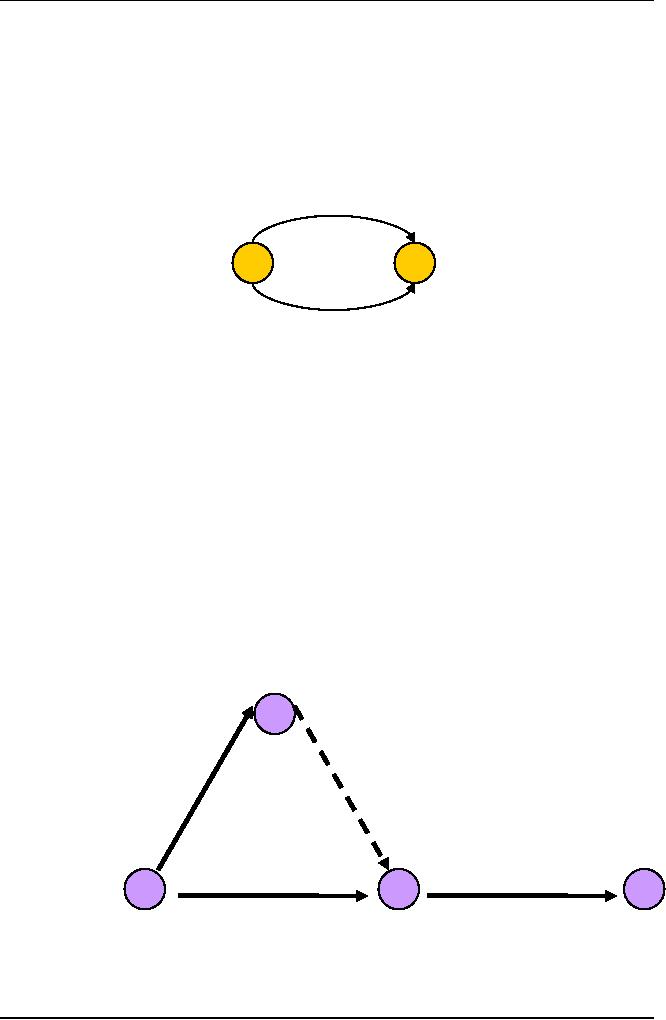
4. Each
activity has a unique
preceding and succeeding event associated
with it.
For
example, in Figure 10,
activities A and B have common
preceding and
succeeding
events associated with them.
This is not allowed in a
network
schedule.
299
Software
Project Management
(CS615)
A
1
2
B
Figure
10:
Activities with Common Preceding and
Succeeding Events
At times,
you need to introduce a
dummy activity in a network
schedule. This is
an
imaginary activity that
enables the network schedule
to display parallel
activities.
For example, in Figure 11,
consider A and B as two parallel
activities
that can
be executed simultaneously. Both A and B
must end so that activity
C
can
begin. A dummy activity is
introduced as a dashed arrow to
mark the start of
activity
C. The dummy activity is
introduced to show the
dependency between
activities
in the network schedule and
does not have a description
or duration.
3
B
A
C
1
2
4
Figure
11: Dummy
Activity
300

Software
Project Management
(CS615)
8.7
Using
PERT to Schedule a
Project
PERT was
developed in 1957 to cater to the needs
of the Polaris Fleet
Ballistic
Missile
project of the US government.
PERT uses a probabilistic approach to
time
estimates. You
normally apply it to projects
that are characterized by
uncertainty.
For
example, in a complex software
project where you require
research to identify
activities.
PERT allows you to account
for the uncertainties that
are common to
most
software projects. PERT uses
the network schedule to represent a
project
schedule
while taking the
uncertainties into
account.
i.
Time
Estimates in PERT
PERT is a
probabilistic technique that
uses three time estimates: It
assumes
that
activity times are
represented by a probability
distribution. To finish an
activity,
it bases the probability
distribution of activity time on
three time
estimates:
·
Optimistic
time
·
Pessimistic
time
·
Most
likely time
The
optimistic time is the
shortest time period within
which an activity can
end if
everything goes well.
The
pessimistic time is the time
that an activity takes to
complete if
everything
that can go wrong goes
wrong. This is the longest
time that an
activity
can take to complete.
The
most likely time is the
estimate of the normal time
that an activity takes
to
complete.
From
these three estimates, you
derive the expected time to
complete an
activity.
The expected time is also referred to as
the average time for
the
activity.
To
calculate the expected time
for each activity, you
use the following
equation:
T 0 + 4T m +
T p
Te =
6
Where
Te is the
expected time, T0
is the
optimistic time, Tm is
the most likely
time, and
Tp is the
pessimistic time required to
complete an activity.
301
Software
Project Management
(CS615)
According
to this equation, you
calculate the expected time
for an activity as a
weighted
mean of the optimistic, most
likely, and pessimistic times.
The
weights
attached to these times are 1, 4, and 1,
respectively.
Consider
the example of the
activities in a software project as
given in Table
1. The
time estimates provided in
Table 1 are the estimated
times for each
activity.
Table 2 provides the
break-up of the estimated times
into the
optimistic,
pessimistic, and most likely
times for each
activity.
Table
2: Optimistic,
Most Likely Time, and Pessimistic
Estimates for Activities
Optimistic
Time
Most
Likely
Pessimistic
Tasks
Estimates
Time
Estimates
Time
Estimates
(person
days)
(person
days)
(person
days)
Requirement
analysis and project
planning
7
10
13
Setting
up the environment
3
6
9
Software
construction
48
83
100
Unit
testing
20
28
33
User
training
4
5
6
System
testing
10
15
20
User
documentation
23
28
45
Data
migration
18
18
30
Conducting
user acceptance test
14
21
22
Using
the formula for calculating
estimated time for an activity,
the estimated
time
for requirements analysis and
project planning is:
7 + 4 ( 10 ) + 13
= 60 / 6 = 10 persondays
Te =
6
Similarly,
you can calculate the estimated
times for all the
activities in Table 2
using
the above formula.
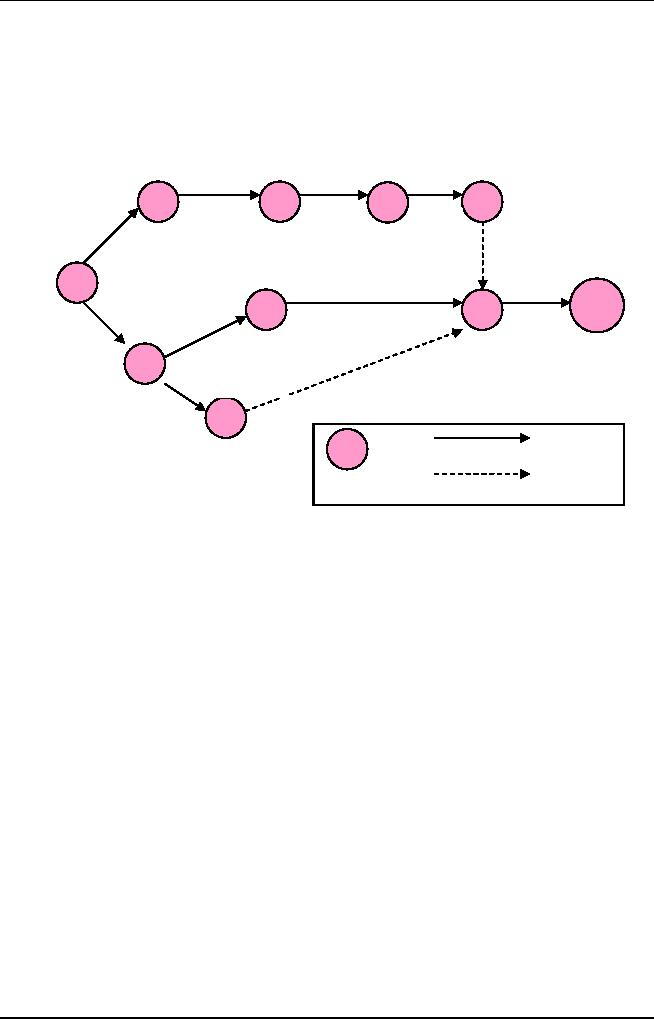
Figure 12
shows the PERT network
schedule created using the
time estimates.
302
Software
Project Management
(CS615)
Software
System
Unit
Testing
Construction
Testing
Requirements
2
4
9
7
Analysis
and
80
30
15
Project
Planning
User
10
Acceptance
User
Training
Testing
1
10
User
5
8
Documentation
5
20
6
30
3
Data
Migration
20
6
Node
Activity
Number
Dummy
Activity
Figure
12: PERT
Network Schedule for
Activities
ii.
PERT
packages and enhancements
Some
enhanced versions of the PERT
chart support additional
planning
activities,
such as personnel assignment, resource
allocation and cost analysis.
The
chart can then draw
attention to situations where
personnel are
assigned
more
responsibilities than they can
handle, or where allocation of
resources
conflicts.
An
interesting adaptation of PERT,
called flow graph
representation, which
was
developed by Riggs and Jones
(1990), uses precedence
networks to
perform
project life cycle cost
analysis. The flow graph
technique analyzes
project
costs based on relationships
between quantities, unit
cost, time
variables,
staffing costs and learning
etc., all of which are
represented on the
PERT-
like chart.
The
flow graph representation
technique places a significant
amount of
information
on the network graph. This
information, just like the
basic PERT
information,
must be kept constantly updated. A
small change to a large
PERT
chart can
require the complete
redrawing of the chart and
the recalculation of
the
critical path. The resulting
tedium does not promote
much enthusiasm for
303

Software
Project Management
(CS615)
keeping
the chart updated. For this
reason, many computerized PERT
utilities
have
been developed.
PERT
software packages have been
available for many years,
but it is only
during
the past few years that good
professional PERT packages
have become
available
on PCs and other small
computers. These packages take much of
the
tedium
out of the preparation of
PERT charts, and also come with
additional
features
such as various planning
analyzers for activity
assignment, what if
scenarios
and resource allocation.
Computer
utilities have been
developed to perform flow
graph representation
analysis
which produces scheduled costs
for major project
activities2. These
utilities
have proven invaluable for
project managers and release
managers
from
laborious desk work,
providing them with more
time to actively
manage
the
project.
304
Table of Contents:
- Introduction & Fundamentals
- Goals of Project management
- Project Dimensions, Software Development Lifecycle
- Cost Management, Project vs. Program Management, Project Success
- Project Managements nine Knowledge Areas
- Team leader, Project Organization, Organizational structure
- Project Execution Fundamentals Tracking
- Organizational Issues and Project Management
- Managing Processes: Project Plan, Managing Quality, Project Execution, Project Initiation
- Project Execution: Product Implementation, Project Closedown
- Problems in Software Projects, Process- related Problems
- Product-related Problems, Technology-related problems
- Requirements Management, Requirements analysis
- Requirements Elicitation for Software
- The Software Requirements Specification
- Attributes of Software Design, Key Features of Design
- Software Configuration Management Vs Software Maintenance
- Quality Assurance Management, Quality Factors
- Software Quality Assurance Activities
- Software Process, PM Process Groups, Links, PM Phase interactions
- Initiating Process: Inputs, Outputs, Tools and Techniques
- Planning Process Tasks, Executing Process Tasks, Controlling Process Tasks
- Project Planning Objectives, Primary Planning Steps
- Tools and Techniques for SDP, Outputs from SDP, SDP Execution
- PLANNING: Elements of SDP
- Life cycle Models: Spiral Model, Statement of Requirement, Data Item Descriptions
- Organizational Systems
- ORGANIZATIONAL PLANNING, Organizational Management Tools
- Estimation - Concepts
- Decomposition Techniques, Estimation Tools
- Estimation Tools
- Work Breakdown Structure
- WBS- A Mandatory Management Tool
- Characteristics of a High-Quality WBS
- Work Breakdown Structure (WBS)
- WBS- Major Steps, WBS Implementation, high level WBS tasks
- Schedule: Scheduling Fundamentals
- Scheduling Tools: GANTT CHARTS, PERT, CPM
- Risk and Change Management: Risk Management Concepts
- Risk & Change Management Concepts
- Risk Management Process
- Quality Concept, Producing quality software, Quality Control
- Managing Tasks in Microsoft Project 2000
- Commissioning & Migration