 |
Cost
& Management Accounting
(MGT-402)
VU
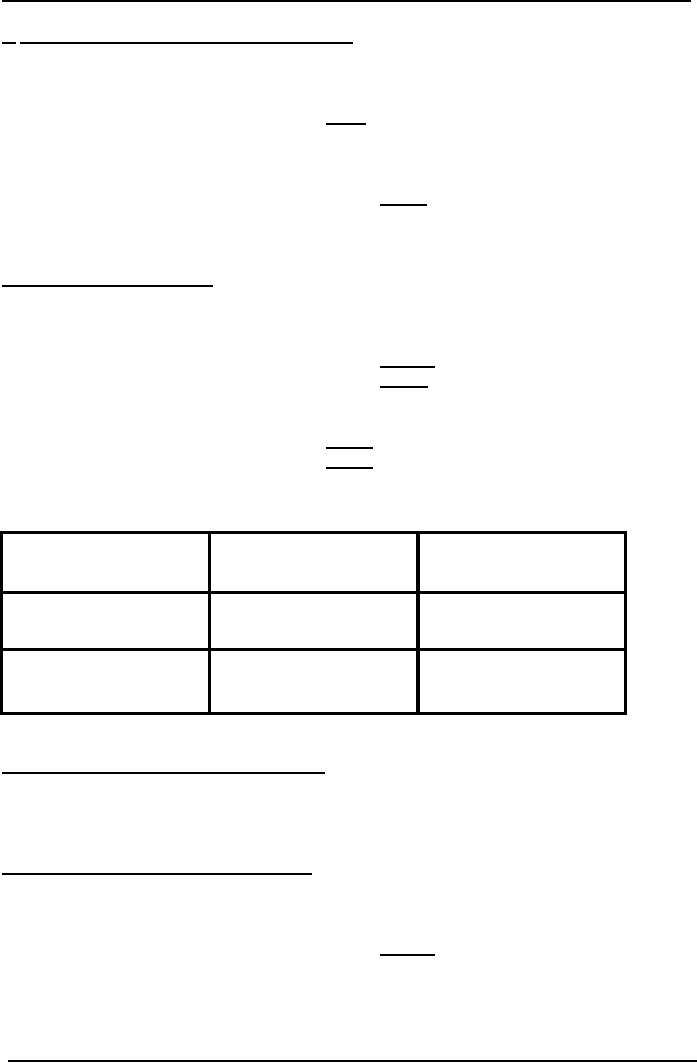
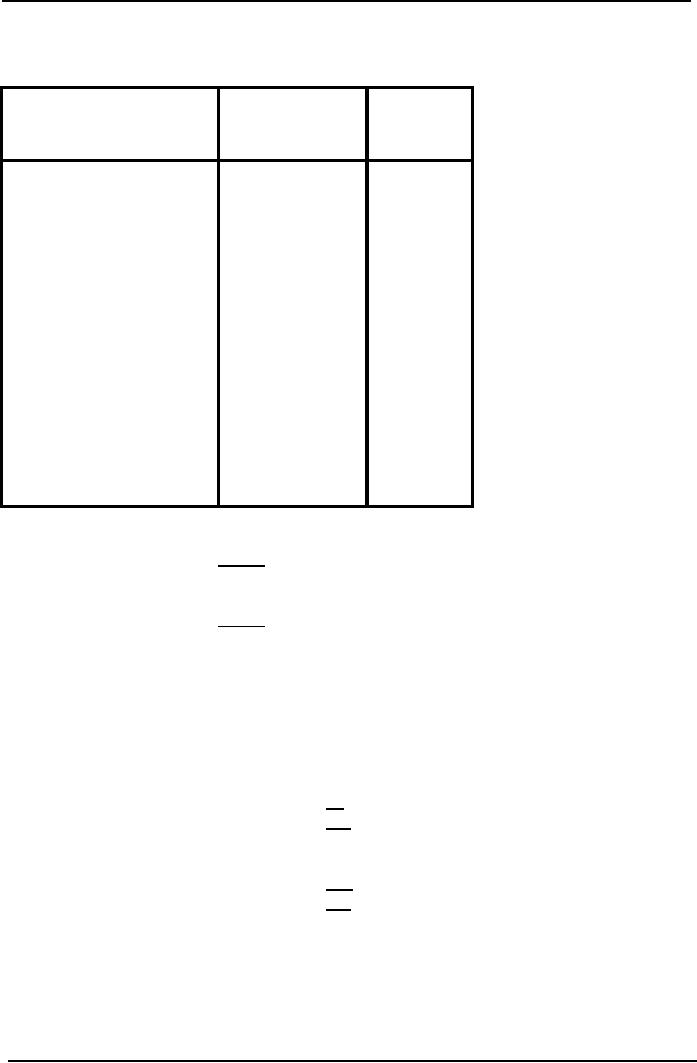
Weighted
average method
In the
weighted average method opening stock
values are added to current
costs to provide an
overall
average cost per equivalent
unit. No distinction is therefore
made between units in
process
at
the start of the period and those
added during it and the
costs associated with
them
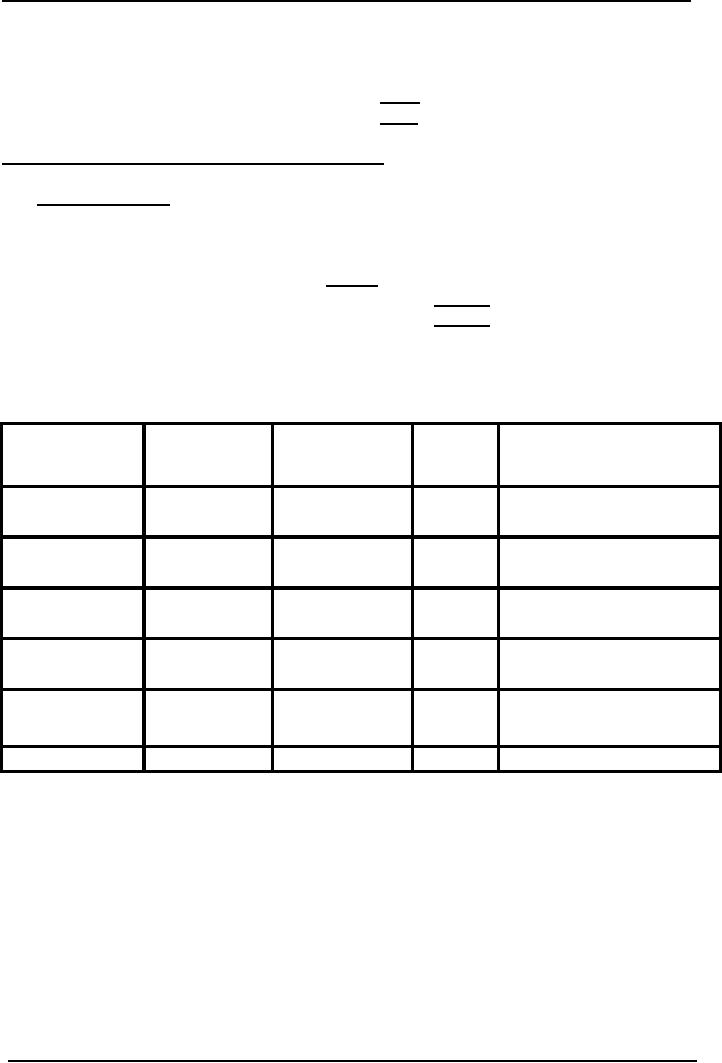
Problem
Question
FL
Manufacturing Co Ltd
Process
information for month ended
31 December
Work-in-process
1 December (15,000 units,
two-fifths complete)
Rs.
10,250 (work-in-process value made up
of: materials Rs
9,000
Plus
conversion costs
Rs1,250).
Units
started during
December
30,000
Units
completed during December
40,000
Work-in-process
31 December (half completed)
5,000
Material
cost added in month
24,750
Conversion
cost added in month
20,000
Materials
are wholly added at the
start of the process.
Conversion
takes place evenly
throughout the
process.
Calculate
the
values of finished production
for December and
work-in-process at 31 December,
using
the weighted average
method.
Choosing
the valuation method in practice
In
practice the FIFO method is
little used, for two
main reasons:
·
It is
more complicated to operate
·
In
process costing, it seems unrealistic to
relate costs for the
previous period to the
current
period
of activities.
Choosing
the valuation method in examinations
In
order to use the weighted
average or FIFO methods to account
for opening work-in-process
different
information is needed, as
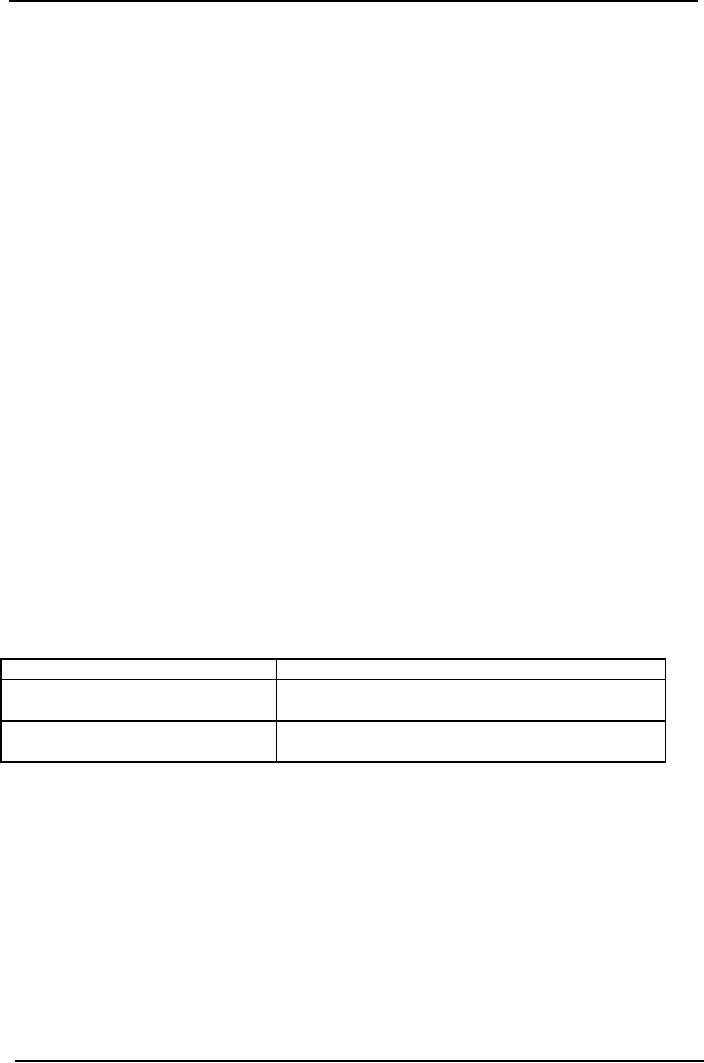
follows:
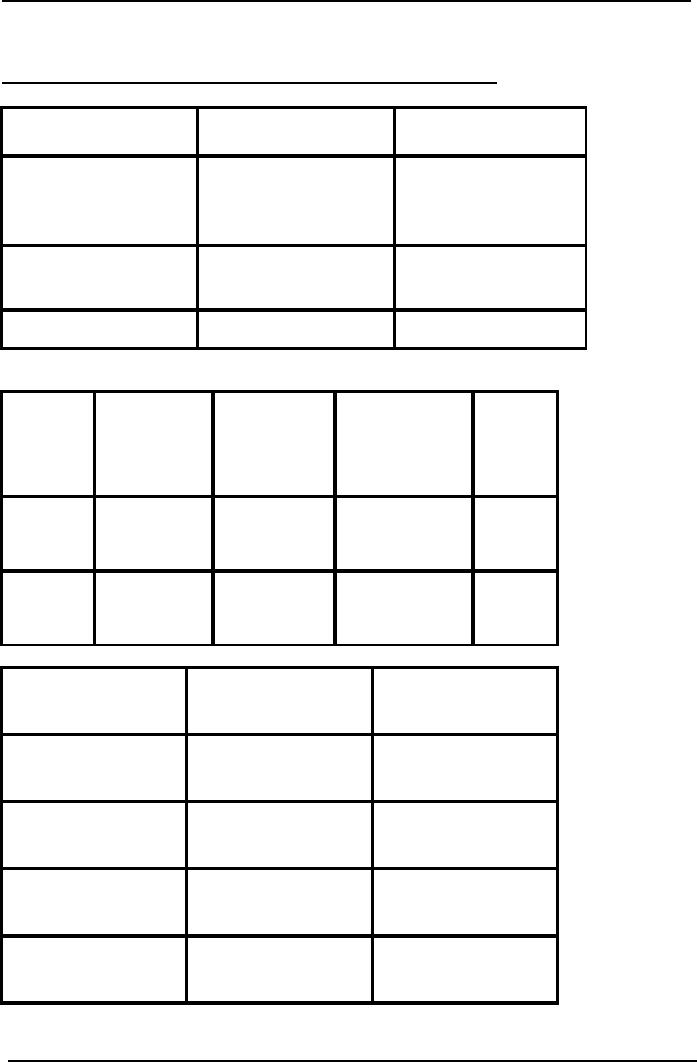
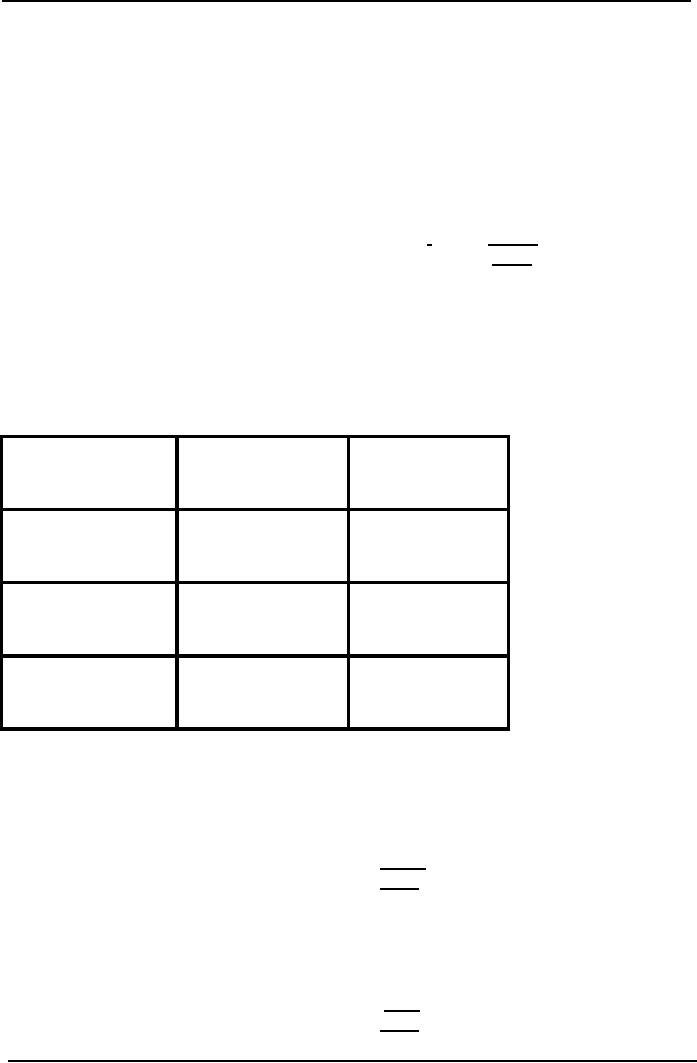
Method
Information
needed
For
weighted average.
An
analysis of the opening work-in-process
value
into
cost elements (i.e.
materials, labor)
For
FIFO
The
degree of completion of the opening
work in
process
for each cost
element.
If
all of the information is
available so that either
method may be used, the
question will specify
the
required method.
Where
there is opening work-in-process, two
methods of cost allocation can be
used which make
different
assumptions and produce different stock
valuations. They are FIFO
and weighted
average.
PRACTICE
QUESTION
Q.
1
Mini
Soap Manufacturing unit
providing following
information
Units
of opening work in process
200
units
Units
put into the
process
800
units
Units
completed and transfer
out
1000
units
Units
of opening work in process 100% completed
as per direct material and 75% completed
with
direct
labor and factory overhead
cost.
149
Cost
& Management Accounting
(MGT-402)
VU
Cost
incurred on opening work in process:
Direct
Material
Rs.
6,000
Direct
Labor
2,000
Factory
overhead
1,000
9,000
Cost
incurred during the accounting period on units
put in the process:
Direct
Material
Rs.
20,000
Direct
Labor
10,000
Factory
overhead
8,000
38,000
Required:
Prepare cost of production
report of process-1 (using FIFO
and Weighted Average
method
of inventory costing)
Cost
of Production Report
Department-1
I-Quantity
Schedule:
Units
of opening work in process
200
Units
put in the process
800
1,000
Units
completed and transfer
out
1,000
II-Cost
Accumulated in the
Process:
Direct
Material (6,000 +
20,000)
26,000
Direct
Labor (2,000 +
10,000)
12,000
F.O.H
(1,000 + 8,000)
9,000
47,000
III-Calculation
of Equivalent Units Produced
(FIFO)
As
to Direct Material 200 x 0% +
800
800
As
to Conversion cost 200 x 25%
+ 800
850
IV-
Unit Cost (FIFO) :
Direct
Material
20,000
/ 800
=
25
Direct
Labor
10,000
/ 850
=
11.7647
F.O.H
8,000
/850
=
9.4118
=
46.1765
V-
Cost Apportionment/Accounting Treatment
(FIFO) :
Cost
of opening work in process
Cost
already incurred on opening WIP
Rs. 9000
Material
100%
complete
0
Labor
200 x 25 % = 50 x 11.7647 =
588
FOH
200 x 25 % = 50 x 9.4118 =
471
10,059
Cost
of units put into the
process during the
period
800
x 46.1765
36,947
47,000
150
Cost
& Management Accounting
(MGT-402)
VU
III-Calculation
of Equivalent Units Produced
(W. Avg method)
Material
and Conversion cost = 1000
units
IV-
Unit Cost (W. Avg)
:
Direct
Material 26,000 /
1,000
=
26
Direct
Labor
12,000
/ 1,000
=
12
F.O.H
9,000
/ 1,000
= 9
47
V-
Cost Apportionment
Cost
of units transferred to the
next department:
1000
x
47
=
47,000
Q.
2
Mini
Soap Manufacturing unit
providing following
information:
Units
of opening work in process
200
Units
put into the
process
800
1000
Units
of closing work in process
300
Units
completed and transfer
out
700
Cost
incurred on opening work in
process:
Direct
Material
Rs.
6,000
Direct
Labor
2,000
Factory
overhead
1,000
9,000
Cost
incurred on units put in the
process:
Direct
Material
Rs.
20,000
Direct
Labor
10,000
Factory
overhead
8,000
38,000
47,000
Units
of opening work in process 100% completed
as per direct material and 75% completed
with
direct
labor but the units of
closing work in process 100% completed as
per material and 50%
direct
labor.
Required:
Prepare cost of production
report of process-1
Cost
of Production Report
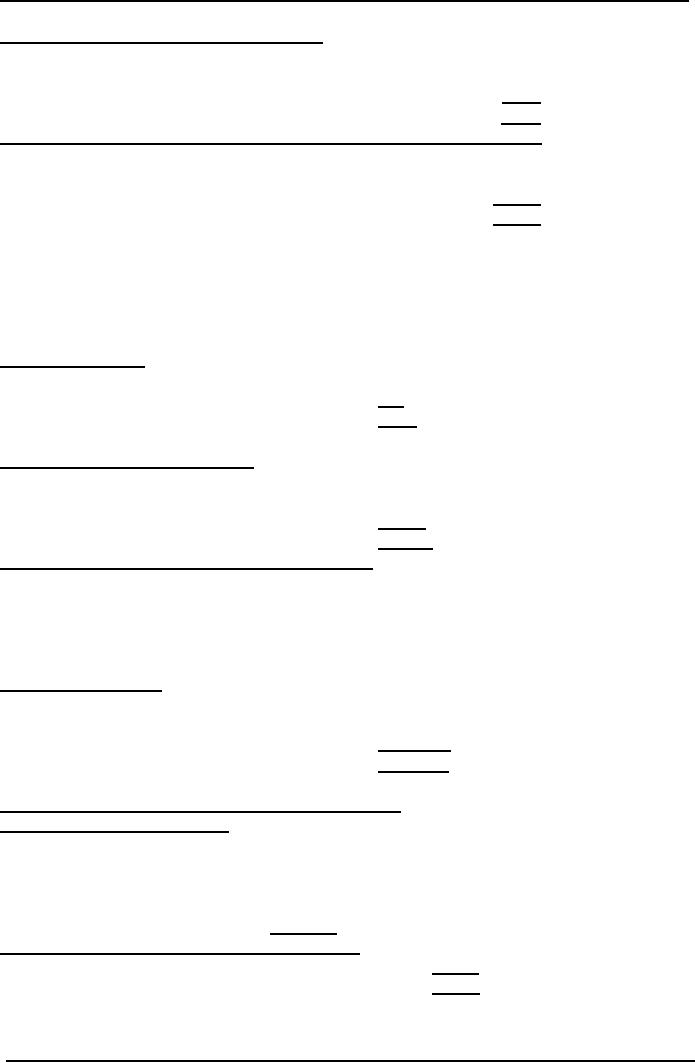
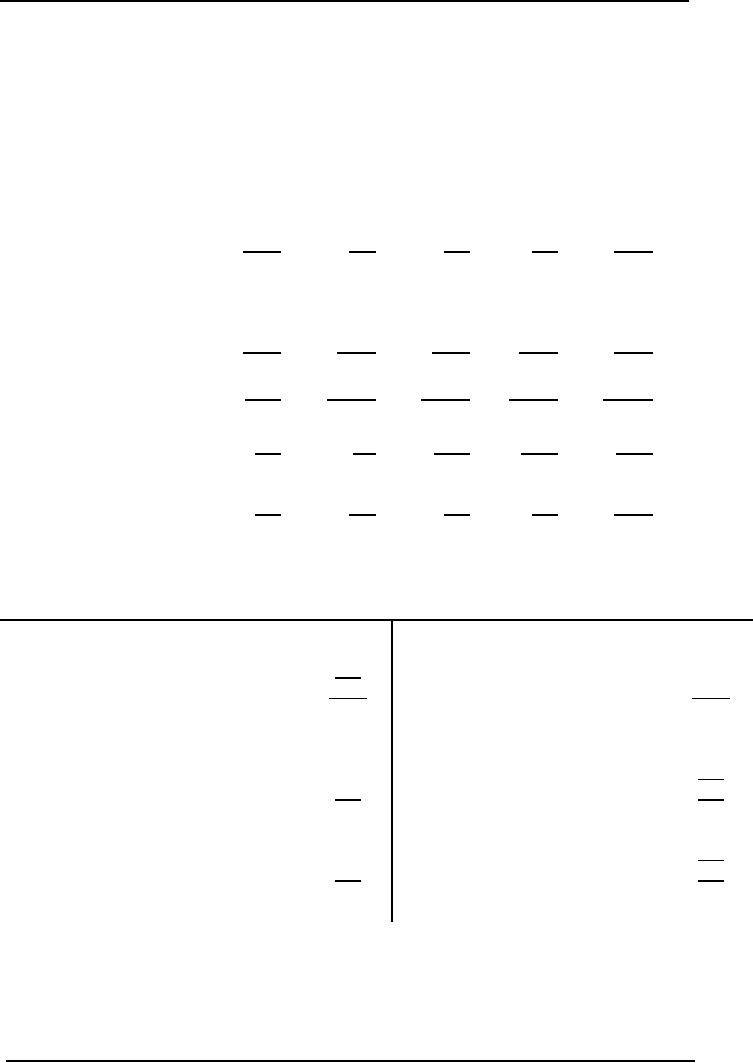
Calculation
of Equivalent Units Produced
(Weighted Average Method)
Material
Labor
FOH
Completed
units
700
700
700
Opening
WIP
300
(300
x50%)
(300
x50%)
150
150
Total
1000
850
850
151
Cost
& Management Accounting
(MGT-402)
VU
Per
unit cost (W.Avg)
Material
26,000
/ 1000 = 26
Labor
12,000
/ 850= 14.1176
FOH
9,000
/ 850 = 10.5882
Total
50.7058
Cost
Apportionment
Cost
of units transferred to the
next department:
700
x
50.7058
=
35,494
Work
in process
Material
300
x 26 =
7,800
Labor
150
x 14.1176 =
2,118
FOH
150
x 10.5882 =
1,588
11,506
47,000
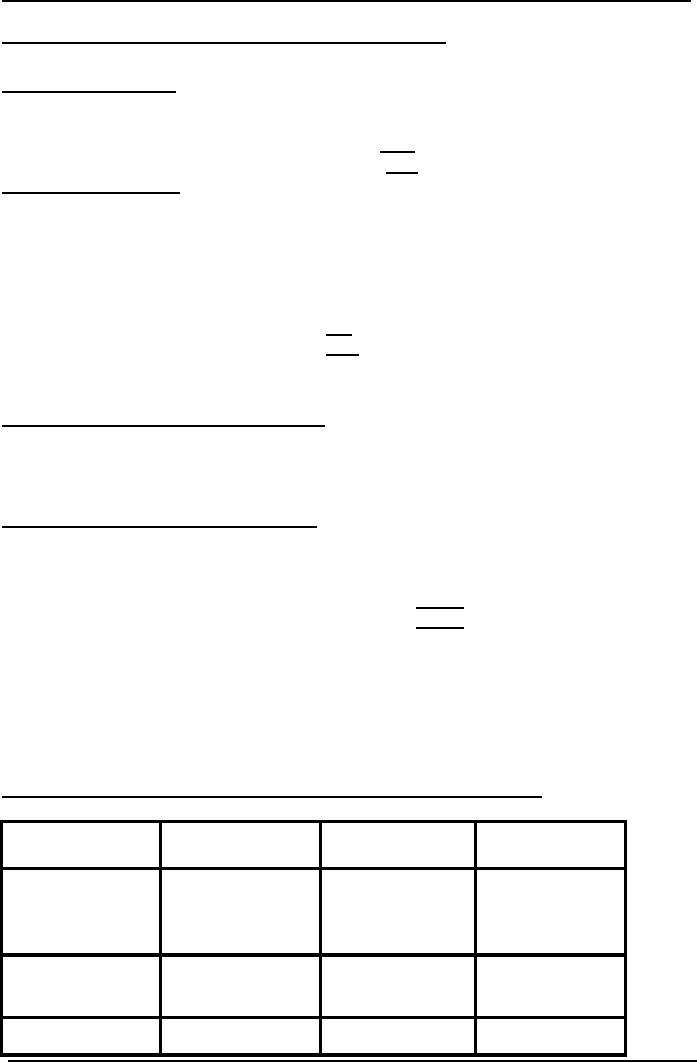
Equivalent
production (FIFO)
Opening
WIP Completed # of Closing work in
Total
units
(Current
process
period
)
(%
of completion)
Material
0
500
300
800
Labor
(200
x 25%)
500
(300
x 50%)
700
25
150
FOH
(200
x 25%)
500
(300
x 50%)
700
25
150
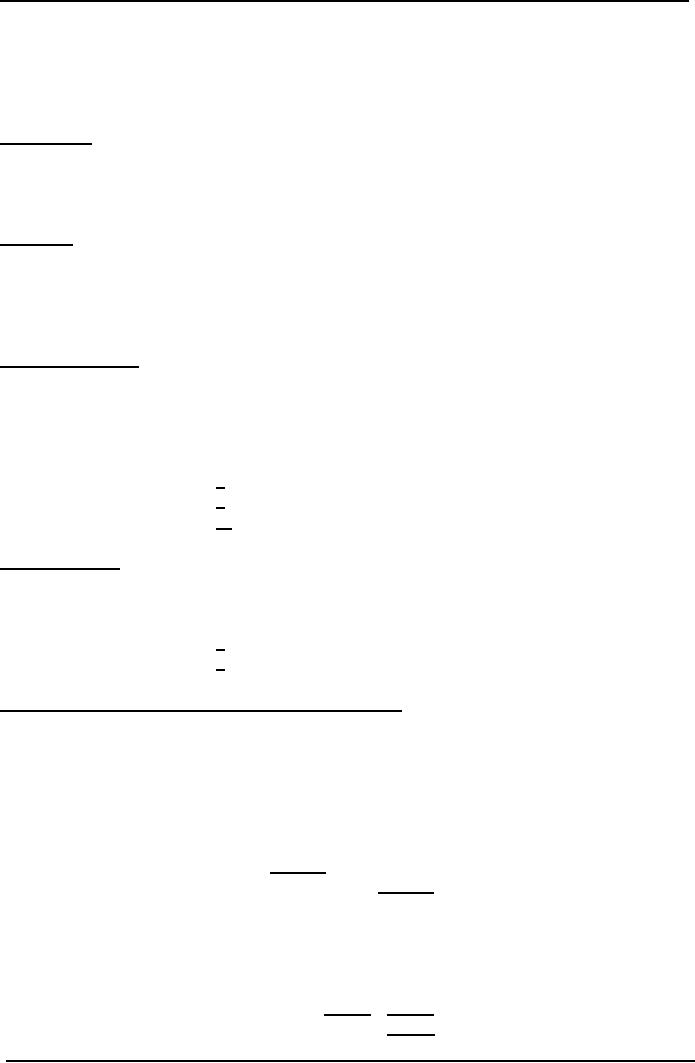
Cost
Per Unit (FIFO)
Direct
Material:
20,000
/ 800
=
25
Direct
Labor:
10,000
/ 700
=
14.2857
F.O.H
:
8,000
/ 700
=
11.4286
152
Cost
& Management Accounting
(MGT-402)
VU
1-
Cost of units transferred to next
department
a-
Opening work in
process
Cost
already incurred
9,000
Direct
Labor 200 x 25% = 50 x
14.2857 = 714
FOH
200
x 25% = 50 x 11.4286 =
571
10,285
b-
Cost of completed
units
500
x 50.7143
25,358
Cost
transferred to next
department
35,643
2-
Closing work in process
Material
300 x 25
=
7500
Labor
150
x 14.2857 = 2142
FOH
150 x 11.4286 =
1715
11,357
47,000
Q.
3
Units
of opening work in process
2,000
Units
produced during the period
16,000
18,000
Units
completed and transfer
out
14,800
Work
in progress at the
end
3,200
Stage
of completion
Material
Labor
& Overhead
Opening
WIP
100%
50%
Closing
WIP
100%
25%
Cost
incurred on opening work in
process:
Direct
Material
Rs.
24,000
Direct
Labor
3,200
Factory
overhead
3,200
30,400
Cost
incurred during the current period :
Direct
Material
Rs.
20,000
Direct
Labor
63,680
Factory
overhead
63,680
319,360
349,750
Required:
Prepare cost of production
report of process-1
153
Cost
& Management Accounting
(MGT-402)
VU
Cost
of Production Report
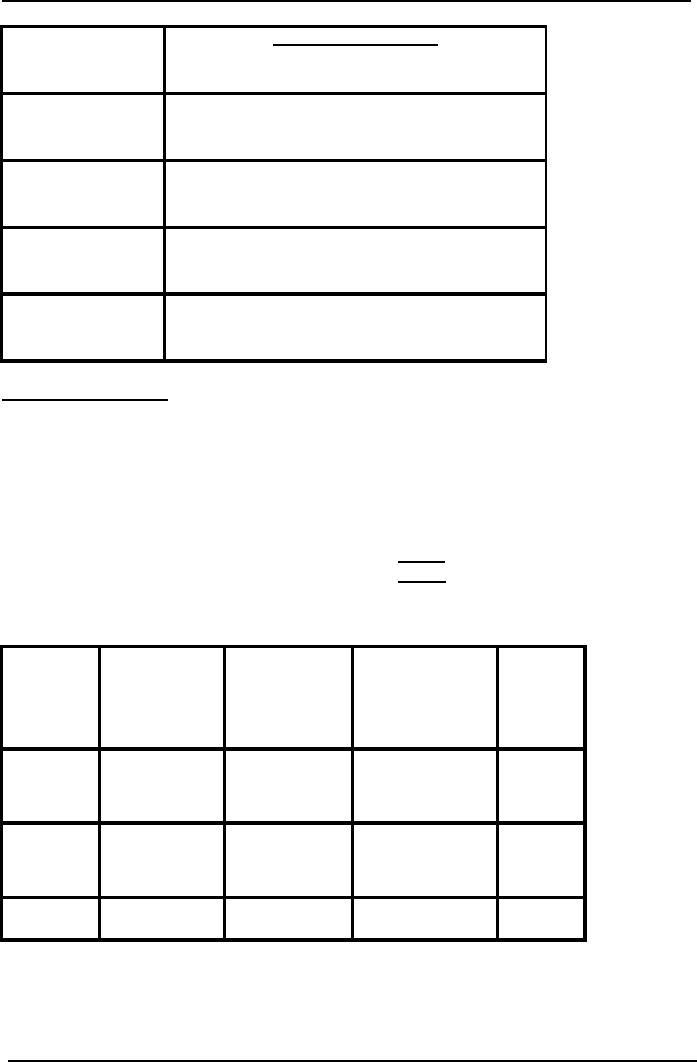
Calculation
of Equivalent Units Produced (Weighted
Average Method)
Material
Labor
& FOH
Completed
units
14,800
14,800
Opening
WIP
3,200
(3,200
x50%)
800
Total
18,000
15,600
Equivalent
production (FIFO)
Opening
WIP Completed # of Closing work
in
Total
units
(Current
process
period
)
(%
of completion)
Material
0
12,800
3,200
16,000
Labor
&
(2000
x 50%)
12,800
(300
x 25%)
14,600
FOH
1000
800
Per
unit cost (W.Avg)
Per
unit cost (FIFO)
Material
2,16,000
/ 18,000 = 12
19,200
/ 16,000 =
12
Labor
66,880
/ 15,600 =
63,680
/ 14,600 =
4.2872
4.3616
FOH
66,880
/ 15,600 =
63,680
/ 14,600 = 4.3616
4.2872
Total
20.5744
20.7232
154
Cost
& Management Accounting
(MGT-402)
VU
Cost
Apportionment (Weighed Average
Method)
Transfer
to next department
14,800
X 20.5744 =
304,500
Work
in process
Material
3200
x 12 = 38,400
Labor
800
x 4.2872 = 3430
FOH
800
x 4.2872 = 3430
45,260
349,760
Cost
Apportionment (Weighed Average
Method)
1-
Cost of units transferred to next
department
a-
Opening work in
process
Cost
already incurred
30,400
Direct
Labor 1000 x 4.3616
=
4316
FOH
1000
x 4.3616 =
4316
39,122
b-
Cost of completed
units
12,800
x 20.7232
265,258
Cost
transferred to next
department
304,380
2-
Closing work in process
Material
3,200 x 12
=
38,400
Labor
800 x 4.3616
=
3,490
FOH
800 x 4.3616
=
3,490
45,380
349,760
155
Cost
& Management Accounting
(MGT-402)
VU
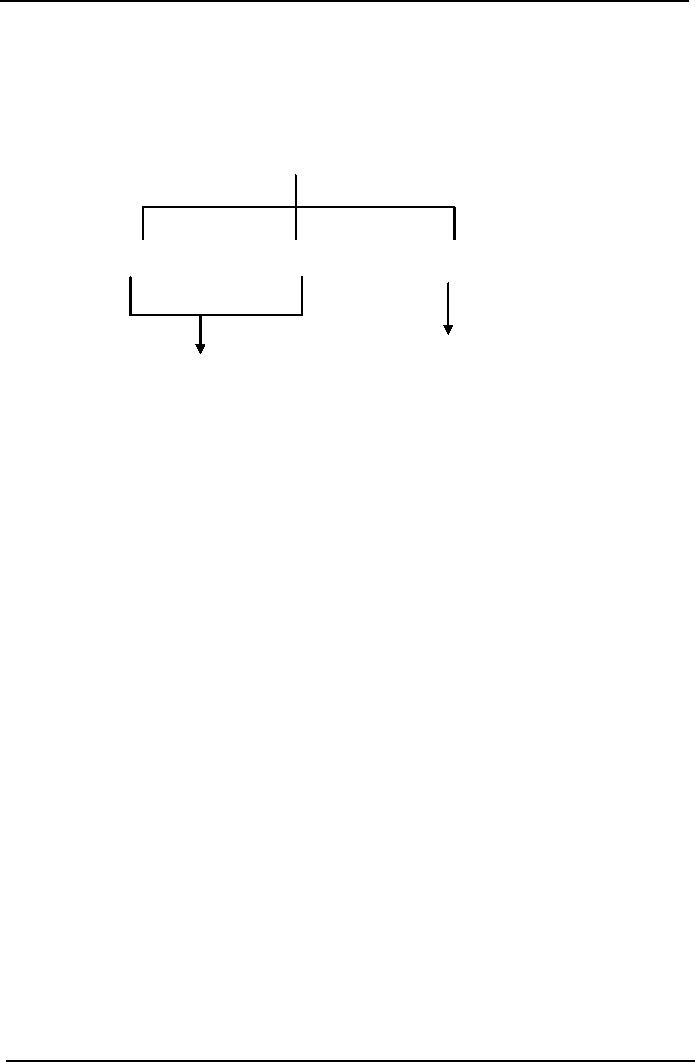
LESSON#
25 & 26
COSTING/VALUATION
OF JOINT AND BY PRODUCTS
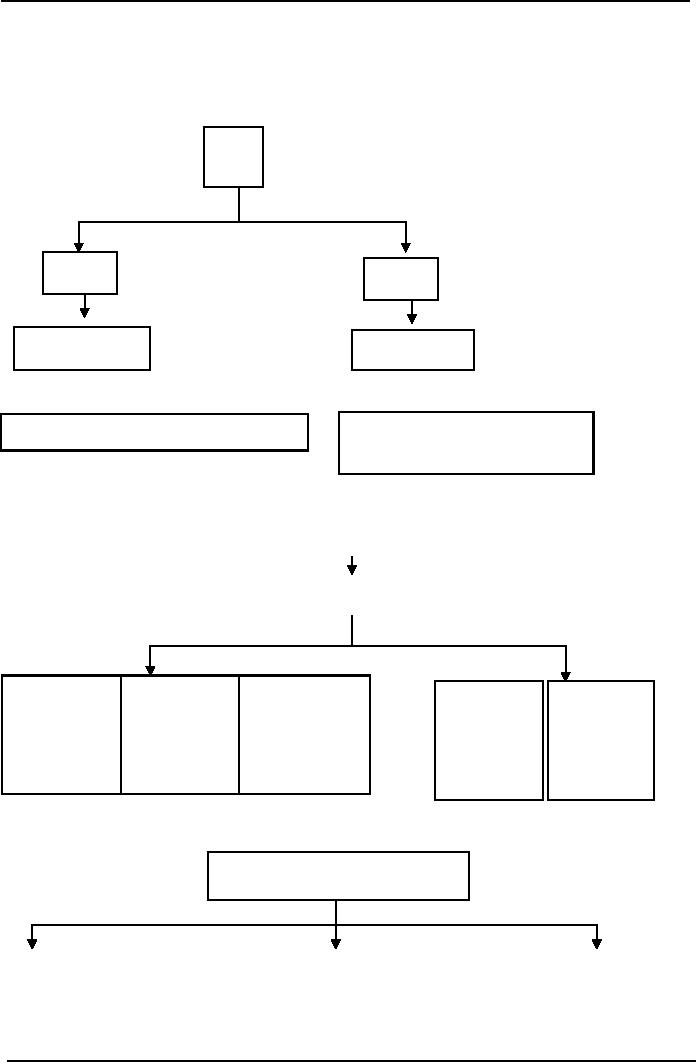
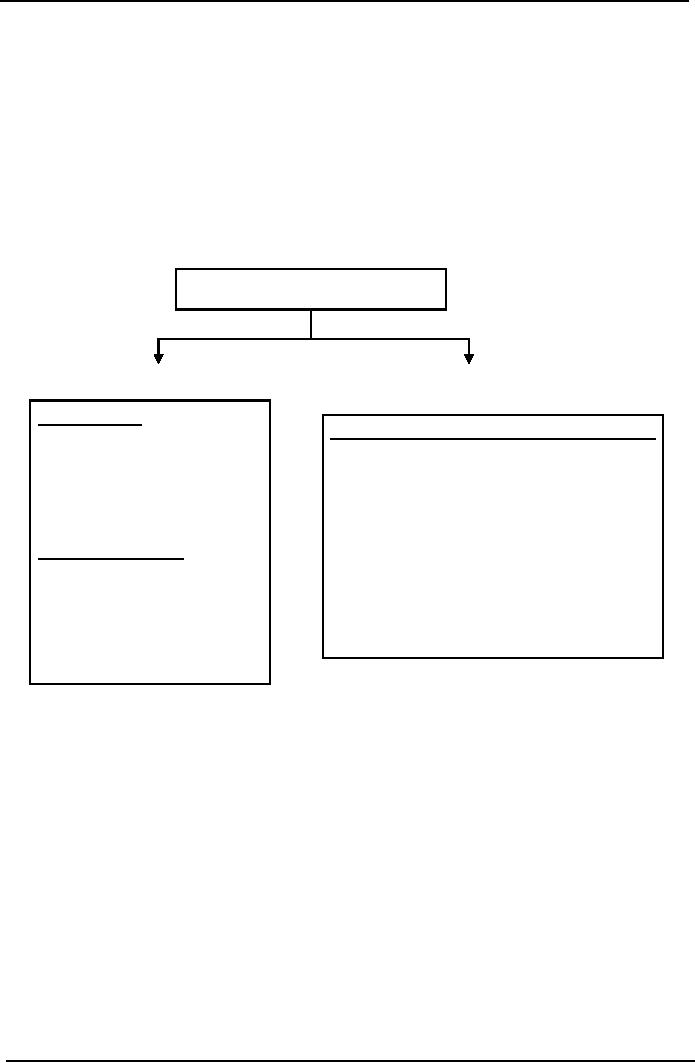
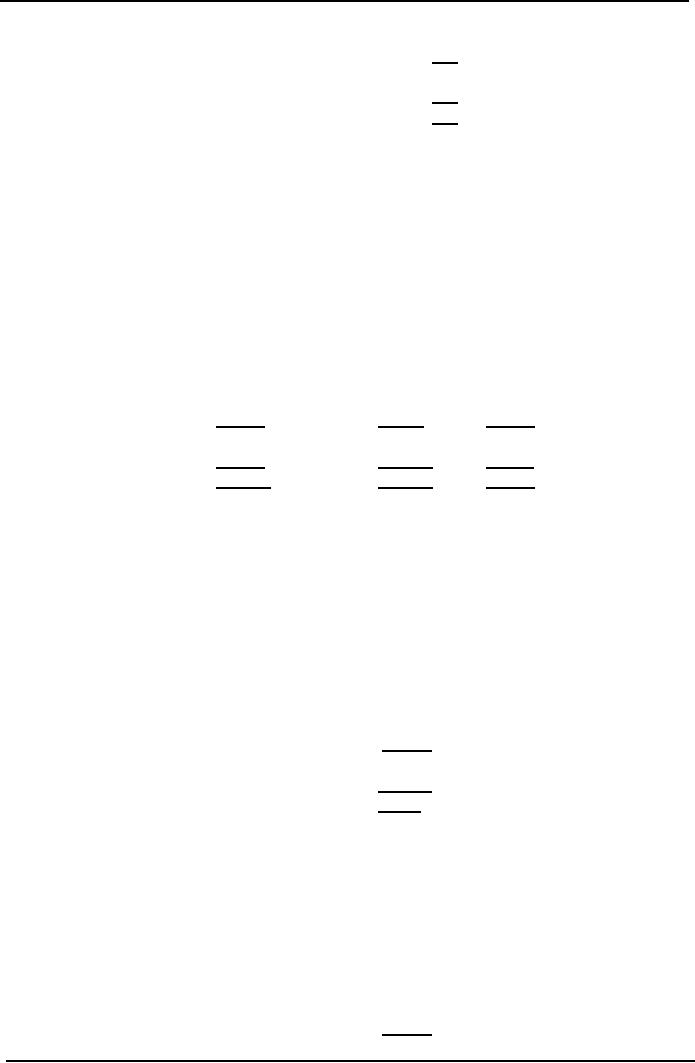
Following
are self explanatory diagrams
which help in understanding the concept
of joint product
and
by products.
Input
Output
Output
Joint
product
By
Product
Considerably
Significant
Incidental
Produce
Example:
Sugarcane Juice
Example:
Crude Oil (Diesel &
Petrol)
(Husk
or Pulp is a by product)
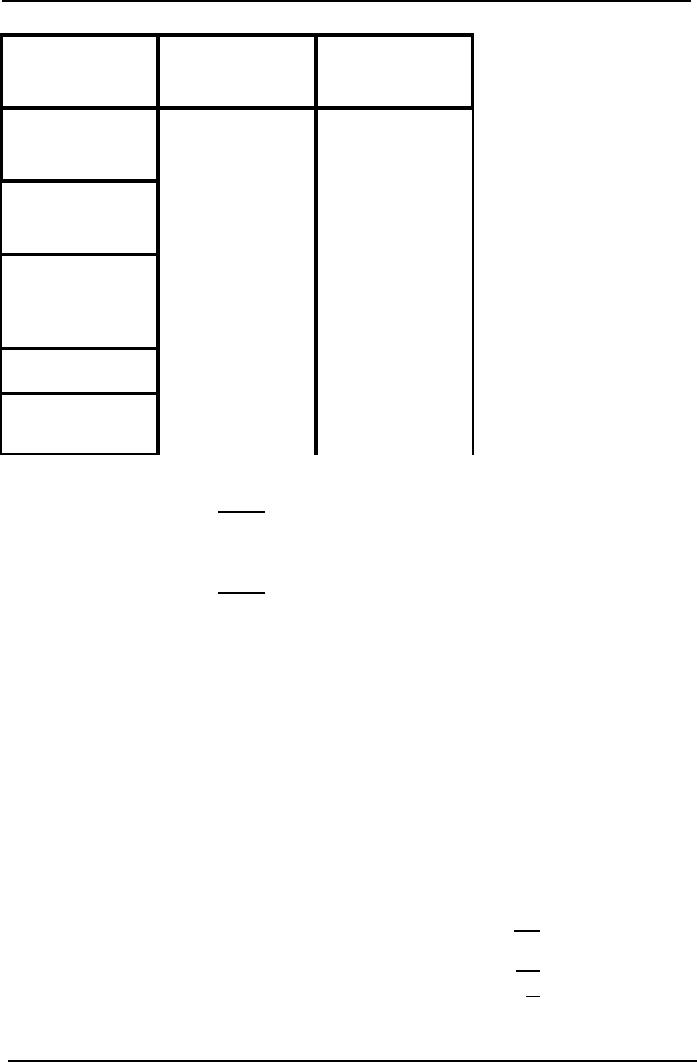
Department
A
(Cost
Accumulated)
Direct
Material, Direct Labor,
FOH
Joint
Product Joint Product Joint
Product
By
Product
By
Product
A
(a)
A
(b)
A
(c)
Requiring
no
Requiring
Direct
Material Direct Material
Direct Material
further
further
Direct
Labor Direct Labor
Direct Labor
process
process
FOH
FOH
FOH
For
by products:
Basis
of Cost Allocation
Physical
Quantity Ratio
Selling
Price Ratio
Hypothetical
Market
Value
Ratio
156

Cost
& Management Accounting
(MGT-402)
VU
Valuing
by-products and joint
products
By-products
Either
of the following methods may be
adopted when valuing
by-products:
(a)
The proceeds from the
sale of the by-product may
be treated as pure
profit
(b)
The proceeds from the
sale, less any handling and
selling expenses, may be applied in
reducing
the
cost of the main
products.
If
a by-product needs further
processing to improve its marketability,
such cost will be deducted
in
arriving
at net revenue, treated as in (a) or
(b) above.
Recorded
profits will be affected by the
method adopted if stocks of
the main product
are
maintained.
Accounting
for joint products
Joint
products are by definition, subject to
individual accounting procedures.
Joint costs may
require
apportionment between products if
only for joint valuation
purposes.
The
main bases for apportionment
are as follows:
Physical
measurement of joint
products
When
the unit of measurement is
different, e.g. liters and
kilos, some method should be
found of
expressing
them in a common unit. Some
joint costs are not
incurred strictly equally for
all Joint
products:
such costs can be separated
and apportioned by introducing
weighting factors.
Market
value
The
effect is to make each
product appear to be equally profitable.
Where certain products are
processed
after the point of
separation, further processing
costs must be deducted from
the market
values
before joint costs are
apportioned.
Technical
estimates of relative use of
common resources
Apportionment
is, of necessity, an arbitrary
calculation and product
costs which include such
an
apportionment
can be misleading if used as a
basis for decision-making.
Problems
of common costs
Even
if careful technical estimates are
made of relative benefits, common costs
apportionment will
inevitably
be an arbitrary calculation. When
providing information to assist
decision-making,
therefore,
the cost accountant will
emphasize cost revenue differences
arising from the
decision.
Here
are some examples of
decisions involving joint
products:
·
withdrawing, or adding, a
product
·
Special pricing
·
Economics of further
processing.
Apportioned
common costs are not
relevant to any of the above
decisions although a change
in
marketing
strategy may affect total
joint costs, e.g.
withdrawing a product may
allow capacity of the
joint
process to be reduced.
In
the short or medium term, it
is probably impractical and/or uneconomic
to alter the processing
structure.
The relative benefit derived by joint
products is, therefore,
irrelevant when considering
profitability
or marketing opportunities.
157

Cost
& Management Accounting
(MGT-402)
VU
PRACTICE
QUESTION
Q.
1
Physical
quantity method
Cost
Allocation at Split off
Point
1960
liter fresh milk put in
the process
Skim
Milk
1,000
Liter
Cream
500
Liter
Butter
200
Liter
Ghee
100
Liter
Yogurt
60
Liter
Miscellaneous
100 Liter
Cost
incurred for 1,960 liters of
milk is Rs. 15,680
Solution
Skim
Milk
=
15,680 / 1960 x 1000 =
8,000
Cream
=
15,680 / 1960 x 500 =
4,000
Butter
=
15,680 / 1960 x 200 =
1,600
Ghee
=
15,680 / 1960 x 100 =
800
Yogurt
=
15,680 / 1960 x 60 =
480
Miscellaneous
=
15,680 / 1960 x 100 =
800
Q.
2
Cost
incurred in the department Rs
70,000
Drum
sticks
Rs.
4 per gram
Breast
pieces
Rs.
6 per gram
Wings
Rs.
3 per gram
Miscellaneous
Rs. 2 per gram
Drum
stick
20,000
X 4
=
80,000
Breast
pieces
10,000
X 6
=
60,000
Wings
6,000
X 3
=
18,000
Miscellaneous
4,000
X 2
=
8,000
1,66,000
Solution
Drum
stick
=
70,000 / 1,66,000 x 80,000 =
33,735
Breast
pieces
=
70,000 / 1,66,000 x 60,000 =
25,300
Wings
=
70,000 / 1,66,000 x 18,000 =
7,590
Miscellaneous
=
70,000 / 1,66,000 x 8,000 =
3,375
70,000
Physical
Quantity Ratio
Total
quantity produced 40,000
grams
Drum
stick
20,000
Breast
pieces
10,000
Wings
6,000
Miscellaneous
4,000
40,000
158
Cost
& Management Accounting
(MGT-402)
VU
Drum
stick
=
70,000 / 40,000 x
20,000
=
35,000
Breast
pieces
=
70,000 / 40,000 x
10,000
=
17,500
Wings
=
70,000 / 40,000 x
6000
=
10,500
Miscellaneous
= 70,000 / 40,000 x
4000
=
7,000
70,000
Q.
3. ABC
limited produces three products O, P
and Q by the operation. Cost accumulated
during
the
operation.
Direct
Material 1000 kg @ Rs 2 =
Rs.
2,000
Direct
Labor
5,000
FOH
8,000
15,000
Output
O
500
Kg
Sold
at split off point for Rs 20
/ kg
P
300
kg
Enters
into a second process
Q
200
kg
Enters
into a second process
Second
process for product P
Cost
incurred: Total
Per
Unit
Direct
Labor cost
Rs.
6,000
Rs.
20
FOH
Rs.
3,000
Rs.
10
Product
P is 100% complete & sold for Rs 70 /
kg
Second
process for product Q
Cost
incurred: Total
Per
Unit
Direct
Labor cost
Rs.
1,400
Rs.
7
FOH
Rs.
600
Rs.
3
Product
Q is 100% complete & sold for Rs 30 /
kg
Solution
Method
# 1
Physical
Quantity Ratio
Process-1
Quantity
Schedule
Units
put in the process 1,000
kg
Completed
units of product "O"
500
kg
Transfer
to further process
Product
"P"
300
Product
"Q"
200
1000
Cost
Accumulated as follow:
Direct
Material
2,000
Direct
Labor
5,000
FOH
8,000
15,000
159
Cost
& Management Accounting
(MGT-402)
VU
Cost
Allocation / Accounting
Treatment
Product
O
=
15,000
x500 / 1000 = 7,500
Product
P
=
15,000
x 300 / 1000 = 4,500
Product
Q
=
15,000
x 200 / 1000 = 7,500
Product
O
No
further process is required
Completed
& Sold
Sold
500 x 20 = 10,000
Cost
500 x 15 = 7,500
Gross
Profit
2,500
Product
P
Cost
Accumulated
Cost
received from Process
1
Rs.
4,500
Direct
Labor
6,000
FOH
3,000
13,500
Unit
Cost = 13,500 / 300 = 45 /
Kg
Transfer
to finished goods = 300 x 45 =
13,500
Sales
300 x 70
=
21,000
Less
Cost 300 x 45
=
13,500
7,500
Product
Q
Cost
Accumulated
Cost
received from Process
1
Rs.
3,000
Direct
Labor
1,400
FOH
600
5,000
Unit
Cost
5,000
/ 200 = 25 / Kg
Transfer
to finished goods = 200 x 25 =
5,000
Sales
200 x 30
=
6,000
Less
Cost 200 x 25
=
5,000
1,000
Method
# 2 Hypothetical market Value
Basis
O
P
Q
Rs
Rs
Rs
Final
Price
20
70
30
Additional
Cost per kg
In
further processing
Direct
Labor
-
20
7
Factory
Overhead
-
10
3
Hypothetical
Market Value
At
split off point
20
40
20
160
Cost
& Management Accounting
(MGT-402)
VU
Cost
Allocation in the
Process-1
Product
O (Finished) 15,000 / 80 x 20
=
3,750
Product
P Transferred to process II 15,000 / 80 x
40
=
7,500
Product
Q Transferred to process II 15,000 / 80 x
20
=
3,750
15,000
Product
P
Process
-II
Quantity
Schedule
Received
From process-I
300
Completed
and transfer out
300
Cost
Accumulated
Cost
received from
process-1
7,500
Cost
added
Direct
Labor
6,000
FOH
3,000
9,000
16,500
Cost
Apportionment / Accounting
Treatment
Cost
transfer to finished
good
Rs
16,500
16,500
/ 300 = 55 per kg
300
x 55 = 16500
Sales
300
x 70
=
21,000
Less
Cost
300
x 55
=
16,500
Gross
Profit
4,500
Product
Q
Process
-II
Quantity
Schedule
Received
From process-I
200
Completed
and transferred out
200
Cost
Accumulated
Cost
received from
process-1
3,750
Cost
added
Direct
Labor
1,400
FOH
600
5,750
Cost
Apportionment / Accounting
Treatment
Cost
transfer to finished
good
Rs
5,750
5750
/ 200 = 28.75 per kg
200
x 28.75 = 5,750
Sales
200 x 30
=
6,000
Less
Cost 300 x 55
=
5,750
250
By
Products
Some
examples of by products are given
below:
161
Cost
& Management Accounting
(MGT-402)
VU
Main
Product
By
Product
Soap
Glycerin
Meat
Hides
& Fats
Flour
Bran
Classification
of by product
By
product can be classified
into two categories:
1.
Requiting no further process,
for example Bran
2.
Requiting further processing,
for example Hides
Accounting
for By Products
Income
Approach
Costing
Approach
Sales
Income
Credit
the cost of main product with
the:
1-
Treat as other income
1-
Replacement cost / Opportunity
2-
Treat as a deduction form
Cost
of By Product
Cost
goods sold
3-
Treat as a deduction form
2-
Predetermined price /
Standard
Cost
goods manufactured
Cost
Realizable
Income
1-
Treat as a deduction form
Cost
goods manufactured
162

Cost
& Management Accounting
(MGT-402)
VU
PRACTICE
QUESTION
Following
is a question on by product:
Main
product
By
product
Opening
stock
-----
-----
Production
during the year
4,000
800
Closing
stock
400
100
Cost
incurred
64,000
-----
Cost
of 3600 units (64,000/4000x3600)
57,600
-----
Sales
price (Per unit)
30
2.50
Further
processing cost
0.50
Solution
Method
# 1
Rupees
Treat
as an other income
Sales
(3600 x 30)
108,000
Less
Cost of goods sold
Opening
stock
----
Production
cost
64,000
Less
Closing stock (16 x 400)
(6,400)
57,600
Gross
Profit
50,400
Add
other income
1,400
51,800
Sales
of By Product
(700
x 2.5)
1,750
Less
Further Processing cost (700
x 0.5)
350
1,400
Method
# 2
Rupees
Treat
as a deduction from cost of
goods sold
Sales
(3600 x 30)
108,000
Less
Cost of goods sold
Opening
stock
----
Production
cost
64,000
Less
Closing stock (16 x 400)
6,400
57,600
Less
Sales value of By Product
(1,400)
56,200
Gross
Profit
51,800
Method
# 3
Rupees
Treat
as a deduction from cost of
goods manufactured
Sales
(3600 x 30)
108,000
Less
Cost of goods sold
Opening
stock
----
Production
cost (64,000
1,400)
62,600
Less
Closing stock (62,600 x 10%)
6,260
56,340
Gross
Profit
56,660
163
Cost
& Management Accounting
(MGT-402)
VU
Realizable
Value Basis
Production
cost on By Product
800
x 2.50 =
2,000
Additional
cost on By Product
800
x 0.50 =
400
Realizable
Value
1,600
Treat
as a deduction from cost of
goods manufactured
Sales
(3600 x 30)
108,000
Less
Cost of goods sold
Opening
stock
----
Production
cost (64,000
1,600)
62,400
Less
Closing stock
(62,400/4,000=15.6
x 400)
6,240
56,160
Gross
Profit
51,840
Further
example of by product
Joint
Cost Rs. 206,800
Further
Cost
Sales
Price Market Value
Incurred
per
pound
Grade
1
20,000
lb
1
5
(5-1)
= 4 x 20,000
80,000
Grade
2
40,000
0.2
4
(4-0.2)
= 3.8 x 40,000
152,000
Grade
3
60,000
0.5
3
(3-0.5)
= 2.5 x 60,000
150,000
Grade
4
80,000
0.2
2
(2-0.2)
= 1.8 x 80,000
144,000
Grade
5
50,000
0.1
1
(1-0.1)
= 0.9 x 50,000
45,000
Total
250,000
Multiple
Choice Questions
A
chemical compound is made by
raw material being processed
through two processes.
The
output
of Process A is passed to Process B where
further material is added to the
mix. The details
of
the process costs for
the financial period number 10
were as shown below:
Process
A
Direct
material
2,000
kilograms at Rs5 per kg
Direct
labor
Rs
7,200
Process
plant time 140 hours at
Rs60 per hour
Process
B
Direct
material
1,400
kilograms at Rs12 per kg
Direct
labor
Rs
4,200
Process
plant time 80 hours at
Rs72.50 per hour
The
departmental overhead for Period 10
was Rs 6,840 and is absorbed
into the costs of
each
164

Cost
& Management Accounting
(MGT-402)
VU
process
on direct labor cost.
Process
A
Process
B
Expected
output was
80%
of input
90%
of input
Actual
output was
1,400
kgs
2,620
kgs
Assume
no finished stock at the beginning of the
period and no work-in-progress at either
the
beginning
or the end of the
period.
Normal
loss is contaminated material which is sold as
scrap for Rs0.50 per kg
from Process A and
Rs1.825
per kg from Process B, for
both of which immediate
payment is received.
Q.
1
For
process A what is the scrap
value of the normal
loss?
A
Rs
200
B
Rs
2,000
C
Rs
1,000
D
Rs
0
Q.
2
What
is the abnormal loss for
process A in units?
A
100
B
200
C
300
D
400
Q.
3
What
is the cost per kg for
process A?
A
Rs 18,575
B
Rs 13,454
C
Rs 14.575
D
Rs 16,575
Problem
Question
Q.
1
Kong
CO. manufactures two products, one in
process A, the other in
process B. The
following
information
applies to the processes for
Period.
All
materials are input at the
start of each process, conversion
costs (labor and overhead)
are
incurred
evenly throughout the
process, and losses are
identified at the end of
process A and can
be
sold for 10p per liter.
The dosing work-in-progress is % of
the way through the
process.
Write
up the accounts for process A
and for process B
Process
A
Process
B
Material
input-1
4.000
liters costing
200
kg costing
Rs
3,000
Rs
2,000
Labor
and overhead
Rs
3,440
Rs
3,900
Transfers
to finished goods
13,000
liters
180
kg
Opening
work-in-progress
Nil
Nil
Closing
work-in-progress
Nil
20
kg
Normal
loss as % of input
10%
Nil
Q.
2
Mineral
Separators Ltd operates a
process which produces four
unrefined minerals known as W,
X.
Y and Z. The joint costs
for operating the process
for Period V were as
below.
Process
overhead is absorbed by adding
25% of the labor cost.
The output for Period V
was as
165

Cost
& Management Accounting
(MGT-402)
VU
shown
below.
There
were no stocks of unrefined
materials at the beginning of Period V,
and no work-in-
progress,
but the stocks shown
below were on hand at the
end of the period, although
there was
no
work-in-progress at that
date.
The
price received per ton of
unrefined mineral sold is shown
below and it is confidently
expected
that
these prices will be
maintained.
You
are required:
(a)
To calculate the cost value of
the closing stock, using sales value as
the basis of your
calculation.
(b)
To calculate the cost value of
dosing stock, using weight of output as
the basis of your
calculation.
166
Cost
& Management Accounting
(MGT-402)
VU
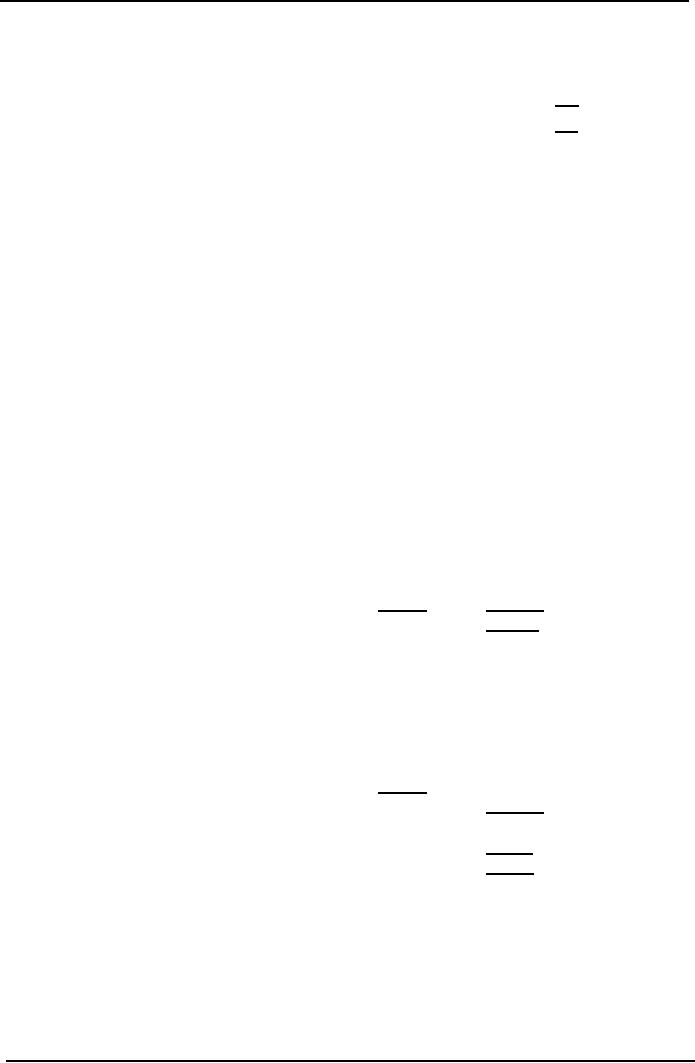
LESSON#
27 & 28
MARGINAL
AND ABSORPTION COSTING
(Product
costing systems)
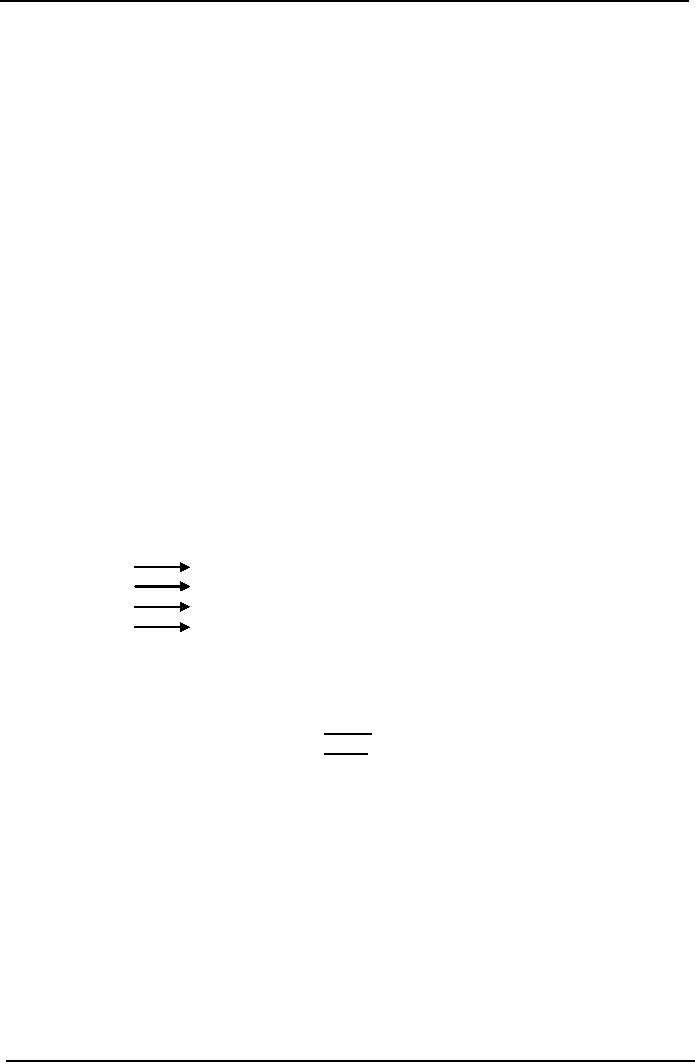
Following
diagram helps to recall the
behavior of different cost
elements.
Cost
Elements
Direct
Material
Direct
Labor
Factory
Overhead Cost
Variable
& Fixed Cost
Variable
Cost
Marginal
cost is the cost the
variable cost that changes
with the production of each
next unit.
Marginal
and Absorption Costing
So
far we
have
been looking at the various
different types of cost and
have gradually built up
the
total
cost of a cost unit by
aggregating the cost of direct
materials, direct labor, direct
expenses,
variable
overheads and fixed
overheads (absorbed into
cost units). We can display
this total cost as
part
of a profit and loss account
(namely cost of sales). In
doing so we must remember to
adjust
the
profit and loss account
for any overhead under- or
over-absorbed.
This
adjustment is only necessary
because we are including
fixed overheads in the cost
of the cost
unit.
In other words, we are presenting
cost information according to
absorption costing
principles.
However, there is another
method of presenting cost information,
i.e. marginal costing.
Marginal
Costing
Under
this system, we do not
attempt to absorb fixed
overheads into cost units,
and so we avoid
the
difficulties of setting absorption rate,
adjusting for under or over-absorbed
overhead, etc.
Cost
units are valued at their marginal
cost only (not their
fully absorbed cost). In other
words the
cost
of a cost unit is presented as
the total of direct materials, direct
labor, direct expenses
and
variable
overheads (but not fixed
overheads).
Of
course, this does not
mean that we can simply
ignore fixed overheads It is simply
that we
choose
to treat all fixed overheads as period
costs, rather than trying to
attribute them to
individual
cost
units You will find that
this presentation of cost information
has distinct advantages
over-
absorption
costing when it comes to decision
making.
A
key concept in marginal costing is that of
contribution margin.
Contribution
Margin is defined as
the sales value of a cost
unit minus its variable
cost.
Absorption
and marginal
costing
167

Cost
& Management Accounting
(MGT-402)
VU
In
absorption
costing, fixed
manufacturing overheads are
absorbed into cost units.
Thus stock is
valued
at absorption cost and fixed
manufacturing overheads are
charged in the profit and
loss
account
of the period in which the
units are sold.
In
marginal
costing,
fixed manufacturing overheads
are not absorbed into
cost units, Stock is
valued
at marginal (or variable) cost and
fixed manufacturing overheads
are treated as period
costs
and
are charged in the profit
and loss account of the
period in which the overheads
are incurred.
Practice
Question
A
Company produces a single
product and has the
following budget:
Company
Budget Cost Per
Unit
Rs.
Selling
price
10
Direct
materials
3
Direct
wages
2
Variable
overhead
1
Fixed
production overhead is Rs.
10,000 per month; production
volume is 5,000 units per
month.
Calculate
the cost per unit to be
used for stock valuation
under:
(a)
Absorption costing
(b)
Marginal costing.
Solution
(a)
Absorption cost per
unit
Rs
Direct
materials
3
Direct
wages
2
Variable
overhead
1
Absorbed
fixed overhead
Rs
10,000
2
5000
units
Cost
per Unit
8
(b)
Marginal
cost per unit
Direct
materials
3
Direct
wages
2
Variable
overhead
1
Cost
per Unit
6
The
stock valuation will be different
for marginal and absorption costing.
Under absorption
costing
stock will include variable
and fixed overheads whereas
under marginal costing stock will
only
include variable
overheads.
Further
practice question explaining the concept
of product cost, period cost
and cost per
unit
under
two product costing
systems:
168
Cost
& Management Accounting
(MGT-402)
VU
Absorption
Costing
Marginal
Costing
100
units
100
units
Direct
Material
8,000
8,000
Rs.
80 per unit
5,000
5,000
Direct
Labor
Rs.
50 per unit
3,000
3,000
Factory
Overhead
2,000
Variable
FOH
Fixed
FOH
18,000
16,000
Product
Cost
2,000
Fixed
Cost
(Period
Expenses)
Cost
per Unit
Under
Absorption costing
18,000
Rs.
180 per unit
100
Under
Marginal costing
16,000
Rs.
160 per unit
100
Contribution
Margin
Contribution
margin is the difference
between sales and the
variable cost of
sales.
This
can be written as:
Contribution
margin = Sales less
variable
costs of sales
Contribution
margin is short for
"contribution to fixed costs
and profits".
The
idea is that after deducting
the variable costs from
sales, the figure remaining is
the amount
that
contributes to fixed costs,
and once fixed costs
are covered the remaining
amount is that of
profits.
Contribution
and profit
Marginal
costing values goods at variable
cost of production (or marginal cost)
and contribution
can
be shown as follows;
Marginal
costing: Profit calculation
Rs
X
Sales
(X)
Less:
variable costs
X
Contribution
margin
(X)
Less:
fixed costs
X
Profit
Profit
is contribution less
fixed
costs. In absorption costing this is
effectively calculated in one
stage
as the cost of sales already
includes fixed costs
169
Cost
& Management Accounting
(MGT-402)
VU
Absorption
costing: profit calculation
Rs
Sales
X
Less:
absorption cost
(X)
Profit
X
Profit
statements under absorption
and marginal costing
To
produce financial statements in
accordance with IFRS 2,
absorption costing must be used,
but
either
marginal or absorption costing can be
useful for internal
management reporting the
choice
made
will affect:
·
The way
in
which profit information is
presented
·
The level of reported profit if
sales do not exactly equal
production (i.e. stock is increasing
or
decreasing).
PRACTICE
QUESTION
This
example continues with the
Company from the above
practice question.
Show
profit statements for the
month if sales are 4,800
units and production is
5,000 units under
(a)
Total absorption costing
(b)
Marginal costing.
Solution
(a)
Profit statement under absorption
casting
Rs.
Rs
Sales
(4,800 @ Rs10)
48,000
Less:
Cost
of sates
Opening
stock
Production
(5,000
@ Rs. 8)
40,000
Less:
Closing stock
(200 @ Rs. 8)
(1,600)
(38.400)
Operating
profit
9,600
(b)
Profit statement under marginal
costing
Sales
(4.800 @ Rs10)
48,000
Less:
Cost
of sates
Opening
stock
Production
(5,000 @ Rs6)
30,000
Less:
Closing stock (200 @ Rs6)
(1,200)
(28,800)
Contribution
19,200
Less:
Fixed overheads
10,000
Operating
profit
9,200
170
Cost
& Management Accounting
(MGT-402)
VU
PRACTICE
QUESTION
Absorption
Costing
Marginal
100
units
Costing
100
units
Direct
Material
8,000
8,000
Rs.
80 per unit
Direct
Labor
5,000
5,000
Rs.
50 per unit
Factory
Overhead
Variable
FOH
3,000
3,000
Fixed
FOH
2,000
Product
Cost
18,000
16,000
Fixed
Cost
(Period
Expenses)
2,000
Cost
per Unit
Under
Absorption costing
18,000
Rs.
180 per unit
100
Under
Marginal costing
16,000
Rs.
160 per unit
100
Prepare
income statements under absorption
and marginal costing systems assuming
the following
facts:
a)
All
produced units Sold
b)
No.
of units sold
80
No.
of units in closing stock
20
No.
of units produced
100
c)
No.
of units sold
110
No.
of units in opening stock
10
No.
of units produced
100
171

Cost
& Management Accounting
(MGT-402)
VU
Selling
price Rs. 240 per
unit
Solution
a)
All
Units Sold
Absorption
Marginal
costing
costing
Sales
(110 x 240)
24,000
24,000
Less
Product cost
100
x 180
18,000
100
x 160
16,000
Gross
profit
6,000
Contribution
margin
8,000
Less
Fixed cost
0
(2000)
Profit
6,000
6,000
b)
80
units sold & 20 units in closing
stock
Absorption
costing
Marginal
costing
Sales
80 x 240
19,200
19,200
Production
cost
100
x 180 =
18,000
100
x 160 =
16,000
Less
closing stock
20
x 180 =
(3600)
20
x 160 =
(3,200)
14,600
12,800
Less
Fixed cost
2,000
Contribution
Margin
4,600
Profit
4,600
4,400
c)
110
units sold
Absorption
costing
Marginal
costing
Sales
110 x 240
26,400
26,400
Opening
stock
10
x 180 =
1,800
10
x 160 =
1,600
Production
cost
100
x 180 =
18,000
100
x 160 =
16,000
19,800
17,600
Less
Fixed cost
2,000
Contribution
Margin
6,600
Profit
6,600
6,800
Reconciliation
of the difference in profit
The
difference in profit is due to there
being a movement in stock levels - an
increase from 0 to
200
units over the
month.
172
Cost
& Management Accounting
(MGT-402)
VU
Under
absorption costing closing stock has been
valued at Rs 1,600 (i.e. Rs 8 per
unit which
includes
Rs 2 of absorbed fixed overheads).
Under marginal costing the increase in
stock is valued
at
Rs 1,200 (i.e. at Rs 6 per
unit) and all fixed
overheads are charged to the
profit and loss
account.
Only
if stock is rising or falling will
absorption costing give a different
profit figure from
marginal
costing.
If sales equal production,
the fixed overheads absorbed
into cost of sales under
absorption
costing
will be the same as the
period costs charged under marginal
costing and thus the
profit
figure
will be the same.
The
two profit figures can
therefore be reconciled as
follows:
Rs
Absorption
costing profit
9,600
Less:
fixed costs included in the
increase in stock (200 x
Rs2)
(400)
Marginal
costing profit
9,200
If
stock levels are rising from
opening to closing balance
Absorption
Costing profit > Margin Costing
profit
If
stock levels are falling
from opening to closing
balance
Absorption
Costing profit < Margin Costing
profit
(Fixed
costs carried forward are
charged in this period, under
absorption costing)
If
stock levels are the
same
Absorption
Costing profit = Margin Costing
profit
Absorption
Costing Marginal
Costing
Produced
units = Units
Same
Profit
Same
Profit
sold
Produced
units > Units
More
Profit
Less
Profit
sold
Produced
units < Units
Less
Profit
More
Profit
sold
Reconciliation
of the above practice question
b)
80
units sold & 20 units in closing
stock
Rs
Absorption
Profit
4,800
Less
Closing Stock @ Fixed FOH Rate
20
x
20
(400)
Marginal
Costing Profit
4,400
c)
110
units sold with an opening stock of 10
units
Absorption
Profit
6,600
Add
Opening Stock @ Fixed FOH
Rate
10
x
20
200
Marginal
Costing Profit
6,800
173

Cost
& Management Accounting
(MGT-402)
VU
Reconciliation
formula to learn
Rs
Profit
as per absorption costing
system
xxx
Add
Opening stock @ fixed FOH rate at opening
date
xxx
Less
Closing stock @ fixed FOH rate at closing
date
xxx
Profit
as per marginal costing system
xxx
Advantages
of marginal costing
(Relative
to the absorption
costing)
Preparation
of routine operating statements using
absorption costing is considered less
informative
for
the following
reasons:
1.
Profit per unit is a
misleading figure: in the
example above the operating
margin of Rs2 per
unit
arises because fixed
overhead per unit is based
on output of 5,000 units. If
another basis
were
used margin per unit
would differ even though
fixed overhead was the
same amount in
total
2.
Build-up or run-down of stocks of
finished goods can distort
comparison of period operating
statements
and obscure the effect of
increasing or decreasing
sales.
3.
Comparison between products can be
misleading because of the
effect of arbitrary
apportionment
of fixed costs. Where two or
more products are
manufactured in a factory
and
share
all production facilities, the
fixed overhead can only be
apportioned on an arbitrary
basis.
4.
Marginal costing emphasizes variable
costs per unit and
fixed costs in total whereas
absorption
costing
accounts for all production
costs to calculate unit
cost. Marginal costing
therefore
reflects
the behavior of costs in
relation to activity. Since
most decision-making problems
involve
changes to activity, marginal costing is
more appropriate for short-run
decision-making
than
absorption costing.
PRACTICE
QUESTION
This
practice question illustrates the
misleading effect on profit
which absorption costing can
have.
A
company sells a product for
Rs10. and incurs Rs4 of
variable costs in its manufacture.
The fixed
costs
are Rs900 per year
and are absorbed on the
basis of the normal
production volume of
250
units
per year. The results for
the last four years,
when no expenditure variances
arose- were as
follows:
2nd year
3rd year
4th
year Total
Item
1st
year
units
units
units
units
Opening
stock
200
300
300
Production
300
250
200
200
950
300
450
500
500
950
Closing
stock
200
300
300
200
200
Sales
100
150
200
300
750
Rs
Rs
Rs
Rs
Rs
Sales
value
1,000
1,500
2,000
3,000
7,500
Prepare
a profit statement under absorption
and marginal costing.
174
Cost
& Management Accounting
(MGT-402)
VU
Solution
The
profit statement under absorption costing
would be as follows:
1st year
2nd year
3rd year
4th year
Items
Total
Rs.
Rs.
Rs.
Rs.
Rs.
Opening
stock @ Rs7.60
1,520
2,280
2,280
Variable
costs
of
1,200
1,000
800
800
3,800
production
@ Rs4
Fixed
costs ® 900/250
1,080
900
720
720
3,420
=Rs3.60
2,280
3,420
3,800
3,800
7,220
Closing
stock @Rs7.60
1,520
2,280
2,280
1,520
1,520
Cost
of sales
(760)
(1,140)
(1,520)
(2,280)
(5,700)
(Under)/over
absorption
180
Nil
(180)
(180)
(180)
(w)
Net
Profit
420
360
300
540
1,620
Working:
Calculation
of over / under
absorption
Fixed
cost control account
Incurred
Year 1
900
Absorbed
1,080
300
x Rs. 3.60
Over
absorption
180
1,080
1,080
Year
2
900
250
x Rs. 3.60
Year
3
900
200
x Rs. 3.60
720
Under
absorption
180
900
900
Year
4
900
200
x 3.60
720
Under
absorption
180
900
900
175

Cost
& Management Accounting
(MGT-402)
VU
If
marginal costing had been used
instead of absorption, the results
would have
been
shown as
follows:
Item
1st
year
2nd
year
3rd
year
4th
year
Total
Rs
Rs
Rs
Rs
Rs
Sales
1,000
1,500
2,000
3,000
7,500
Variable
cost of sales
(@
Rs4)
400
600
800
1,200
3,000
Contribution
margin 600
900
1,200
1,800
4,500
Fixed
costs
900
900
900
900
3,600
Net
profit/ (loss)
(300)
-
300
900
900
The
marginal presentation indicates clearly that
the business must sell at
least 150 units per
year to
break
even, i.e. Rs900 + (10 -
4), whereas it appeared, using
absorption costing, that even at
100
units
it was making a healthy
profit.
The
total profit for the
four years is less under
the marginal principle because
the closing stocks at
the
end of the fourth year
are valued at Rs800 (Rs4 x
200) instead of Rs 1,520,
i.e. Rs720 of the
fixed
costs are being carried
forward under the absorption
principle.
The
profit figures shown may be reconciled as
follows:
Year
1
Year
2
Yea
3
Yea
r4
Total
Rs
Rs
Rs
Rs
Rs
Profit
/ (loss)
Under
marginal costing
(300)
Nil
300
900
900
Add:
Fixed overheads
Absorbed
in stock increase
200
x Rs3.60 =
720
100
x Rs3.60=
360
200
x Rs3.60=
720
Less:
Fixed overheads
Absorbed
in stock decrease
100
x 3.60=
(360)
Profit
per absorption
420
360
300
540
1,620
Problem
Questions
Q.1.
A
factory manufactures three components X,
Y and Z and the budgeted
production for the
year
is 1,000 units1,500 units and
2,000 units respectively. Fixed overhead
amounts to Rs6.750
and
has
been apportioned on the
basis of budgeted units: Rs
1,500 to X, Rs 2,250 to Y and Rs
3,000 to
Z.
Sales and variable costs
are as follows:
X
Y
Z
Selling
price Rs.
4
6
5
Variable
cost Rs.
1
4
4
Q.
2. A
company that manufactures one product
has calculated its cost on a
quarterly production
budget
of 10.000 units. The selling
price was Rs 5 per unit.
Sales in the four successive
quarters of
the
last year were as
follows:
Quarter
1
10,000
units
Quarter
2
9,000
units
Quarter
3
7,000
units
176

Cost
& Management Accounting
(MGT-402)
VU
Quarter
4
5,500
units
The
level of stock at the beginning of the
year was 1,000 units
and the company maintained
its
stock
of finished products at the
same level at the end of
each of the four
quarters.
Based
on its quarterly production budget, the
cost per unit was as
follows:
Cost
per unit
Rs.
Prime
cost
3.50
Production
overhead
0.75
Selling
and administration
overhead
0.30
Total
4.55
Fixed
production overhead, which
has been taken into account
in calculating the above figures,
was
Rs 5,000 per quarter.
Selling and administration
overhead was treated as
fixed, and was
charged
against sales in the period in
which it was
incurred.
You
are required to present a tabular
statement to bring out the
effect on net profit of
the
declining
volume of sales over the
four quarters given, assuming in
respect of fixed
production
overhead
that the company:
(a)
Absorbs it at the budgeted rate
per unit
(b)
Does not absorb it into
the product cost, but
charges it against sales in
each quarter (i.e.
the
company
uses marginal costing).
Advantages
of Absorption Costing
(Relative
to marginal costing)
Absorption
costing is widely used and
you must understand both
principles.
The
only difference between using
absorption costing and marginal costing as
the basis of stock
valuation
is the treatment of fixed
production costs.
The
arguments used in favor of absorption
costing are as follows:
1.
Fixed costs are incurred
within the production
function, and without those
facilities
production
would not be possible. Consequently such
costs can be related to
production
and
should be included in stock
valuation.
2.
Absorption costing follows the
matching concept by carrying forward a
proportion of the
production
cost in the stock valuation to be matched
against the sales
value
3.
When the items are
sold.
4.
It is necessary to include fixed
overhead in stock values for
financial statements
routine
cost
accounting using absorption costing
produces stock values which
include a share of
fixed
overhead.
5.
Overhead allotment is the
only practicable way of obtaining
job costs for estimating
prices
and
profit analysis.
6.
Analysis of under-/over-absorbed overhead is
useful to identify inefficient
utilization of
production
resources.
Arguments
against absorption
costing
The
fixed costs do not change as
a result of a change in the
level of activity. Therefore such
costs
cannot
be related to production and
should not be included in
the stock valuation.
The
inclusion of fixed costs in
the stock valuation conflicts
with the prudence concept,
therefore
the
fixed costs should be
written off in the period in
which they are
incurred.
177
Cost
& Management Accounting
(MGT-402)
VU
PRACTICE
QUESTION
Following
information relates to a manufacturing
company
Selling
price
Rs.
20 per unit
Units
produced
30,000
Units
sold
20,000
Variable
cost
Direct
material
Rs.
5 per unit
Direct
labor
Rs.
3 per unit
F.O.H
Rs.
1 per unit
Selling
& administrative expenses
Rs.
2 per unit
Fixed
cost
F.O.H
Rs
120,000
Selling
& administrative expenses
Rs.
15,000
Solution
Working
for cost per unit
under
Absorption
Costing
Fixed
FOH Rate
120,000/30,000
=
4
Variable
FOH Rate
Direct
Material
5
Direct
Labor
3
FOH
1
9
13
Marginal
Costing
Variable
FOH Rate
Direct
Material
5
Direct
Labor
3
FOH
1
9
Income
Statement under Absorption Costing
System
Rupees
Sales
(20,000 x 20)
400,000
Less
Cost of goods sold
Opening
stock
0
Add
Production cost
(13
x 30,000)
390,000
Less
Closing stock
(13
x 10,000)
130,000
260,000
Gross
Profit
140,000
Less
Operating expenses
Selling
& Administrative expenses
Variable
expenses
(20,000
x 2) =
40,000
Fixed
expenses
15,000
55,000
Net
profit
85,000
178
Cost
& Management Accounting
(MGT-402)
VU
Income
Statement under Marginal Costing
System
Rupees
Sales
400,000
Less
Variable cost of goods sold
Opening
stock
0
Add
Variable production cost
(9
x 30,000)
270,000
Less
Closing stock
(9
x 10,000)
90,000
180,000
Gross
contribution margin
220,000
Less
Variable Selling & Admin
Expenses
(2
x 20,000)
40,000
Contribution
margin
180,000
Less
Fixed expenses
Production
120,000
Selling
& Admin Expenses
15,000
135,000
Net
Profit
45,000
Reconciliation
Profit
as absorption costing
85,000
Less
Closing stock (10,000 x 4)
40,000
Profit
as per Marginal costing
45,000
Multiple
Choice Questions
Q.1.
When
comparing the profits reported using marginal costing
with those reported using
absorption
costing in a period when closing stock was
1,400 units, opening stock was
2,000 units,
and
the actual production was
11,200 units at a total cost
of Rs 4.50 per unit compared
to a target
cost
of Rs 5.00 per unit, which
of the following statements is
correct?
A
Absorption costing reports profits Rs
2,700 higher
B
Absorption costing reports profits Rs
2,700 lower
C
Absorption costing reports profits Rs
3,000 higher
D
There is insufficient data to
calculate the difference between
the reported profits
Q.
2. When
comparing the profits reported under
marginal and absorption costing during a
period
when
the level of stocks
increased:
A.
An
absorption costing profits will be
higher and closing stock valuations
lower than those
under
marginal
costing
B.
An
absorption costing profits will be
higher and closing stock valuations
higher than those
under
marginal costing
C.
The
marginal costing profits will be higher
and closing stock valuations lower
than those under
absorption
costing
D. The
marginal costing profits will be lower
and closing stock valuations higher
than those under
absorption
costing
Q.
3. Contribution
margin is:
A.
Sales less total
costs
B.
Sales less variable
costs
C.
Variable costs of production less
labor costs
D.
None of the above
179
Cost
& Management Accounting
(MGT-402)
VU
Problem
Question
Rays
Company manufactures and sells electric
blankets.
The
selling price is Rs 12.
Each
blanket has the unit
cost set out
below.
Administration
costs are incurred at the
rate of Rs20 per
annum.
The
company achieved the
production and sales of blankets
set out below.
The
following information is also
relevant:
1.
The overhead costs of Rs2
and Rs3 per unit
have been calculated on the
basis of a budgeted
production
volume of 90 units.
2.
There was no
inflation.
3.
There, was no opening stock.
Unit
cost
Rs.
Direct
material
2
Direct
labor
1
Variable
production overhead
2
Fixed
production overhead
3
8
Year
1
2
3
Production
100
110
90
Sales
90
110
95
You
are required:
(a)
To prepare an operating statement for
each year using
(i)
Marginal costing and (ii)
absorption costing
(b)
To explain why the profit
figures reported under the two techniques
disagree.
180
Cost
& Management Accounting
(MGT-402)
VU
LESSON#
29
COST
VOLUME PROFIT
ANALYSIS
(Contribution
Margin Approach)
This
topic is based on your knowledge of
cost behavior and shows
how this is applied in
a
decision-making
situation. Cost-volume-profit (CVP)
analysis is a technique which
uses cost
behavior
theory to analyze the
activity level as to the
contribution margin and fixed
cost
relationship
and the level at which
there is neither a profit
nor a loss (the break-even
activity level).
This
is important management information
because managers need to
know the minimum
activity
level
that must be achieved in
order that the business
does not incur
losses.
CVP
analysis may also be used to
predict profit levels at different
volumes of activity based
upon
the
assumption that costs and
revenues exhibit a linear relationship
with the level of
activity.
Cost-volume-profit
analysis determines how
costs and profit react to a
change in the volume
or
level
of activity, so that management
can decide the 'best'
activity level.
Following
are the assumptions which
are used in CVP
analysis.
1.
Variable costs and selling price (and
hence contribution) per unit
are assumed to be
unaffected
by
a change in activity
level.
2.
Fixed costs, whilst not affected in
total by a change in the
activity level, will change
per unit as
the
activity level changes and
there are more (or
less) units over which to
"share out" the
fixed
costs
If fixed costs per unit
change with the activity
level, then profit per
unit must also
change.
Thus,
cost-volume-profit analysis is always
based on contribution per
unit (assumed to be
constant
unless
a question clearly says otherwise) and
never on profit per unit
because profit per
unit
changes
every time a few more or
less units are
made.
CVP
is a relationship of four
variables
Sales
Volume
Variable
cost
Cost
Fixed
cost
Cost
Net
income
Profit
This
may be understood through
the following equation
Volume
@
sales price
=
Revenue
Cost
matching with the
sales
=
(Cost)
Result
=
Profit
CVP
analysis is a tool for
decision making. There are
two approaches of CVP
analysis:
1.
Contribution margin
approach
2.
Break even analysis
approach
Contribution
Margin Approach & CVP
Analysis
Contribution
margin contributes to meet
the fixed cost. Once
the fixed cost has
been met the
incremental
contribution margin is the
profit.
Income
Statement as per the marginal costing
system is used as a Standard
format of Income
Statement
to analyze the Cost-Volume-Profit
relationship.
Rs.
181
Cost
& Management Accounting
(MGT-402)
VU
Sales
xxx
Variable
Cost
xxx
Contribution
Margin
xxx
Fixed
Cost
xxx
Profit
xxx
PRACTICE
QUESTION
Basic
question
90
units of product "PR" is sold
for Rs. 100 per
unit. Variable cost relating to
production and
selling
is Rs. 75 per unit and
fixed cost is Rs.
2,250.
Q.
1. Management
decides to increase its sales by 10
units.
Required:
Prepare
income statement and analyze.
Solution
Rs.
Rs.
Rs.
Sales
(90 x 100)
9,000
(10 x 100)
1,000
10,000
Variable
cost (90 x 75)
(6,750)
(10 x 75)
(750)
(7,500)
Contribution
margin
2,250
250
2,500
Fixed
cost
(2,250)
0
2,250
Profit
/ Loss
0
250
250
Analysis
This
shows physical increase in volume
causes an increase in contribution
margin and if there
is
not
increase in the fixed cost
because of such change, the
incremental contribution margin is
added
in
the final profits.
Q.
2. Management
decides to increase its sales
price by 10%. Continue with
the Q. 1.
Required:
Prepare
income statement and analyze.
Solution
Sales
100
x Rs 110
11,000
Variable
cost 100 x Rs. 75
(7,500)
Contribution
margin
3,500
Fixed
cost
(2,250)
Profit
1,250
Analysis
This
shows increase in sales
price per unit causes an
increase in the contribution margin, as
there is
not
change in the volume the
fixed will remain unchanged. So the
incremental change is
contribution
margin is included into the
profit.
Q.
3. Management
decides to decrease its sales
price by 10%. Continue with
the Q. 1.
Required:
Prepare
income statement and analyze.
Sales
100
x Rs 90
9,000
Variable
cost 100 x Rs 75
(7,500)
Contribution
margin
1,500
182
Cost
& Management Accounting
(MGT-402)
VU
Fixed
cost
(2,250)
Loss
(750)
Analysis
This
shows decrease in sales
price per unit causes a
decrease in the contribution margin, as
there is
not
change in the volume the
fixed will remain unchanged. So the
change in contribution margin
is
subtracted
from the profits, which
result into a loss of Rs.
750 in this case.
Normally
a decrease in sales price
should case an increase in
the sales volume.
Q.4.
Management
decides to decrease its sales
price by 10% and expects an
increase in sales
volume
by 50%. Continue with the Q.
1.
Required:
Prepare
income statement and analyse.
Solution
Sales
150
x Rs 90
13,500
Variable
cost 150 x Rs 75
(11,250)
Contribution
margin
2,250
Fixed
cost
(2,250)
Loss
0
Analysis
This
shows decrease in sales
price per unit causes a
decrease of Rs. 1,000 in the
contribution
margin,
as well as an increase in volume is
causing an increase in the
profit, this results in an
increase
in profit.
Here
in this scenario the
increase in the volume must
be more than 50% to earn
profits.
Q.5.
Management
decides to decrease its sales
price by 10% and expects an
increase in sales
volume
by 200%. Continue with the
Q. 1.
Required:
Prepare
income statement and analyse.
Solution
Sales
200
x Rs 90
18,000
Variable
cost 200 x Rs 75
(15,000)
Contribution
margin
3,000
Fixed
cost
(2,250)
Profit
750
Analysis
This
shows decrease in sales
price per unit causes a
decrease of Rs. 1,000 in the
contribution
margin,
as well as an increase in volume is
causing an increase in the
profit, this results in an
increase
in profit.
Here
in this scenario the
increase in the volume must
be more than 50% to earn
profits.
Q.6.
Management
decides to increase its sales
volume by 100% and it is
also assumed that
the
fixed
cost also increase upto
Rs. 2,500. Continue with
the Q. 5.
Required:
Prepare
income statement and analyse.
Solution
Sales
200
x Rs 90
18,000
Variable
cost 200 x Rs 75
(15,000)
Contribution
margin
3,000
Fixed
cost
(2,500)
Profit
500
Analysis
183

Cost
& Management Accounting
(MGT-402)
VU
This
shows a decrease in fixed
cost causes a decrease in
the profits.
Q.7.
Management
decides to increase its sales
volume by 100% and it is
also assumed that
the
fixed
cost also increase upto
Rs. 2,500, and also there is
an increase of 20% in the
variable cost.
Continue
with the Q. 6.
Required:
Prepare
income statement and analyse.
Solution
Sales
200
x Rs 90
18,000
Variable
cost 200 x Rs 90
(18,000)
Contribution
margin
0
Fixed
cost
(2,500)
Loss
(2,500)
Sales
***
Variable
cost
(***)
Contribution
margin
***
Fixed
cost
(***)
Profit
/ Loss
***
This
lesson ends up at following
lessons:
1.
At zero contribution margin
the loss will be equal to
the fixed cost
2.
Increase in variable cost
reduces the contribution
margin
3.
Sales Variable cost = Contribution
margin
4.
Contribution margin + Variable cost =
Sales
5.
Contribution margin Fixed cost =
Profit
6.
Profit + Fixed cost = Contribution
margin
7.
Sales - Variable cost = Fixed cost +
Profit
184

Cost
& Management Accounting
(MGT-402)
VU
LESSON#
30
COST
VOLUME PROFIT
ANALYSIS
(Break-even
Approach)
Break-even
Cost-volume-profit
analysis can be used to
calculate break-even.
Break-even
is the point where sales revenue
equals total cost, i.e.
(here is neither a profit
nor a loss.
Profit
(or loss) is the difference
between contribution margin
and fixed costs.
Thus
the break-even point occurs where
contribution margin equals
fixed costs
Target
Contribution Margin
Target
contribution margin is the
amount which if equal to
fixed cost will give
nil net profit,
whereas,
if we need to earn a target
profit, such profit will be
added up into the fixed
cost to have
target
contribution margin.
Contribution
margin per unit can be
assumed to be constant for
all levels of output in the
relevant
range.
Similarly, fixed costs can
be assumed to be a constant amount in
total.
The
relationships may be depicted
thus:
Contribution
Margin per unit
Selling
price per unit less
variable
costs per unit
Total
contribution
Volume
x (Selling price per unit
less
variable
costs per unit)
Target
Contribution Margin
Fixed
costs + Profit target
Target
Sales in number of units
Target
Contribution Margin
Unit
contribution
Contribution
may be calculated in total, or on a
per-unit basis using selling prices
and variable costs
per
unit.
The
difference between contribution and
fixed costs is profit (or
loss); thus when
contribution
equals
fixed costs, break-even occurs. In
this way a target profit may
be converted into a
target
contribution
margin which may be used to
calculate the number of
units required to achieve
the
desired
target profit.
Contribution
margin to sales
ratio
Contribution
to sales ratio (C/S ratio)
=
Contribution
Margin in Rs
Sales
in Rs
Note:
you may encounter the
term profit to volume (or
P/V) ratio, which is
synonymous with the
contribution
to sales ratio. Profit to
volume is an inaccurate description,
however, and should
not
be
used. The C/S ratio is
conveniently written as a
percentage.
Break
even point refers to the
volume (sales) at which the
entity earns no profit and
suffers no
loss.
It
is the point where
Contribution
margin = Fixed cost
And
Target
profit = 0
Contribution
margin Fixed cost = 0
Profit
Contribution
margin = Fixed cost + 0
Profit
At
break even point the
target contribution is equal to
the fixed cost
Contribution
Margin Fixed cost =
Profit
185
Cost
& Management Accounting
(MGT-402)
VU
Contribution
margin = Fixed cost +
Profit
Practice
Question
Q.
1
Income
Statement
Rs.
Sales
700
units x Rs 8
5,600
Variable
cost 700 units x Rs 6
4,200
Contribution
margin
1,400
Fixed
cost
1,000
Profit
400
Variable
cost over sales
4,200
x 100 = 75%
5,600
Contribution
margin over sales
1,400
x 100 = 25%
5,600
Per
Unit Calculation
Sales
price
Rs
8
Less
Variable cost
(6)
Contribution
Margin
2
6
/ 8 x 100 = 75%
2
/ 8 x 100 = 25%
Total
per
unit
%
Sales
700
units x Rs 8
5,600
8
100%
Variable
cost 700 units x Rs 6
4,200
6
75%
Contribution
margin
1,400
2
25%
Fixed
cost
1,000
Profit
400
Break
even sales in
Rupees
Remember
the formula to calculate required
amount in absence of certain
information:
Given
Amount x
%
of required amount =
Required
Amount
%
of given amount
Here,
to calculate break even
sale, we need contribution
margin to be equal to the
fixed cost so
that
the profit is zero.
Now
if the target contribution
margin is equal to Rs. 1,000
then what would be the
sales at this
point?
Now
the above formula will be
applied to calculate breakeven
sales:
Target
CM is the given amount and its % is
25, so the sale which is
100% will be:
Rs
1,000 x
100
= Rs 4,000
25
OR
186
Cost
& Management Accounting
(MGT-402)
VU
Rs
1,000 x 1 =
Rs.
4,000
25
OR
Rs
1,000 =
Rs.
4,000
25
So,
Break
even Sales in Rs. =
Fixed
cost
C/S
ratio
Check
Income
Statement
Rs.
Sales
500
units x Rs 8
4,000
Variable
cost 500 units x Rs 6
3,000
Contribution
margin
1,000
Fixed
cost
1,000
Profit
0
Break
even sales in units
Simple
formula:
Break
even sales in Rupees =
number of units
Sales
price per unit
4,000
= 500 units
8
Direct
formula
Target
CM
CM
per unit
Here
the target contribution
margin is equal to the
fixed
Fixed
Cost
CM
per unit
Rs.
1,000
=
500 units
2
Break
even sales in Rupees
=
Target
CM
Contribution
to sales ratio
Break
even sales in units=
Target
CM
Contribution
margin per unit
Q.
2
Calculate
Sales to target profit of
Rs. 500, using the
information given in practice question
no. 1.
Sales
***
Variable
cost
(***)
Contribution
margin
***
Fixed
cost
1,000
Profit
500.
187
Cost
& Management Accounting
(MGT-402)
VU
Target
contribution margin = Fixed cost +
Target profit
=
1,000
+
500
=
1,500
Sales
to earn target profit of Rs.
500
=
Rs 1,500 x 100 = Rs.
6,000
25
=
Rs
1,500 = Rs. 6,000
0.25
Check
Income
Statement
Rs.
Sales
6,000
Less
Variable cost
4,500
Contribution
Margin
1,500
Less
Fixed cost
1,000
Profit
500
Fixed
cost + Target profit
Contribution
to sales ratio
Problem
Question
A
company sold fans at Rs 2,000 each.
Variable cost Rs. 1,200 each
and fixed cost Rs.
610,000.
Calculate:
a.
Calculate break even sales
in Rupees.
b.
Break even sales in
units.
c.
Sales in units to earn a
profit of Rs. 20,000.
Multiple
Choice Questions
The
following details relate to a shop
which currently sells 25,000
pairs of shoes
annually.
Selling
price per pair of
shoes
Rs.40
Purchase
cost per pair of
shoes
Rs.25
Total
annual fixed costs
Rs.
Salaries
100,000
Advertising
40,000
Other
fixed expenses
100,000
Q.
1
What
is the contribution per pair
of shoes?
A
Rs.15
B
Rs.30
C
Rs.7.50
D
Rs.18
Q.
2
What
is the break-even number of
pairs of shoes?
A
14,000
B
16,000
C
28,000
D
32,000
188
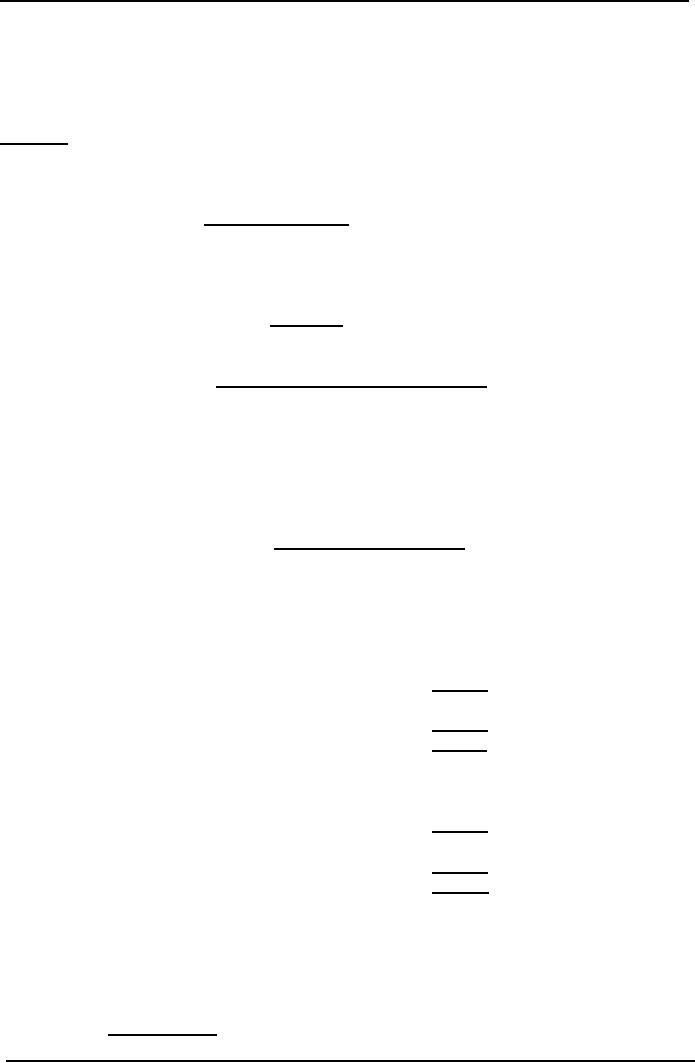
Cost
& Management Accounting
(MGT-402)
VU
LESSON#
31
BREAK
EVEN ANALYSIS MARGIN OF
SAFETY
A
company sold fans at Rs 2,000 each.
Variable cost Rs. 1200 each
and fixed cost Rs.
60,000.
Calculate:
a.
Calculate break even sales
in Rupees.
b.
Break even sales in
units.
c.
Sales in units to earn a
profit of Rs. 20,000.
Contribution
to sales ratio = Contribution
margin
Sales
=
800 / 2,000 = 0.4
a)
Break-even sales in Rupees
=
Fixed
cost
C/S
Ratio
=
60,000 / 0.4 = Rs.
150,000
b)
Break-even sales in units
=
Fixed
cost
Contribution
margin per unit
=
60,000 / 800 = 75
units
c)
Target profit Rs
20,000
Target
contribution = Target profit + Fixed
cost
=
Target
contribution margin
Contribution
margin per unit
=
80,000 / 800 = 1,000
units
Check
Break even sales
Sales
75 x 2,000
150,000
Less
Variable cost (150,000 x 60%)
90,000
Contribution
margin
60,000
Less
Fixed cost
60,000
Profit
0
Check
Target Profit
Sales
100 x 2,000
200,000
Less
Variable cost (200,000 x 60%)
90,000
Contribution
margin
80,000
Less
Fixed cost
60,000
Profit
20,000
Margin
of Safety (MOS)
The
margin of safety is the difference
between budgeted sales
volume and break-even
sales
volume;
it indicates the vulnerability of a
business to a fall in demand. It is
often expressed as a
percentage
of budgeted sales
Budgeted
sales Break-even sales =
Margin of safety
MOS
ratio =
MOS
x 100 = %
Budgeted
Sales
189

Cost
& Management Accounting
(MGT-402)
VU
PRACTICE
QUESTION
Q.
1
Budgeted
Income statement
Rs.
Budgeted
Sales 700 units x Rs
8
5,600
Variable
cost 700 units x Rs 8
4,200
Contribution
margin
1,400
Fixed
cost
1,000
Profit
400
Break
even Sales 500 units x Rs
8
4,000
Variable
cost 500 units x Rs 6
3,000
Contribution
margin
1,000
Fixed
cost
1,000
Profit
0
Percentage
of MOS can be calculated in
different ways:
·
Based
on Budgeted sales
Budgeted
sales Break-even
sales
=
5,600 4,000 =
1,600
Margin
of safety x 100 = %
Budgeted
sales
1,600
x 100 = 28.57%
5,600
·
Using
Budget profit
Budgeted
profit
x
100 = %
Budgeted
contribution margin
400
x 100 = 28.57%
1,400
·
Using
profit and contribution
ratio
Profit
to sales ratio x 100 =
%
Contribution
to sales
Profit
to sales ratio =
400
/ 5,600 x 100 = 7.14%
Contribution
to sales ratio = 1,400 /
5,600 x 100 = 25%
7.14%
x 100 = 28.57%
25%
190

Cost
& Management Accounting
(MGT-402)
VU
Q.
2
Budgeted
Income Statement
Rs.
Budgeted
sales
10,000
Less
variable cost
6,000
Contribution
margin
4,000
Less
Fixed cost
2,500
Profit
1,500
Calculate
Margin of safety
ratio?
Budgeted
profit
x
100 = %
Budgeted
contribution margin
1,500
/ 1,000 x 100 = 37.5%
P/S
Ratio x 100 = %
C/S
Ratio
Profit
/ Sales x 100 = 1,500 /
10,000 x 100 = 15%
Contribution
margin / Sales x 100 = 4,000
/ 10,000 x 100 = 40%
Margin
of safety ratio =
15%
x 100 = 37.5%
40%
Q.
3
Sales
= Rs. 50,000
Margin
of safety = 25%
Calculate
break even sales?
Step
I
Calculate
absolute amount of
MOS
MOS
= 50,000 x 25% = Rs.
12,500
Step
II
Calculate:
Breakeven sales through the
following formula:
MOS
= Budgeted sales - Break
even sales
Budgeted
sales - MOS = Break even
sales
50,000
-12,500 = 37,500
Q.
4
Sales
= Rs. 50,000
MOS
ratio = 25%
Budgeted
profit = Rs. 2,500
a).
Compute projected profit
b).
Prepare Budgeted sales
sheet
Budgeted
sales
50,000
Less
Variable cost
40,000
Contribution
margin
10,000
191
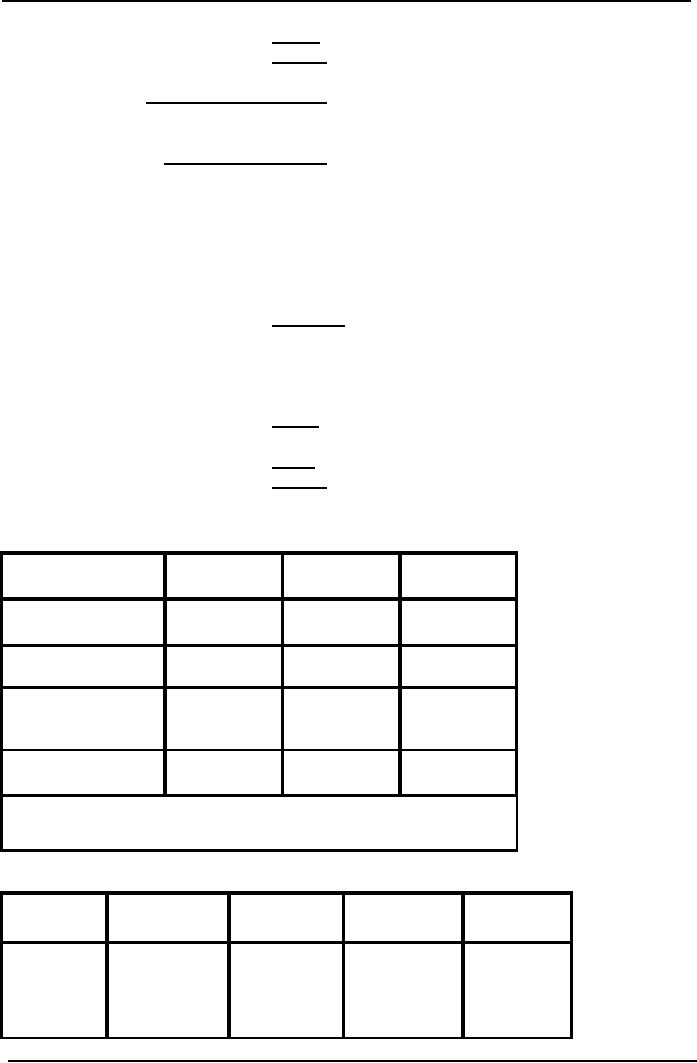
Cost
& Management Accounting
(MGT-402)
VU
Less
Fixed cost
7,500
Profit
2,500
MOS
ratio =
Profit
Contribution
margin
=
2500
Contribution
margin
0.25
contribution margin =
2,500
Contribution
margin = 2,500 / 0.25
Contribution
margin = Rs. 10,000
Break
even sales =
Fixed
cost
C/S
ratio
Budgeted
sales
37,500
Less
variable cost
30,000
Contribution
margin
7,500
Less
Fixed cost
7,500
Profit
0
Q.
4
Combined
Break-even sales
X
Y
Z
Rupees
Rupees
Rupees
Selling
price (P.U)
2.50
4
10
Variable
cost (P.U)
(1.50)
(2)
(4)
Contribution
margin
1
2
6
(P.U)
Sales
Volume
80,000
30,000
15,000
Fixed
cost
Rs.
1,50,000
Solution
X
Y
Z
Total
Rupees
Rupees
Rupees
Rupees
Contribution
(1
x 80,000)
(2
x 30,000)
(6
x 15,000)
2,30,000
margin
=80,000
=
60,000
=
90,000
192
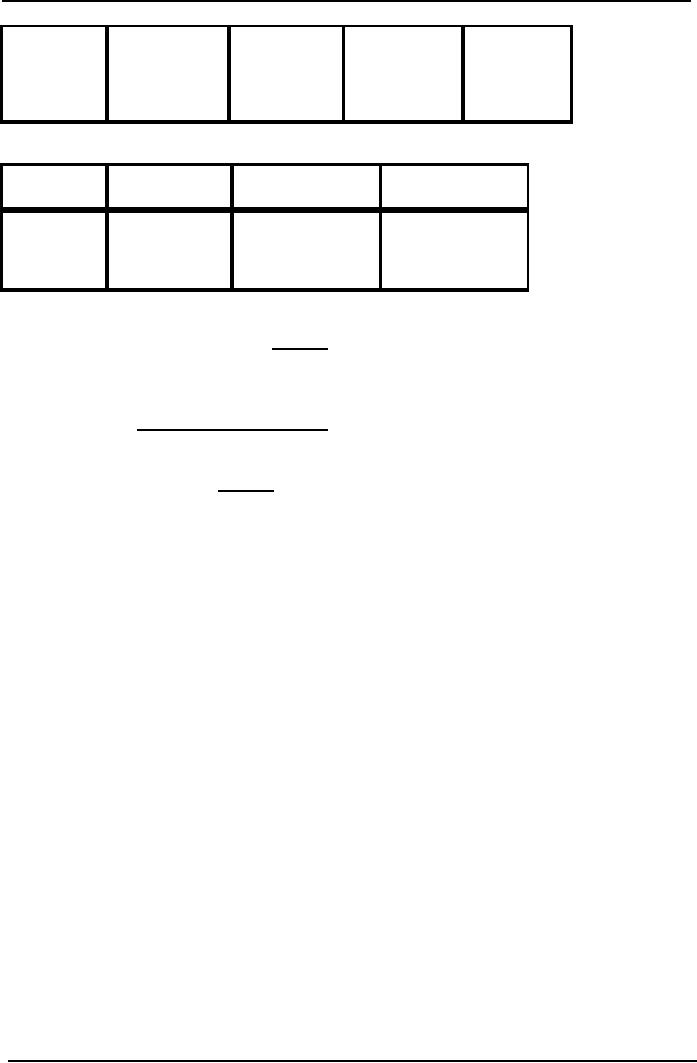
Cost
& Management Accounting
(MGT-402)
VU
Sales
(2.5
x 80,000)
(4
x 30,000)
(10
x 15,000)
4,70,000
=
2,00,000
=
1,20,000
=
1,50,000
Product
wise contribution to sales
ratio
X
Y
Z
Contribution
80,000
/
60,000
/ 1,20,000 x 90,000 / 1,50,000
x
margin
ratio
2,00,000
x 100
100
100
=
40%
=
50%
=
60%
Combined
contribution to sales
ratio
230,000
470,000
=
48.936 or 0.489
Break
even sales = Target
contribution margin
C/S
ratio
=
150,000
0.48936
=
306,523
PRACTICE
QUESTION
Q.
1
Victoria
Company produces a single
product. Last year's income statement is
as follows:
Sales
(29,000 units)
Rs.
1,218,000
Less:
Variable costs:
812,000
Contribution
margin
406,000
Less:
Fixed expenses
300,000
Net
income
106,000
Required:
1.
Compute the break-even point
in units and sales
Rs.
2.
What was the margin of
safety for Victoria last
year?
3.
Suppose that Victoria
Company is considering an investment in
new technology that
will
increase
fixed costs by Rs. 250,000
per year but will
lower variable costs to 45%
of sales.
Units
sold will remain unchanged. Prepare a
budgeted income statement assuming
that
Victoria
makes this investment. What
is the new break-even point
in units and sales
Rs,
assuming
that the investment is
made?
Q.
2
Crown
Star Products produces two
different types of lamps, a
floor lamp and a desk
lamp. Floor
lamps
sell for Rs. 30,
Desk lamps for Rs.
20, the projected income statement for
the coming year
follows:
Sales
Rs.
600,000
Less:
Variable costs;
400,000
Contribution
margin
200,000
193
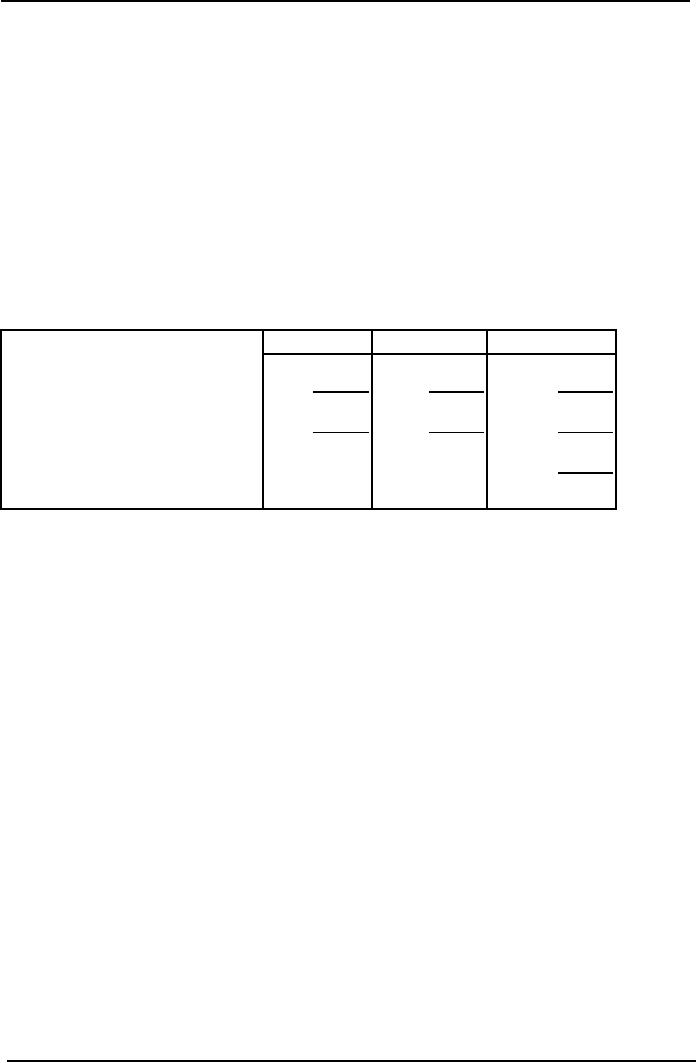
Cost
& Management Accounting
(MGT-402)
VU
Less:
Fixed expenses
150,000
Net
income
50,000
The
owner of Crown Star
estimates that 60% of the
sales revenues will be produced by
floor lamps
with
the remaining 40% by desk
lamps. Floor lamps are
also responsible for 60% of
the variable
expenses.
Of the fixed expenses, one
third is common to both
products, and one-half are
directly
to
the floor lamp product
line.
Required:
1.
Compute the sales revenue
that must be earned for
Crown Star to reach at break
even.
Compute
the number of floor lamps
and desk lamps separately
that must be sold for Crown
Star
to
break even.
Question
No. 3
Unicorn
Enterprises produces two strategy
games, Mystical Wars and
Magical Dragons. The
projected
income for the coming year,
segmented by product line,
follows:
Wars
Dragons
Total
Sales
Rs.
500,000
Rs.
800,000
Rs.
1,300,000
Less:
Variable costs
230,000
460,000
690,000
Contribution
margin
270,000
340,000
10,000
Less:
Direct fixed expenses
120,000
180,000
300,000
Product
margin
150,000
160,000
310,000
Less:
Common fixed expenses
210,000
Operating
income
100,000
The
selling prices are Rs.
10 for
Mystical Wars and Rs.
20 for
Magical Dragons.
Required:
1.
Compute the number of
games of each kind that
must be sold for Unicorn Enterprises
to
reach
its break-even.
2.
Compute the revenue that
must be earned to produce a net income of
10% of sales revenue.
Question
No. 4
Khalid
is a salt merchant who
supplies salt to general merchants in
Lahore city. In the year of
2000
he
sold 35,000 bags of salt.
One bag consists of 50kg
salt. He purchases slat in
raw form and
then
grinds
it, fills it in bags and
then sold it, Sale price
per bag is Rs.
45.
He
purchases the raw salt ®
Rs. 400 per ton (1
ton consist of 1000 kg). Grinding
cost is Rs, 7 per
bag,
carriage outward cost is Rs.
5 per bag, he also purchases
empty bags ® 400 per
100 bags.
Rent
of
shop Rs, 1500 per month.
Electricity and phone
expense is Rs, 16000 per
year (assume fixed).
Depreciation
of plant is Rs. 3,680 per
year.
In
the year 2001 it is expected
that sale price and
demand will remain the same
but all the
variable
costs
will increased by 15%. All
the fixed costs will
also increase by 10%.
Required:
1.
Break even point in units
and Rs. in both
years.
2.
Income statements of both
years.
3.
If he wants to earn Rs. 350,000 in
the year of 2001 how
many bags he has to
sell.
4.
Assume that demand in 2001
will remain the same he wants to
keep same contribution
margin
ratio
as in year 2000 what'-will be
the new selling price per
bag.
194
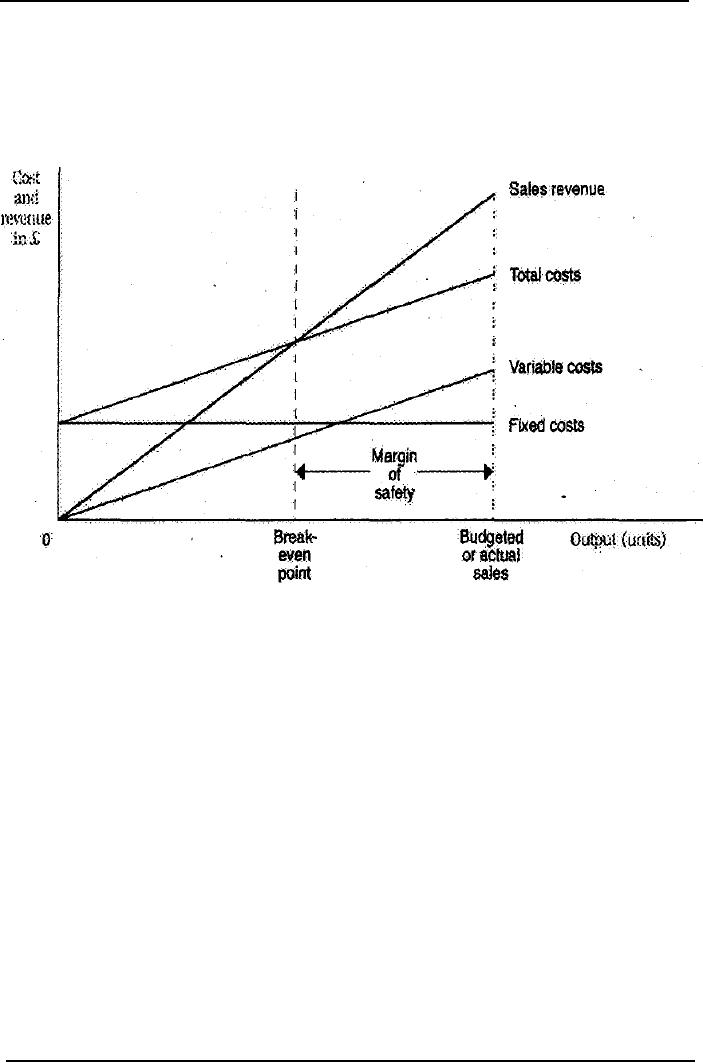
Cost
& Management Accounting
(MGT-402)
VU
LESSON#
32
BREAKEVEN
ANALYSIS CHARTS AND
GRAPHS
The
conventional break-even chart
The
conventional break-even chart
plots total costs and
total revenues at different
output levels
and
shows the activity level at
which break-even is
achieved.
Conventional
break-even chart
The
chart or graph is constructed as
follows:
·
Plot fixed costs, as a
straight line parallel to the
horizontal axis
·
Plot sales revenue and
variable costs from the
origin
·
Total costs represent fixed
plus variable costs.
The
point at which the sales
revenue and total cost lines
intersect indicates the breakeven
level of
output.
The amount of profit or loss
at any given output can be read
off the chart.
By
multiplying the sales volume
by the unit price at the
break-even point the level
of revenue
needed
to break even can be
determined.
The
chart is normally drawn up to
the budgeted sales
volume.
The
difference between the
budgeted sales volume and
break-even sales volume is referred to
as
the
margin of safety.
Usefulness
of charts
The
conventional form of break-even charts
was described above. Many
variations of such charts
exist
to illustrate the main relationships of
costs, volume and
profit.
Unclear
or complex charts should, however, be
avoided, as a chart which is
not easily understood
defeats
its own object.
Generally,
break-even charts are most
useful for the following
purposes:
·
comparing products, time periods or
actual outcomes versus planned
outcomes
·
showing the effect of
changes in circumstances or to
plans
·
giving a broad picture of
events,
195
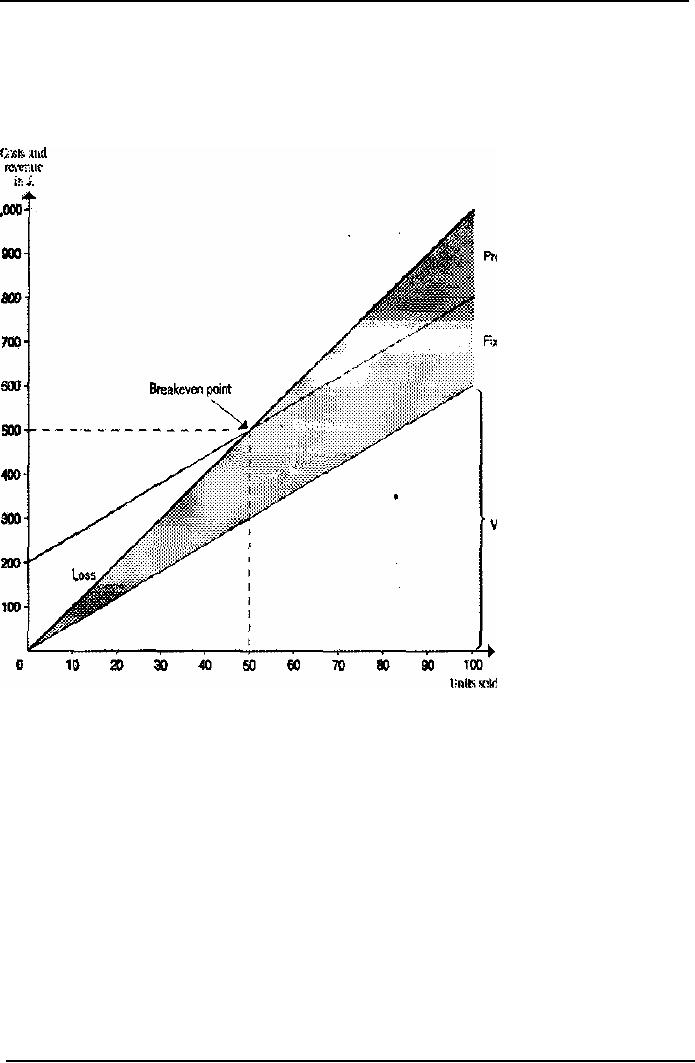
Cost
& Management Accounting
(MGT-402)
VU
Contribution
break-even charts
A
contribution break-even chart is
constructed with the
variable costs at the foot
of the diagram
and
the fixed costs shown
above the variable cost
line.
The
total cost line will be in
the same position as in the
break-even chart illustrated
above; but by
using
the revised layout it is
possible to read off the
figures of contribution at various
volume
levels,
as shown in the following
diagram.
Profit-volume
chart
A
profit-volume chart is a graph which
simply depicts the net
profit and loss at any given
level of
activity.
196
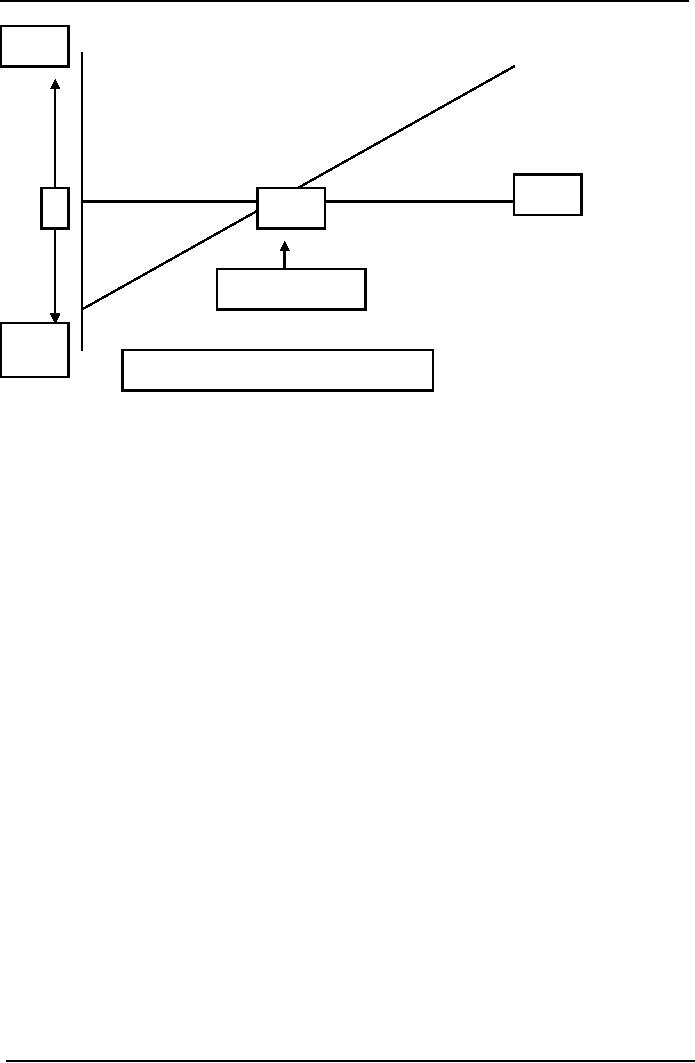
Cost
& Management Accounting
(MGT-402)
VU
Profit
Sales
0
500
Breakeven
Point
Loss
1,000
Loss
= Fixed cost at zero sales
activity
From
the above chart the
amount of net profit or loss
can be read off for any
given level of sales
activity,
unlike a break-even chart
which shows both costs
and revenues over a given
range of
activity
but does not highlight
directly the amounts of
profits or losses at the various
levels.
·
The
points to note in the
construction of a profit-volume chart
are as follows:
·
The
horizontal axis represents
sales (in units or sales
value, as appropriate). This is the same
as
for
a break-even chart.
·
The
vertical axis shows net
profit above the horizontal
sales axis and net
loss below.
·
When
sales are zero, the net
loss equals the fixed
costs and one extreme of the
'profit-volume'
line
is determined. Therefore this is
one-point on the graph or
chart.
·
If
variable cost per unit
and fixed costs in total
are both constant throughout
the relevant range
of
activity under consideration, the
profit-volume chart is,
depicted by a straight line
(as
illustrated
above). Therefore, to draw
that line it is only
necessary to know the profit
(or loss)
at
one level of sales. The
'profit-volume ' line is then
drawn between this point
and the one for
zero
sales, extended as
necessary.
·
If
there are changes in the
variable cost per unit or
total fixed costs at various activities,
it
would
be necessary to calculate the
profit (or loss) at each
point where the cost
structure
changes
and to plot these on the
chart. The 'profit-volume'
line will then be a series
of straight
lines
joining these points
together, as shown in the
simple illustration
below.
197
Cost
& Management Accounting
(MGT-402)
VU
Profit-volume
chart (2)
This
illustration depicts the
situation where the variable
cost per unit increases
after a certain level
of
activity (OA), e.g. because
of overtime premiums that
are incurred when production
(and sales)
exceed
a particular level.
Points
to note:
·
The
profit (OP) at sales level
OA would be determined and
plotted.
·
Similarly
the profit (OQ) at sales
level of OB would be determined and
plotted.
·
The
loss at zero sales activity
(= fixed costs) can be
plotted.
·
The
"profit-volume' line is then
drawn by joining these
points, as illustrated.
As
long as we make the
assumptions that contribution
per unit is constant, and
fixed costs do not
change,
we can draw straight-line
graphs to show profit or
costs and revenues at all
possible
activity
levels.
MULTIPLE
CHOICE QUESTIONS
1.
If
contribution margin is
positive?
(a)
Profit will occur.
(b)
Both a profit and loss
are possible.
(c)
Profit will occur if the
fixed expenses are greater
than the contribution
margin.
(d)
A loss will occur if the
contribution margin is greater
than fixed expenses.
2. At
the breakeven point:
(a)
Profit is Rs. 0.
(b)
. Fixed Cost + Variable Cost =
Safes
(c)
Fixed Cost = Contribution
Margin
(d)
All of the above
198

Cost
& Management Accounting
(MGT-402)
VU
3.
A
completed CVP graph will show
that profit or loss at any
level of sales is measured
by:
(a)
A
vertical line between the
fixed cost line and
the x axis.
(b)
A
horizontal line between the
revenue line and the y
axis.
(c)
A
vertical line between the
total revenue line and the
total expenses line.
(d)
A
horizontal line between the
total revenue line and the
total expenses line.
4.
Contribution
margin ratio is:
(a)
Total
Contribution Margin /
Sales.
(b)
Sales
/ Contribution Margin per
unit,
(c)
Fixed
cost / Contribution margin
per unit.
(d)
Sales
/ Variable costs.
5.
The
impact on net operating income of any given dollar
change in total sales can be
computed
by
applying which ratio to the
dollar change?
(a)
Profit margin.
(b)
Variable cost ratio.
(c)
Contribution Margin.
(d)
Ratio of Variable to Fixed Expenses.
6.
The
Hino Corporation has a
breakeven point when sales
are Rs. 160,000 and
variable costs at
that
level of sales are Rs.
100,000. How much would
contribution margin increase or
decrease, if
variable
expenses dropped by Rs.
20,000?
(a)
37.5%.
(b)
60%.
(c)
12.5%.
(d)
26%
7.
Which
of the following represents
the CVP equation?
(a)
Sales
= Contribution margin + Fixed expenses +
Profits
(b)
Sales
= Contribution margin ratio + Fixed
expenses + Profits
(c)
Sales
= Variable expenses + Fixed expenses +
Profits
(d)
Sales
= Variable expenses - Fixed expenses +
Profits
8.
Margin
of Safety is a term best
described as the excess
of:
(a)
Contribution
margin over fixed
expenses.
(b)
Total
expenses over the breakeven
point.
(c)
Sales
over the breakeven
point.
(d)
Sales
over total costs.
Point
out which of the following statements are
TRUE/FALSE
1.
Cost-volume-profit
(CVP) analysis summarizes the effects of
change on an organization's
volume
of activity on its costs, revenue, and
profit.
2.
The
break-even point is the
volume of activity where an organization's
revenues and expenses
are
equal,
3.
Total
contribution margin can be
calculated by subtracting total
fixed costs from
total
revenues.
4.
Contribution
margin / Sales price per
unit = Contribution margin
ratio.
5.
The
sales price of a single unit
minus the unit's variable
expenses is called the unit
contribution
margin-
199

Cost
& Management Accounting
(MGT-402)
VU
6.
The
contribution-margin ratio of a firm is
determined by dividing the per
unit contribution
margin
by the per unit sales
price.
7.
The
safety margin of an enterprise is the
difference between the budgeted
sales revenue and
the
break-even sales revenue-
8.
A company's
break-even sales revenues
are Rs, 400,000, and its
contribution margin is 40%.
If
fixed
costs increase by Rs.
24,000, breakeven sales will
increase to Rs.
440,000.
9.
If
the total contribution
margin at break-even sales is
Rs, 45,000, then the
fixed costs must
also
be Rs. 45,000,
10.
If a company
sells 50 units of A at Rs. 8
contribution margin and 200
units of B at a Rs. 6
contribution
margin, the weighted-average contribution
margin is Rs. 7.00.
200

Cost
& Management Accounting
(MGT-402)
VU
LESSON-33
WHAT
IS A BUDGET?
A
budget is a plan expressed in
quantitative, usually monetary terms,
covering a specific period of
time,
usually one year. In other
words, a budget is a systematic plan
for the utilization
of
manpower
and material resources. In a business
organization a budget represents an
estimate of
future
costs and revenues. Budgets
may be divided into two
basic classes; Capital
Budgets and
Operating
Budgets, Capital budgets are
directed towards proposed expenditures
for new projects
and
often require special financing
(this topic is discussed in
the next Unit). The
operating budgets
are
directed towards achieving short-term operational
goals of the organization,
for instance,
production
or profit goals in a business
firm. Operating budgets may
be sub-divided into various
departmental
or functional budgets. The
main characteristics of a budget
are:
It
is prepared in advance and is derived
from the long, term
strategy of the
organization.
It
relates to future period for
which objectives or goals have
already been laid
down.
It
is expressed in quantitative form,
physical or monetary units, or
both.
Different
types of budgets are
prepared for different
purposes e.g. Sales. Budget,
Production
Budget.
Administrative Expense Budget, Raw
material Budget, etc. All these
sectional budgets are
afterwards
integrated into a master budget- which
represents an overall plan of
the organization. A
budget
helps us in the following
ways:
1.
It brings about efficiency and
improvement in the working of
the organization.
2.
It is a way of communicating the plans to
various units of the organization. By
establishing
the
divisional, departmental, sectional
budgets, exact responsibilities
are assigned. It thus
minimizes
the possibilities of buck-passing if
the budget figures are not
met.
3.
It is a way or motivating managers to
achieve the goals set
for the units.
4.
It serves as a benchmark for
controlling on going. Operations.
5.
It helps in developing a team spirit
where participation in budgeting is
encouraged.
6.
It helps in reducing wastage's and
losses by revealing them in time
for corrective action.
7.
It serves as a basis for evaluating
the performance of
managers.
8.
It serves as a means of educating
the managers.
Budgetary
control
No
system .of planning can be
successful without having an
effective and efficient
system of
control.
Budgeting is closely connected with control.
The exercise of control in
the organization
with
the help of budgets is known
as budgetary control. The process of
budgetary control includes
(i)
preparation of various budgets (ii)
continuous comparison of actual
performance with budgetary
performance
and (iii) revision of
budgets in the light of
changed circumstances.
A
system of budgetary control should
not become rigid. There
should be enough scope
for
flexibility
to provide for individual
initiative and drive. Budgetary
control is an important device
for
making
the organization more
efficient on all fronts. It is an
important tool for
controlling costs
and
achieving the overall objectives.
Installing
a budgetary control system
Having
understood the meaning and
significance of budgetary control in an
organization, it will be
useful
for you to know how a
budgetary control system can be installed
in the organization.
This
requires,
first of all, finding
answers to the following
questions in the context of an
organization:
201

Cost
& Management Accounting
(MGT-402)
VU
What
is likely to happen?
What
can be made to
happen?
What
are the objectives to be
achieved?
What
are the constraints and to
what extent their effects
can be minimized?
Having
found answers to the above
questions, the following
steps may be taken for
installing an
effective
system of budgetary control in an
organization.
Organization
for budgeting
The
setting up of a definite plan of
organization is the first
step towards installing budgetary
control
system in an organization. A Budget
Manual should, be prepared
giving details of the
powers,
duties, responsibilities and
areas of operation of each executive in
the organization.
Responsibility
for budgeting
The
responsibility for preparation and
implementation of the budgets
may be fixed as
under:
Budget
controller
Although
the Chief Executive is
finally responsible for the
budget programme, it is better if a
large
part
of the supervisory responsibility is
delegated to an official designated as
Budget Controller or
Budget
Director. Such a person should
have knowledge of the technical details
of the business and
should
report directly to the
President or the Chief
Executive of the
organization.
Budget
committee
The
Budget Controller is assisted 'in his
work by the Budget Committee. The
Committee may
consist
of Heads of various departments, viz.,
Production, Sales. Finance Personnel,
Purchase, etc.
with
the Budget Controller as its Chairman. It is generally
the responsibility of the.
Budget
Committee
to submit discusses and
finally approves the budget figures. Each
head of the
department
should have his own Sub-committee
with executives working
under him as its
members.
Fixation
of the Budget Period
Budget
period' means the period for
which a budget is prepared and employed.
The budget period
depends
upon the nature of the
business and the control
techniques. For example, a
seasonal
industry
will budget for each season,
while an industry requiring
long periods to complete
work
will
budget for four, five or
even larger number, of
years. However, it is necessary
for control
purposes
to prepare budgets both for
long as well as short
periods.
Budget
procedures
Having
established the budget organization
and fixed the budget period,
the actual work or
budgetary
control can be taken upon
the following
pattern:
Key
factor
It
is also termed as limiting factor.
The extent of influence of
this factor must first be
assessed in
order
to ensure that the budget
targets are met It would be
desirable to prepare first
the budget
relating
to this particular factor,
and then prepare the
other budgets. We are giving
below an
illustrative
list of key factors in certain
industries.
202

Cost
& Management Accounting
(MGT-402)
VU
Industry
Key
factor
Motor
Car
Sales
demand
Aluminum
Power
Petroleum
Refinery
Supply
of crude oil
Electro-optics
Skilled
technicians
Hydral
Power generation
Monsoon
The
key factors should be
correctly identified and
examined. The key factors
need not be a
permanent
nature. In the long run,
the management may overcome
the key factors by
introducing
new
products, by changing material mix or by
working overtime or extra shifts
etc.
Making
a Forecast
A
forecast is an estimate of the
future financial conditions or operating
results. Any estimation is
based
on consideration of probabilities. An estimate differs
from a budget in that the
latter
embodies
an operating plan or an organization. A budget
envisages a commitment to certain
objectives
or targets, which the
management seeks to attain on the
basis of the forecasts
prepared.
A
forecast on the other hand
is an estimate based on probabilities of an
event. A forecast may
be
prepared
in financial or physical terms for sales,
production cost, or other
resources required for
business.
Instead of just one forecast a
number of alternative forecasts may be
considered with a
view
to obtaining the most
realistic overall
plan.
Preparing
budgets
After
the forecasts have been
finalized the preparation of budgets
follows. The budget
activity
starts
with the preparation of the
said budget. Then, production budget is
prepared on the basis
of
sales
budget and the production
capacity available. Financial budget
(i.e. cash or working
capital
budget)
will be prepared on the
basis of sale forecast and
production budget. All these
budgets are
combined
and coordinated into -a master budget-
The budgets may be revised
in the course of the
financial
period if it becomes necessary to do so in
view of the unexpected developments,
which
have
already taken place or are
likely to take place.
Choice
between Fixed and Flexible
Budgets
A
budget may be fixed or flexible. A
fixed budget is based on a fixed
volume of activity, 11
may
lose
its effectiveness in planning and
controlling if the actual
capacity utilization is different
from
what
was planned for any particular
unit of time e.g. a month or
a quarter. The flexible budget
is
more
useful for changing levels of
activity, as it considers fixed
and variable costs
separately. Fixed
costs,
as you are aware, remain unchanged
over a certain range of output such
costs change when
there
is a change in capacity level.
The variable costs change in
direct proportion to output if
flexible
budgeting approach is adopted, the budget
controller can analyze the
variance between
actual
costs and budgeted costs
depending upon the actual
level of activity attained
during a period
of
time.
203
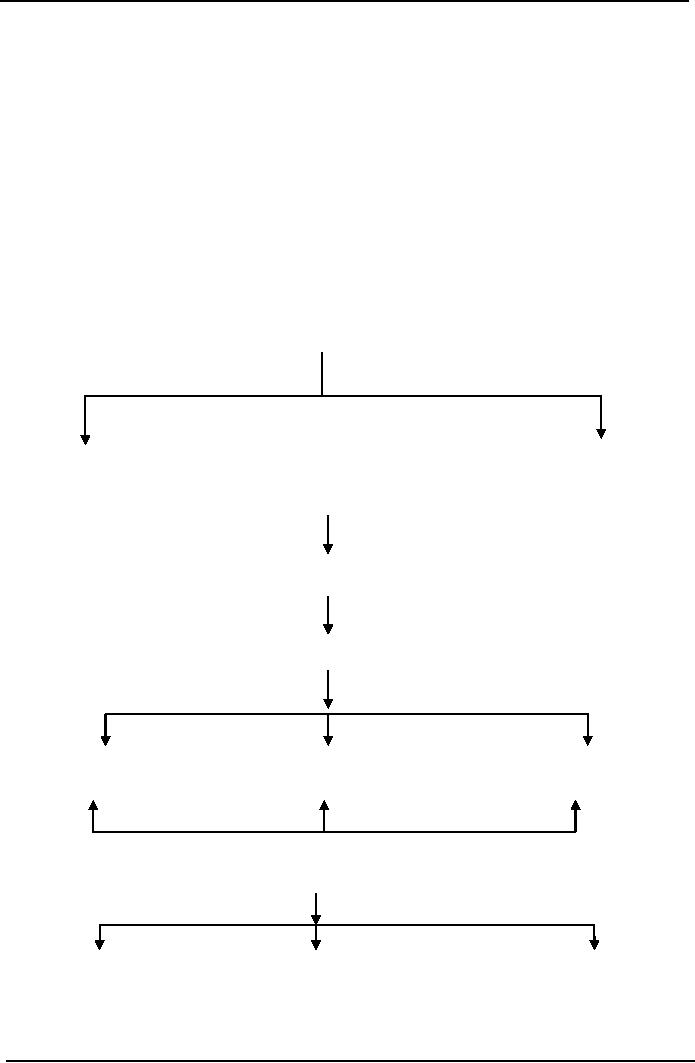
Cost
& Management Accounting
(MGT-402)
VU
Objective
of Budget
Profit
maximization.
Maximization
of sales.
Volume
growth.
To
compete with the
competitors.
Development
of new areas of operation.
Quality
of service.
Work-force
efficiency.
Divisions
of Budget
Division
of Budgets
Functional
Budget
Master
Budget
Functional
Budget
Sales
Budget
Production
Budget
Raw
material
Labor
Factory
overhead
Cost
of goods
sold
Selling
&
General
&
Financial
distribution
Administrative
charges
expenses
expenses
budget
budget
budget
204

Cost
& Management Accounting
(MGT-402)
VU
LESSON#
34 & 35
Production
& Sales Budget
Budgets
can be classified into
different categories on the
basis of Time, Function, or
Flexibility.
The
different budgets covered
under each category are
shown in the following
chart:
Chart:
clarification of Budgets
Time
Function
Flexibility
·
Long
term
Sales
Fixed
·
Short
term
Production
Flexible
·
Current
Cost
of Production
·
Rolling
Purchase
Personnel
Research
Capital
Expenditure
Cash
Master
Let
us discuss some of the
budgets covered in the above
classification.
Rolling
budget
Some
organizations follow the practice of
preparing a willing or progressive budget in
such
organizations;
budget for a year in advance
will always be there. Immediately
after a month, or a
quarter,
passes, as-the case may
be, a new budget is prepared
for a twelve months. The
figures for
the
month/quarter, which has
rolled down, are dropped and
the figures for the next
month /
quarter
are added. For example, if a
budget has been prepared for
the year 19X7, after the
expiry
of
the first quarter ending
31st March 19X7, a new budget
forth full year ending 31ft
March, 19X8
will
be prepared by dropping the figures
for the quarter which
has past (i.e. quarter
ending 31st
March
19X7) and adding-the figures for the
new quarter-ending 31st
March 19X8. The figures
for
the
remaining three quarters ending 31st
December 19X7 may also be
revised, if necessary.
This
process
will continue whenever a
quarter ends and a new
quarter begins.
Sales
budget
Sales
Budget generally forms the fundamental
basis on which all other
budgets are built the
budget
is
based on projected sales to be achieved
in a budget period. The Sales Manager is
directly
responsible
for the preparation and
execution of this budget. Be usually
taking into consideration
the
following organizational and
environmental factors while preparing
the tales budget:
Availability
of material or supplies
Internal
External
Past
sales figures and
trends
General
trade prospects
Salesmen's
estimates
Seasonal
fluctuation
Plant
capacity
Potential
market
Orders
on hand
Government
controls, rule
and
regulator
relating to the industry
Availability
of material or supplies
Political
situation and its impact on
Market
Cost
of distribution of goods
Financial
aspect
205

Cost
& Management Accounting
(MGT-402)
VU
It
is desirable to break up the
entire sales budget on the
basis of different products,
time periods
and
sales areas or
territories.
Illustration
1
Shad
on Ltd. has three sales
divisions at A town, B town and C
town. It sells two products
X and
Y.
The budgeted sales for
the month Jan at each
place are given
blow:-
A
Product
X
[50,000
units @ Rs. 16 each
Product
Y
[35,000
units @ Rs. 10 each
B
Product
Y
[55,000
units @ Rs. 10 each
C
Product
X
[75,000
units @ Rs. 16 each
The
Budge sales during the
Feb were:
Madras
A
Product
X
62,500
units @ Rs. 16 each
Product
Y
37,500
units @ Rs. 10 each
Bangalore
B
Product
Y
62,500
units @ Rs. 10 each
Hyderabad
C Product X
77,500
units @ Rs. 16 each
From
the reports of the sales
department it was estimated
that the sales budget for
the year ending.
31st
March than 19x6 budget in
the following
respects:
Madras
A
Product
X
4,000
units
Product
Y
2,500
units
Bangalore
B
Product
Y
6,500
units
Hyderabad
C Product X
5,000
units
Intensive
safes campaign in Bangalore
and Hyderabad is likely to result in
additional sales of
12,500
units of product I in Bangalore
and 9,000 units of Product
II in Hyderabad, Let us prepare
a
sales budget for the period ending
31st December, 19X7.
206
Cost
& Management Accounting
(MGT-402)
VU
Division
Mar
Jan
Feb
Product
Qty.
Price
Value
Qty.
Pr
Value
Qty.
Pric
Value
(Units)
(Rs.
(Rs.)
(Units)
ice
(Rs.)
(Units)
e
(Rs.)
)
(Rs.)
(Rs.
)
Town
A
54,000
16
8,64,000
50,000
16
8,00,000
62,500
16
10,00,00
X
0
37,500
16
3,75,000
35,000
10
3,50,000
37,500
10
3,75,000
Y
Total
91,500
----
12,2,9000
85,000
----
11,50,000
----
13,75,00
0
Banglore
12,500
10
2,00,000
----
-----
16
X
Town B
61,500
10
6,15,000
55,000
10
5,50,000
62,500
10
6,25,000
Y
Total
74,500
---
8,15,000
55,000
5,50,000
62,500
----
6,25,000
Hyderabad
80,000
16
12,80,000
75,000
16
12,00,000
77,500
16
12,40,00
IX
0
II
Y
9,000
10
90,000
----
----
10
Total
89,000
----
13,80,000
75,000
12,00,000
----
12,40,00
0
Product
1,46,500
16
23,44,000
1,25,000
16
20,00,000
1,40,00
16
22,40,00
X
1,08,500
10
10,80,000
90,000
10
9,00,000
0
10
0
Product
II
1,00,00
10,00,00
Y
0
0
Total
2,54,500
----
34,24,000
2,15,000
29,00,000
2,40,00
----
32,40,00
0
0
Production
budget
This
budget provides an estimate of the total
volume of production distributed
product-wise with
the
scheduling of operations by days, weeks
and months and a forecast of
the inventory of
finished
products.
Generally, the production budget is
based on the sales -budget.
The responsibility for
the
overall
production budget lies with
Works Manager and that of
departmental production budgets
with
departmental works management Production
budget may be expressed in physical or
financial
terms
or both in relation to production.
The production budgets
attempt to answer questions
like:
(i)
What
is to be produced?
(ii)
When
it is to be produced?
(iii)
How
it is to be produced?
(iv)
Where
it is to be produced?
The
production budget envisages the
production program for achieving the
sales target it serves
as
a
basis Job preparation of related cost-
budgets, e.g., materials
cost budget, labor cost budget,
etc.
It
easily facilities the preparation of a
cash budget. The production budget is
prepared after taking
into
consideration several factors like:
(i)
Inventory
policies. (II)
Sales
requirements, (iii)
Production
stability, (iv)
Plant
capacity, (v)
Availability
of materials and labor,
(vi)
Time
taken in
production
process, etc.
207

Cost
& Management Accounting
(MGT-402)
VU
Activity
2
From
the following details of
Mysore Cement Works Limited, complete
the production budget
for
the
three-month period ending March 31,
19x6 (Production budget for
product P has already
been
worked
out.
Estimated
stock
Estimated
sale during
Desired
closing stock
Type
of product
on
Jan 1, 19x6
Jan-March
1986
on
March 31, 19x6
(Units)
(Units)
(Units)
1,000
5,000
1,500
P
Q
1,500
7,500
2,500
R
2,000
6,500
1,500
S
1,500
6,000
1,000
208

Cost
& Management Accounting
(MGT-402)
VU
LESSON
36 & 37
FLEXIBLE
BUDGET
When
a company's activities can be estimated
within close limits, the
fixed budget is satisfactory.
However,
completely predictable situations exist in
only a few cases. If
business conditions
change
radically,
causing actual operations to differ
widely from fixed budget
plans, this management
tool
is
not reliable or effective.
The fact that costs
and expenses are affected by
fluctuations in volume
limits
the use of the fixed budget
and leads to the use of
the flexible budget. To illustrate,
the cost
of
operating an automobile per mile
depends on the number of
miles driven. The more a
car is
used
per year, the more it
costs to operate it but the
less it costs per mile. If
the owner prepares an
estimate
of the total cost and
compares actual expenses
with the budget at year-end,
success in
keeping
expenses within the allowed
limits cannot be determined without
accounting for the
mileage
factor. The reason for
this lies in the nature of
the expenses, some of which
arc fixed while
others
are variable or semi
variable. Insurance, taxes, registration,
and garaging are fixed
costs,
which
remain the same whether the
car is operated 1,000 or
20.000 miles. The costs of
tires, gas,
and
repairs are variable costs,
which depend largely upon
the miles driven.
Obsolescence and
depreciation
result in a semi-variable cost.
Which fluctuates to some
degree but does not
vary
directly
with the usage of the
car?
The
underlying principle of a flexible budget
is the need for some
norm of expenditures for any
given
volume of business. This
norm should be known beforehand in
order to provide a guide
to
actual
expenditures. To recognize this principle
is to accept the fact that
every business is dynamic,
ever
changing, and never static. It is
erroneous, if not futile, to expect a
business lo conform to a
fixed,
preconceived pattern.
The
preparation of a flexible budget results from
the development of formulas
for each department
and
for each account within a
department or cost center.
The formula for each
account indicates
the
fixed amount and/or a
variable rate. The fixed
amount and variable rate
remain constant within
prescribed
ranges of activity. The
variable portion of the
formula is a rate expressed in
relation to a
base
such as direct labor hours, direct labor
cost or machine hours.
The
application of the formulas to the
level of activity actually
experienced produces the
allowable
expenditures
for the volume of activity
attained. These budget figures are
compared with actual
costs
in order to measure the performance of
each department. This ready-made
comparison
makes
the flexible budget a valuable instrument
for cost control, because it
assists in evaluating the
effects
of varying volumes of activity on
profits and on the cash
position,
Originally,
the flexible budget idea was
applied principally 10 the
control of departmental factory
overhead.
Now however, the idea is
applied lo the entire budget. So
that production as well
as
marketing
and administrative bud-gels is prepared
on a flexible budget basis.
Capacity
and volume
The
discussion of the actual preparation of a
flexible budget must be preceded by a
basic
understanding
of the term "capacity." The
terms "capacity" and "volume" (or
activity) are used in
connection
with the construction and
use of both fixed and
flexible budgets. Capacity is
that fixed
amount
of '
"plant
and machinery and number of
personnel for which management
has
committed
itself and with which it
expects to conduct the
business. Volume is the
variable factor
in
business. It is related to capacity by
the fact that volume
(activity) attempts to make the
best use
of
existing capacity.
209

Cost
& Management Accounting
(MGT-402)
VU
Any
budget is a forecast of sales, costs,
and expenses. Material, labor,
factory overhead, marketing
expenses,
and administrative expenses must be
brought into harmony with
the sales volume.
Sales
volume
is measured not only by
sales the market could
absorb, but also by plant
capacity and
machinery
available to produce the goods. A
plant or a department may produce
the goods. A
plant
or department may produce 1,000
units or work 10.000 hours,
but this volume (or
activity)
may
not be ' compatible with the
capacity of the plant or
department. The production
of
1.000'units
or the working of 10.000
hours may be greater or smaller
than the amount of sales
the
company
can safely expect to achieve
in a given market during a given period.
The
following terms are used in
referring to capacity levels' theoretical practical,
expected actual,
and
normal. Current Internal
Revenue Service regulations permit
the use of practical,
expected
actual
or normal capacity in assigning
factory overhead costs to
inventories.
Theoretical
Capacity. The
theoretical capacity of a department is its
capacity to produce at full
speed
without interruptions. It is achieved if
the plant-or department
produces at 100 percent of its
rated
capacity,
Practical
Capacity. It is
highly improbable that any company
can operate at theoretical
capacity.
Allowances
must be made for unavoidable
interruptions, such as time lost
for repairs,
inefficiencies,
breakdowns, setups. failures, unsatisfactory
materials, delays in delivery of
materials
or
supplies, labor shortages
and absences, Sundays, holidays,
vacations, inventory taking, and
pat-
tern
and model changes. The
number of work shifts must
also be considered. These
allowances
reduce
theoretical capacity to the practical
capacity level. This
reduction is caused by
internal
influences
and does not consider
the chief external cause,
lack of customers' orders.
Reduction
from
theoretical to practical capacity typically
ranges from 15 percent to 25 percent,
which results
in
a practical capacity level or 75 percent lo 85 percent
of theoretical capacity.
Expected
Actual Capacity. Expected
actual capacity is based on a short-range
outlook. The use
of
expected actual capacity is
feasible with firms whose
products are of a seasonal
natureČ and
market
and style changes allow
price adjustments according to
competitive conditions
and
customer
demands.
Normal
Capacity. Firms
may modify the above
capacity levels by considering the
Utilization of
the
plant or various departments in the light
of meeting average sales demands
over a period long
enough
to level out the peaks
and valleys which come with
seasonal and cyclical variations.
Finding
a
satisfactory and logical balance between
plant capacity and sales
volume is one of the
important
problems
of business management.
Once
the normal (or average)
capacity level has been
established, overhead costs
can be estimated
and
factory overhead rates
computed. The use of these
rates will cause all
overhead of the period
to
be absorbed, provided normal
capacity and normal expenses
prevail during the
period.
Purposes
of Establishing Normal Capacity. Although
there may be some differences
between a
normal
long-run volume and the
sales volume expected in the
next period, normal capacity
is
useful
in establishing sales prices
and controlling costs. It is
the basis for the
entire budget system,
and
it can be used for the
following purposes and
aims:
1.
Preparation of departmental flexible budgets
and computation of predetermined
factory
overhead
rates,
2.
Compilation of the standard
cost of each product.
3.
Scheduling production.
210

Cost
& Management Accounting
(MGT-402)
VU
4.
Assigning cost to
inventories.
5.
Measurement of the effects of changing volumes of
production.
6.
Determination of the break-even
point.
Although
other capacity assumptions
are sometimes used due to
existing circumstances, normal
capacity
fulfills both long- and
short-term purposes. The
long-term utilization of the
normal
capacity
level relates the marketing
phase and therewith the
pricing policy of the
business 10 the
production
phase over a long period of
time, leveling out
fluctuations that are of
short duration
and
of comparatively minor significance.
The short-term utilization
relates to management's
analysis
of changes or fluctuations that
occur during an operating year.
This short-term
utilization
measures
temporary idleness and aids
in an analysis of its causes.
Factors
Involved in Determining Normal
Capacity. In determining the
normal capacity of a
plant,
both
its physical capacity and average
sales expectancy must be
considered; neither plant
capacity
nor
sales potential alone is
sufficient. As previously mentioned,
sales expectancy should
be
determined
for a period long enough to
level out cyclical variations rather
than on the sales
expectancy
for a short period of time. It
should also be noted that
outmoded machinery
and
machinery
bought for future use
must be excluded from the
considerations which lead to
the
determination
of the normal capacity
level-Calculation of the normal
capacity of a plant
requires
many
different judgment factors. Normal
capacity should be determined first
for the business as a
whole
and then broken down by
plants and departments. Determination of
a departmental
capacity
figure might indicate that
for a certain department the planned
program is an overload
while
in another ii will result in
excess capacity. The
capacities of several departments will
seldom
be
in such perfect balance as to produce an unhampered
flow of production. For the
department
with
the overload, often termed the
"bottleneck" department, actions such as
the following might
have
to be taken;
1.
Working
overtime.
2.
Introducing
an additional shift.
3.
Temporarily
transferring operations to another
department where spare capacity is
available.
4.
Subcontracting
the excess load.
5.
Purchasing
additional equipment.
On
the other hand, the
excess facilities of other departments
might have to be reduced. Or
the
safes
department might be asked lo
search for additional orders to
utilize the spare capacity
in
these
departments.
The
effect of the various capacity
levels on predetermined factory overhead
rates is illustrated
below.
If the 75 percent capacity level is
considered to be the normal operating
level, the
overhead
rate is $2.40 per direct
labor hour.
211

Cost
& Management Accounting
(MGT-402)
VU
EFFECT
OF VARIOUS CAPACITY LEVELS ON
PREDETERMINED
FACTORY
OVERHEAD RATES
ITEM
NORMAL
PRACTICAL
THEORETICAL
CAPACITY
CAPACITY
CAPACITY
Percentage
of
75%
85%
100%
production
capacity
Direct
labor hours
7,500
hrs.
8,500
hrs.
10,000
hrs.
Budgeted
factory
overhead
Fixed
Rs.
12,000
Rs.
12,000
Rs.
12,000
Variable
6,000
6,800
8,000
Total
Rs.
18,000
Rs.
18,800
Rs.
20,000
Fixed
factory overhead
Rs.
1.60
Rs.
1.41
Rs.
1.20
rate
per direct labor
hours
Variable
factory
.80
.80
.80
overhead
rate per direct
labor
hour
Total
factory overhead
Rs.
2.40
Rs.
2.21
Rs.
2.00
rate
per direct labor hour
At
higher capacity levels [he
rate is lower, because the
fixed overhead is
spread
A
distinction must be made
between idle and excess
capacity. Idle capacity results
from the
temporary
idleness of production or distribution
facilities due to a lack of orders.
Idle facilities are
restored
to full use as soon as the
need arises. Their cost is
usually part of the expense
total used in
selling
up the overhead rate and is
at all limes a part of the
product cost. However, as
explained in
the
factory overhead and
standard cost chapters, the
cost of idle capacity can be
isolated both for
control
purposes and for the
guidance of management-
Excess
Capacity. Conversely, results
either from greater productive
capacity than the
company
could
ever hope to use. or from an
imbalance in equipment or machinery.
This imbalance
involves
the excess capacity of one
machine in contrast with the
output of other machines
with
which
it must be synchronized. Any expense
arising from excess capacity
should be excluded
from
the factory overhead rate and
from the product cost.
The expense should be treated as
a
deduction
in the income statement. In
many instances. It may be wise to
dispose of excess
plant
and
equipment.
ANALYSIS
OF COST BEHAVIOR
The
success of a flexible budget depends
upon careful study and
analysis of the relationship
of
expenses
to volume of activity or production
and results in classifying expenses as
fixed, variable,
and
semi variable,
Fixed
Expenses
A
fixed expense remains the
same in total as activity
increases or decreases. Fixed factory
overhead
includes
conventional items such as straight-line
depreciation, property insurance,
and real estate
taxes-
Other expenses not
inherently fixed acquire the
fixed characteristic through
the dictates of
management
policy.
212

Cost
& Management Accounting
(MGT-402)
VU
The
classification of an expense as fixed is
valid only on the assumption
that the underlying
conditions
remain unchanged. Thus, there is really
nothing irrevocably fixed
with respect to any
expense
classified as fixed. In the
long run all expenses
are variably. In the short
run, some fixed
expenses,
some times called programmed
fixed expenses, will change
because of changes in
the
volume
of activity or for such reasons as
changes in the umber and
salaries of the
management
groups.
Other fixed expenses (e.g.,
depreciation or a long-term lease
agreement) may commit
management
for a much longer period
time; therefore, they have
been labeled committed
fixed
expenses.
Variable
Expenses
A
variable expense is expected to
increase proportionately with an
increase in activity and
decrease
proportionately
with a decrease in activity. Variable
expenses include the cost of
supplies, indirect
factory
labor, receiving, storing, rework,
perishable tools, and
maintenance of machinery and
tools.
A
measure of activity such as direct
labor hour or dollars.
213

Cost
& Management Accounting
(MGT-402)
VU
LESSON#
38
TYPES
OF BUDGET
Cash
Budget
The
cash budget the management
in:
Determining
the future is a summary of
the firm's expected cash
inflows and outflows over
a
particular
period of time. In other words,
cash budget involves a projection of
future cash
receipts
and cash disbursements over
various time intervals.
·
A
cash budget helps cash needs
of the firm
·
Planning
for financing of those
needs
·
Exercising
control over cash and
liquidity of the
firm.
The
overall objective of a cash budget is to
enable the firm to meet
all its commitments in
time
and
at the same time prevent
accumulation at any lime of unnecessary
large cash balances
with
it-
Format
of Cash Budget
XYZ
Ltd
Cash
Budget
For
the month of Jan-March
Jan
Feb
March
Opening
balance
Add
Receipts
(Anticipated cash
Receipt
from all sources)
Less
Payments
(Anticipated utilization of
cash)
Excess
/ Deficit
Bank
barrowing / Overdraft
Closing
balance
Activity
D.A
Corporation has following
information relating to the month of
January:
Opening
cash balance Rs. 20,000.
Cash receipts are: Credit
sales Rs. 1, 40,000, Cash
sales Rs.
80,000,
Loan Rs. 2,00,000, Disposal
of machine Rs. 60,000, further
capital Rs. 1,20,000.
Cash
payments are: Payment to creditor Rs.
60,000, Cash purchase Rs.
60,000, machine
purchase
Rs. 3,50,000, Administrative
expenses Rs. 40,000, Selling
expenses Rs. 75,000
and
Interest
on loan Rs. 5,000
214

Cost
& Management Accounting
(MGT-402)
VU
Solution
Jan
Opening
balance
20,000
Add
Receipts
Receipt
from sales:
Credit
sales
1,
40,000
Cash
sales
80,000
Loan
2,00,000
Further
capital
1,20,000
Disposal
of machine
60,000
6,00,000
6,
20,000
Less
Payments
Purchases:
Payment
to creditor
60,000
Cash
purchase
60,000
Machine
purchase
3,50,000
Administrative
expenses
40,000
Selling
expenses
75,000
Interest
on loan
5,000
5,90,000
Closing
balance
30,000
215
Cost
& Management Accounting
(MGT-402)
VU
LESSON#
39
Complex
Cash Budget & Flexible
Budget
The
cash budget is a summary of the
firm's expected cash inflows
and outflows over a
particular
period
of time. In other words,
cash budget involves a projection of
future cash receipts
and
cash
disbursements over various time
intervals.
A
cash budget helps the
management in:
·
Determining
the future cash needs of
the firm
·
Planning
for financing of those
needs
·
Exercising
control over cash and
liquidity of the
firm.
The
overall objective of a cash budget is to
enable the firm to meet
all its commitments in
time
and
at the same time prevent
accumulation at any lime of unnecessary
large cash balances
with
it:
Practice
Question---Complex Cash Budget
Data
relating to the months of February to
June is available
Prepare
the cash budget for the
month of April to
June
Months
Sales
Purchases
Wages
February
18,000
12,480
1,200
March
19,200
14,400
1,400
April
10,800
24,300
1,100
May
17,400
24,600
1,000
June
12,500
26,800
1,500
Particulars
April
May
June
Opening
2,500
2,480
0
Balance
Add
15,480
15,960
13,460
Receipts
Sales
Total
(1)
17,980
18,440
13,460
Less
14,400
24,300
24,600
Payments
Purchases
1,100
1,000
1,500
Wages
Total
(2)
-15,500
-25,300
-26,100
Closing
2,480
-6,680
-12,640
Balance
(1-
2)
Bank
O/D
0
6,860
12,640
Total
Bank O/D = 6,860 + 12,640 =
19,500
216
Cost
& Management Accounting
(MGT-402)
VU
Flexible
budget:
The
Flexible Budget is designed to change in
accordance with the level of
activity attained.
Thus,
when
a budget is prepared in such a manner
that the budgeted cost
for any level of activity
is
available,
it is termed as flexible budget. Such a budget is
prepared after considering the
fixed and
variable
elements of cost and the
changes that may be expected
for each item at various
levels of
operations.
Flexible budgeting is desirable in the
following cases:
·
Where,
because of the nature of
business, sales are unpredictable,
e.g. in luxury or
semi-luxury
trades.
·
Where
the venture is a new and,
therefore, it is difficult to foresee
the demand e.g.,
novelties
and
fashion products.
·
Where
business is subject to the vagaries of
nature, such as soft
drinks,
·
Where
progress depends on adequate
supply of labor and the
business is in an area
which
suffering
forms shortage of
labor.
Normal
capacity level 2,000
units
Original
budget
Fixed
cost
10,000
Variable
cost
40,000
50,000
Actual
capacity attained 1,500
units
Flexed
budget
Fixed
cost
10,000
Variable
cost
30,000
40,000
Cost
actually incurred
Flexed
budget
Fixed
cost
11,000
Variable
cost
33,000
44,000
Comparing
actual with original budget
Actual
Budget
Variance
Fixed
cost
11,000
10,000
(1,000)
UF
Variable
cost
33,000
40,000
7,000
F
44,000
50,000
6,000
F
Comparing
actual with flexed budget
Flexed
Actual
Variance
Fixed
cost
10,000
11,000
(1,000)
UF
Variable
cost
30,000
33,000
(3,000)
F
40,000
44,000
4,000
UF
Production
cost at normal
capacity:
Direct
cost
Direct
material
Rs.
30,000
Direct
labor
20,000
Indirect
cost
Indirect
material (Variable)
800
Other
variable production OH
cost
4,200
217

Cost
& Management Accounting
(MGT-402)
VU
Deprecation
(Fixed)
10,000
Other
fixed OH cost
5,000
Total
budgeted cost
70,000
Normal
capacity at 20,000
units
Direct
material
Rs.
26,900
Direct
labor
19,540
Indirect
material (Variable)
1,000
Other
variable production OH cost
3,660
Deprecation
(Fixed)
10,000
Other
fixed OH cost
5,400
Total
budgeted cost
66,500
Capacity
attained 17,600 units
Prepare
Flex budget at 16,000, 20,000
and 24,000 units
218
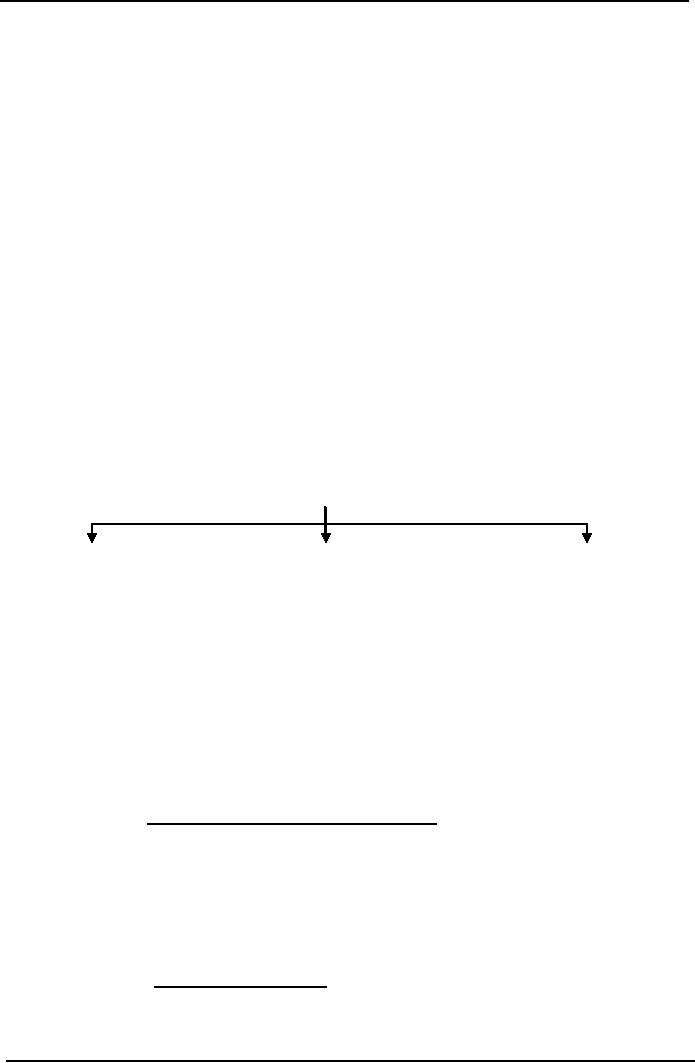
Cost
& Management Accounting
(MGT-402)
VU
LESSON#
40
FLEXIBLE
& ZERO BASE BUDGETING
The
Flexible Budget is designed to change in
accordance with the level of
activity attained.
Thus,
when
a budget is prepared in such a manner
that the budgeted cost
for any level of activity
is
available,
it is termed as flexible budget. Such a budget is
prepared after considering the
fixed and
variable
elements of cost and the
changes that may be expected
for each item at various
levels of
operations.
Flexible budgeting is desirable in the
following cases:
·
Where,
because of the nature of
business, sales are unpredictable,
e.g. in luxury or
semi-luxury
trades.
·
Where
the venture is a new and,
therefore, it is difficult to foresee
the demand e.g.,
novelties
and
fashion products.
·
Where
business is subject to the vagaries of
nature, such as soft
drinks,
·
Where
progress depends on adequate
supply of labor and the
business is in an area
which
suffering
forms shortage of
labor.
Controlling
ratios
Budget
is a part of the planning
process. After the various
budgets, including the
master budget,
have
been prepared, you may like
to compare actual performance with
the budget performance.
This
can be done by using three important
ratios as shown on the next
page.
Control
Ratios
Activity
Ratio
Capacity
Ratio
Efficiency
Ratio
The
above ratios are expressed
in terms of percentages, if the ratio
works out to 100 per
cent or
more,
the trend is taken as favorable, If the
ratio is less than 100
per cent, the indication is
taken
as
unfavorable. We shall discuss these
ratios in some
detail.
Activity
Ratio:
Activity
Ratio is a measure of the level of
activity attained over a period of
time. It is obtained by
expressing
the number of standard hours
equivalent to the work produced as a
percentage of the
budgeted
hours.
Activity
Ratio =
Standard
hours for actual
production
x
100
Budgeted
hours
Capacity
Ratio:
This
ratio indicates whether and
to what extent budgeted
hours of activity are
actually utilized. It
shows
the relationship between the
actual number of working
hours and the maximum
possible
number
of working hours in a budget
period.
Capacity
Ratio =
Actual
hours worked
x
100
Budgeted
hours
219

Cost
& Management Accounting
(MGT-402)
VU
Efficiency
Ratio:
This
ratio indicates the degree
of efficiency attained in production. It
is obtain by expressing
the
standard
hours equivalent to the work
produced as a percentage of the actual
hours spent in
producing
that work
Efficiency
Ratio =
Standard
hours for actual
production
x
100
Actual
hours worked
Activity
Calculate:
Efficiency,
Activity and Capacity ratios
and comment on the results obtained
for a
factory
which produces two units of
a commodity in one standard hour.
Actual production
during
a
particular- year is 34,000
units and the budgeted
production for the year is
40,000 units. Actual
hours
operated are 16,000 (Some
clues have been
provided).
Two
units are produced in one standard
hour. Hence, for actual
production of 34,000
units,
standard
hours required will be 17,000
(i.e. 34,000/2). For
budgeted production of 40,000
units,
budgeted
hours will be 20.000
(i.e.
40,000/ 2).
Performance
budgeting
As
explained in the preceding
pages, budgeting is nothing but
the technique of expressing,
largely
in
financial terms, the management's
plans for operating and
financing the enterprise
during
specific
periods of time- Any system
of budgeting, in order to be successful,
must provide for
performance
appraisal, as well as follow up
measures.
The
traditional (also known as
line-item or object-account) budget in
government enumerates
estimated
expenditures by type (and quantity) for a
specified period of time, usually one
year, the
expenditure
is classified by object; the personnel
are listed by type of position;
the budget is
divided
into sections according to organizational
units, departments, sections; and
the types of
expenditure
are listed by category. The primary
purpose of traditional budget particularly
in
government
administration is to ensure financial
control and meet the
requirements of legal
accountability,
that is, to ensure that
appropriation. Sanction or allotment
limits for different
items
are
not exceeded- 11 thus
emphasize only the financial
aspects. The expenditures are
not related to
the
intended or planned outputs (or
achievements). The necessity
for finking the expenditures
(or
inputs
in financial terms) to outputs (in
physical terms), facilitating the
evaluation of outcomes (or
results
of activities) cannot be over
emphasized.
Performance
budgeting (or programme budgeting) has
been designed to correct the
shortcomings
of
traditional budgeting by emphasizing
management considerations/ approaches.
Both the
financial
and physical aspects are
incorporated into the budget- A
performance budget presents
the
operations
of an organization in terms of functions,
programmes, activities, and
projects.
In
performance budgeting, Precise detail of
job to be performed or services to be
rendered is done.
Secondly,
the budget is prepared in terms of
functional categories and
their sub-division
into
programmes,
activities, and projects. Thirdly, the
budget becomes a comprehensive
document.
Since
the financial and physical results
are interwoven, it facilitates
management control.
The
main objectives of PB are; (1) to coordinate
the physical and financial
aspects; (ii) to
improve
the
budget formulation, review and
decision-making at all levels of
management; (iii) to facilitate
better
appreciation and review by
controlling.
220

Cost
& Management Accounting
(MGT-402)
VU
Authorities
(legislature, Board of Trustees or
Governors, etc.) as the presentation is
more
purposeful
and intelligible; (iv) to
make more effective
performance audit possible;
and (v) to
measure
progress towards long-term objectives
which are envisaged in a
development plan.
Performance
budgeting involves evaluation of the
performance of the organisation in the
context
of
both specific, as well as,
overall objectives of the organisation. It
presupposes a crystal clear
perception
of organizational objectives in general, and
short-term business objectives as
stipulated
in
the budget, in particular by each
employee of the organisation,
irrespective of his level. It,
thus,
provides
a definite direction to each
employee and also a control
mechanism to higher
management.
Performance
budgeting requires preparation of periodic performance
reports. Such reports
compare
budget and actual data, and
show variances. Their preparation is
greatly facilitated if the
authority
and responsibility for the
incidence of each cost element is clearly
defined within the
firm's
organizational structure- In addition,
the accounting system should
be sufficiently detailed
and
coordinated to provide necessary data
for reports designed for
the particular use of
the
individuals
or cost centers having
primary responsibility for
specific cost.
The
responsibility for preparing the
performance budget of each department
lies on the
respective
Department
Head. Each Department Head
will be supplied with a copy of
the section of the
master
budget appropriate to his sphere. For
example, the chief buyer
will be supplied with
the
copy
of the materials purchase budget so
that he may arrange for
purchase of necessary
materials-
Periodic
reports from various sections of a
department will be received by
the departmental head
who
will submit a summary report
about his department to the budget
committee. The report
may
be
daily, weekly or monthly, depending
upon the size of business
and the budget period.
These
reports
will be in the form of comparison of
budgeted and actual figures,
both periodic and
cumulative.
The purpose of preparing these reports is
to promptly inform about the
deviations in
actual
and budgeted activity to the
person who has the necessary
authority and responsibility
to
take
necessary action to correct
the deviations from the
budget,
Zero
base budgeting
Earlier
we have explained the
formulation or different types of
budgets. If the approach
adopted in
the
formulation and preparation of budgets is
based on current level of operations or
activities,
including
current level of expenditure
and revenue, such budgeting is known as
traditional
budgeting.
This type of budgeting process
generally assumes that the
allocation of financial
resources
in the past was correct
and will continue to hold
good for the future as
well. In most
cases,
an addition is made to the
current figures of costs to allow
for expected (or
even
unexpected)
increases. Consequently, the budget
generally takes an upward direction
year after
year,
in spite of generally declining
efficiency. Such a system of budgeting
cannot be expected to
promote
operational efficiency. It may, on the
other hand, create several
problems for top
management.
Some of these problems
are:
·
Programmes
and activities involving wasteful
expenditure are not
identified, resulting in
avoidable
financial and other
costs.
·
Inefficiencies
of a prior year are carried
forward in determining subsequent
years' levels of
performance.
·
Managers
are not encouraged to
identify and evaluate alternate
means of accomplishing the
221

Cost
& Management Accounting
(MGT-402)
VU
same
objective.
·
Decision-making
is irrational in the absence of
rigorous analysis of all
proposed costs and
benefits.
·
Key
problems and decision areas
are not highlighted. Thus,
no priorities are
established
throughout
the organization.
·
Managers
tend to inflate their budget
requests resulting in more
demand for funds than
their
availability
these results in recycling the entire
budgeting process.
Thus,
the traditional budgeting technique
may be quite meaningless in
the present context
when
management
must review or re-evaluate every
task with a view to better
project which have a
positive
cost-benefit analysis or which
are capable of meeting the objective of
the organization.
The
above analysis shows that
zero base budgeting is in a way an extension of
the method of cost-
benefit
analysis to the area of the
corporate building.
Advantages
of Zero Base Budgeting
Let
us summaries the advantages of
zero base budgeting:
·
It
provides the organization with a
systematic way to evaluate different
operations and
programmes
undertaken. It enables management to
allocate resources according to
the priority
of
the programmes.
·
It
ensures that each and every
programme undertaken by management is
really essential for
the
organization,
and is being performed in
the best possible
way.
·
It
enables the management to approve
departmental budgets on the basis of
cost-benefit
analysis.
No arbitrary cuts or increases in budget
estimates are made.
·
It
links budgets with the
corporate objectives. Nothing will be allowed
simply because it was
being
done in the past. An activity
may be shelved it does not
help in achieving the goals of
the
enterprises.
·
It
helps in identifying areas of
wasteful expenditure and,
desired, it can also be used
for
suggesting
alternative courses of action.
It
facilitates the introduction and-
implement of the system of
management by objectives. Thus, it
can
be used not only for
the objective of traditional budgeting,
but also for a variety of
other
purposes.
It
is contended that zero base budgeting it
happens only in the (initial
stages when to be
identified
and
decision packages have to be
developed or completed. Once this is
done, and the
methodology
is "clear, zero base budgeting is
likely to take less time
than the traditional
budgeting.
In
any case, till such time the
organisation is properly acclimatized to
the technique of zero
base
budgeting,
it may be done in a way that all
responsibility centers are
covered at least once in
three
or
four years.
222

Cost
& Management Accounting
(MGT-402)
VU
Zero
base budgeting as a concept has become
quite popular these days.
The technique was
first
_used
by the U.S. Department of
Agriculture in 1962. Texas
instruments, a multinational
company,
pioneered
its use in the private sector.
Today a number of major
companies such as Zerox,
BASF,
International
Harvester and Eastern Airlines in
the United State are using
the system. Some
departments
of government of India have
recently introduced zero
bases budgeting with a view
to
make
the system of control more
effective.
The
responsibility for preparing the budget
rests on the Budget Controller,
who is assisted in his
work
by a Budget Committee. The Budget Committee
may consist of heads of various
departments,
viz., Sales, Production, and
Personnel. Purchase, Finance etc. Each
head of the
department
is made responsible for preparing
and executing the budget of his department. In
a
business
organization, preparation of any budget is preceded by
a sales forecast. Production
budget
is
prepared after considering the
forecasts embodied in the
sales budget and the
available
productive
capacity etc. Production budget includes
the preparation of various cost
budgets
associated
with production process.
Budgets pertaining to different
functions or units are
then
combined
and coordinated into one Master
Budget.
The
budgets may be revised from
time to time if the changed
conditions or new developments so
warrant.
A budget may be fixed or flexible. A
fixed budget is based on fixed
volume of activity. If
actual
capacity utilization is likely to
vary from period to period, flexible
budgets are more
desirable.
A flexible budget is thus prepared
for changing levels of activity. It
considers fixed and
variable
costs separately and is
therefore more useful to a
business where the level of
activity
cannot
be exactly predicted.
In
a system of budgetary control, control
ratios may be computed and
used in order to
compare
the
actual performance with the
budgeted performance. These ratios
are: activity ratio,
capacity
ratio
and efficiency ratio. In
case the ratio is hundred
percent or more, it is considered favorable.
If
it
is less than hundred per
cent, it is taken as unfavorable.
The
traditional budgeting technique which
takes the current level of
operations as the basis
for
estimating
the future level of operations is
slowly going out of date. It is
being increasingly realized
that
the traditional technique
has serious shortcomings in
view of the constantly
changing
conditions
of today; the management is expected to
review and re-evaluate the
tasks in view of the
increasing
pressures of environment. The concept of
zero base budgeting is being
considered as a
suitable
alternative to replacing the traditional
method. Zero base Budgeting
technique suggests
that
an organization should not
only make decisions about
the proposed new programmes,
but
should
also, from time to time,
review the appropriateness of
the existing.
The
concept of Zero base Budgeting has
been accepted for adoption
in the departments of the
Central
Government, and some State
Governments.
Activity
ABC
Co. wishes to arrange over
draft facilities with its bankers
during the period April to
June
when
it will be manufacturing mostly
for stock. Prepare a Cash Budget
including the extent
of
bank
facilities the company will require at
the end of each month
for the above period from
the
following
data.
223

Cost
& Management Accounting
(MGT-402)
VU
Sales
Purchases
Wages
Rs.
Rs.
Rs.
February
18,000
12,480
1,200
March
19,200
14,400
1,400
April
10,800
24,300
1,100
May
17,400
24,600
1,000
June
12,500
26,800
1,500
a)
40% is
cash sale.
b)
50 per cent of credit sales is
realized in the month
following the sale and
the remaining 50
per
cent in the second month
following. Creditors are paid in
the month following
(he
month
of purchase.
c)
Cash at bank on the 1st
April (estimated) is Rs. 25,
00.
Activity
Jammu
Manufacturing Company Ltd. is to start
production on 1st January, 19x3-
The prime cost
of
a unit is expected to be Rs. 40
out of which Rs. 16 is for
materials and Rs. 24 for
labour. In
addition,
variable expenses per unit
are expected to be Rs. 8,
and fixed expenses per
month Rs,
30,000.
Payment for materials is to be made in
the month following the
purchase. One-third of
sales
will be for cash and
the rest on credit for
settlement in the following
month. Expenses are
payable
in the month in which they
are incurred. The selling
price is fixed at Rs. 80 per
unit the
number
of units manufactured and sold is
expected to be as under:
January
900
April
2,000
February
1,200
May
2,100
March
1,800
June
2,400
Draw
a cash budget showing requirements of
cash from month to
month.
Activity
The
Sudershan Chemicals Ltd.,
operates a system of flexible budgetary
control.
A
flexible budget is required to show
levels of activity at 70%,
80% and 90%.
The
following
is a summary of the relevant
information:
a)
Sales
based on normal
level of activity of
70% (3,50,000) units
at
Rs.
200 each. If output is
increased to 80% and 90%,
selling prices are to be reduced
by
2.5%
and 5% of the original selling
price respectively in Order to reach a
wider market.
b)
Variable
costs are Rs. 100
per unit (70% is the cost of
raw material). In case
output
reaches
80% level of activity or
above the effective purchase
of raw material will be
reduced
by 5%.
c)
Variable
overheads: Salesman's commission is 2% of
sale value.
d)
Semi-variable
overheads (total) at 3,50,000
units are Rs. 1,20,00,000.
They are expected
to
increase by 5% if output reaches a
level of activity of 80% and
by a further 10% if it
reaches
the 90% level,
e)
Total
fixed overheads are Rs.
2,00,000, which is likely to remain
unchanged up to 100%
capacity.
224

Cost
& Management Accounting
(MGT-402)
VU
Activity
Calculate:
(a) Efficiency Ratio (b)
Activity Ratio (a) Capacity Ratio
from the following
figures:
Budgeted
production
880
units
Standard
hours per unit
10
Actual
production
750
units
Actual
working hours
6,000
225

Cost
& Management Accounting
(MGT-402)
VU
LESSON
# 41
DECISION
MAKING IN MANAGEMENT ACCOUNTING
Relevant
costs and
decision-making
Relevance
is one of the key characteristics of
good management accounting
information. This
means
that management accounting
information produced for each
manager must relate to
the
decisions,
which he/she will have to
make.
Relevant
costs are the costs
that meet this requirement
of good management
accounting
information.
The Chartered Institute of Management
Accounting defines relevant
costs as:
The
costs appropriate to a specific management
decision
This
definition could be restated as `the
amount by which costs
increase and benefits decrease
as
a
direct result of a specific management
decision'. Relevant benefits are `the
amounts by which
costs
decrease and benefits increase as a
direct result of a specific management
decision'.
Before
the management of an enterprise
can make an informed
decision on any matter,
they
need
to incorporate all of the
relevant costs-which apply to the
specific decision at hand in
their
decision-making
process. To include any non-relevant
costs or to exclude any relevant costs
will
result
in management basing their
decision on misleading information
and ultimately to
poor
decisions
being taken.
Relevant
costs and benefits only deal
with the quantitative
aspects of decision. The
qualitative
aspects
of decisions are of equal
importance to the quantitative
and no decision should be
made
in
practice without full consideration
being given to both
aspects.
Identifying
relevant and non-relevant
costs
The
identification of relevant and
non-relevant costs in various decision-making
situations is
based
primarily on common sense
and the knowledge of the
decision maker of the area
in which
the
decision is being making. Armed
with these two tools
you should be able to sift
through all
the
information that is available in
respect of any decision and
extract those costs (and
benefits),
which
are appropriate to the decision at
hand.
In
identifying relevant costs
for various decisions, you
may find that some
costs not included in
the
normal accounting records of an
enterprise are relevant and
some costs included in
such
records
are non-relevant. It is important
that you and relevant
costs for decision-making,
and
while
the latter may be recorded
in the former this is not
always the case.
Accounting
records are used to record
the incidence of actual
costs and revenues as they
arise.
Decisions,
on the other hand, are
based only on the relevant
costs and benefits appropriate to
each
decision while the decision
is being made. This point is
particularly appropriate when
you
come
to examine opportunity costs
and sunk costs that
are dealt with
below.
In
practice, you may also
find that the information
presented in respect of a decision
does not
include
all the relevant costs
appropriate to the decision but
the identification of this omission
is
very
difficult unless you are
familiar with the area in
which the decision is being
made.
Incremental
costs
An
incremental cost can be defined as a
cost which is specifically incurred by
following a course
of
action and which is
avoidable if such action is not taken.
Incremental costs are, by
definition,
relevant
costs because they are
directly affected by the decision
(i.e. they will be incurred
if the
226

Cost
& Management Accounting
(MGT-402)
VU
decision
goes ahead and they
will not incurred if the
decision is scrapped). For
example, if an
enterprise
is deciding whether or not to
accept a special order for
its product, the extra
variable
costs
(i.e. number of units in
special order x variable
cost per unit) that
would be incurred in
filling
the order are an incremental
cost because they would
not be incurred if the
special order
were
to be rejected.
Non-incremental
costs
These
are costs, which will
not be affected by the decision at
hand. Non-incremental costs
are
non-relevant
costs because they are
not related to the decision
at hand (i.e.
non-incremental
costs
stay the same no matter
what decision is taken). An example of
non-incremental costs
would
be fixed costs, which by
their very nature should
not be affected by decisions (at least
in
the
short-term). If, however, a decision
gives rise to a specific
increase in fixed costs then
the
increase
in fixed costs would be an
incremental and, hence,
relevant cost. For example,
in a
decision
on whether to extend the
factory floor area of an
enterprise, the extra rent to
be
incurred
would be a relevant cost of
that decision.
Spare
capacity costs
Because
of the recent advancements in
manufacturing technology most
enterprises have greatly
increased
their efficiency and as a
result are often operating at
below full capacity.
Operating
with
spare capacity can have a
significant impact on the relevant
costs for any
short-term
production
decision the management of such an
enterprise might have to
make.
If
spare capacity exists in an
enterprise, some costs which
are generally considered
incremental
may
in fact be non-incremental and
thus, non-relevant, in the
short-term. For example, if
an
enterprise
is operating at less than full
capacity then its work force
is probably under utilized. If
it
is
the policy of the enterprise
to maintain the level of its
work force would be a
non-relevant cost
for
a decision on whether to accept or reject
a once-off special order.
The labour cost is
non-
relevant
because the wages will
have to be paid whether the
order is accepted or not. If
the
special
order involved and element of
overtime then the cost of
such overtime would of
course
be
a relevant cost (as it is an
incremental cost) for the
decision.
Two
further types of costs that
have to be considered are
opportunity costs and sunk
costs.
Opportunity
costs
An
opportunity cost is a level of
profit or benefit foregone by the
pursuit of a particular
course
of
action. In other words, it is the value
of an option, which cannot be taken as a
result of
following
a different option. For
example, if an enterprise has a
quantity of raw material in stock,
which
cost Rs. 7 per kg and it
plans to use this material in
the filling of a special
order then you
would
normally, incorporate Rs. 7
per kg as part of your cost
calculations for filling the
order. If,
however,
this quantity of material could be
resold without further
processing for Rs. 8 per
kg,
then
the opportunity cost of using
this material in the special
order is Rs. 8 per kg; by
filling the
order
you forego the Rs. 8
per kg, which was
available for a straight
sale of the material.
Opportunity
costs are, therefore, the
`real' economic costs of taking one
course of action as
opposed
to another.
In
the above decision-making situation it is
the opportunity cost which
is the relevant cost
and,
hence,
the cost which should be
incorporated into your
cost-versus-benefit analysis. It is
because
the
loss of the Rs. 8 per kg is
directly related to the
filling of the order and
the opportunity cost
is
greater than the book
cost. Opportunity costs are
relevant costs for a
decision only when
they
exceed
the costs of the same
item in the option to the
decision under consideration.
227

Cost
& Management Accounting
(MGT-402)
VU
You
may find the idea of
opportunity costs difficult to
grasp at first because they
are notional
costs,
which may never be included
in the books and records of an
enterprise. They are,
however,
relevant in certain decision-making situation
and you must bear in
mind the fact
that
they
exist when assessing any such
situations.
Sunk
cost
A
sunk cost is a cost that
the already been incurred
and cannot be altered by any
future decision.
If
sunk costs are not affected
by a decision then they must
be non-relevant costs for
decision-
making
purposes. Common examples of
sunk costs are market
research costs and
development
expenditure
incurred by enterprises in getting a
product or service ready for
sale. The final
decision
on whether to launch the
product or service would
regard these costs as `sunk'
(i.e.
irrecoverable)
and thus, not incorporate
them into the launch
decision.
Sunk
costs are the opposite of
opportunity costs in that
they are not incorporated in
the decision
making
process even though they
have already been recorded
in the books and records of
the
enterprise.
228

Cost
& Management Accounting
(MGT-402)
VU
LESSON
# 42
DECISION
MAKING
Companies
are often faced with
the problem of whether to
close down temporarily a
part of the
plant
during periods of low
demand.
How
long operations should be
continued?
As
long as products contribute
fixed expenses, a company
seems to be better off than
if the plant
were
shut down.
Size
of fund
The
fund required to continue production is
the difference between the
following:
(a)
Fixed costs at normal operations,
(b)
Fixed costs when plant is
shut down.
Arguments
against shut-down
(a)
If the company continues operation,
expenses that would be
incurred with the closing
down
of
the plant will be saved;
e.g. an increase in factory
security.
(b)
Continued operation means
saving (he expenses that
will otherwise be incurred if the
plant is
reopened
again at a later stage.
(c)
A shut-down for a short period of
fine will not eliminate all
costs. Rent, rates,
depreciation
and
insurance will have to be
incurred during the shutdown
period.
(d)
If the factory is shut down,
this will affect not
only morale but also its market standing
if it
cannot
meet consumer demand.
Illustration
Lanka
Manufacturing Company is considering
temporarily closing down a division
due to an
unexpected
fall in demand. On the basis
of the following information
you are required by
the
board
of directors to prepare a statement in such a way as to
show clearly whether or not it
is
advisable
to close down the division
temporarily.
Production
capacity
50%
70%
90%
100%
Units
50,000
70,000
90,000
100,000
Prime
cost
Rs.
210,000
Rs.
294,000
Rs.
378,000
Rs.
420,000
Production
overhead
200,000
240,000
290,000
300,000
Other
overhead
90,000
102,000
114,000
120,000
The
division is operating at 60 percent capacity
with a turnover of Rs.
515,000. If it is decided to
close
the division temporarily, it is
estimated that:
(a)
expenses
that would be incurred with
the closing down of the
division would
amount
to Rs. 60,000
(b)
present
fixed costs would be reduced
by Rs. 54,000 per
annum;
(c)
plant
maintenance during shut-down
would be Rs 10,000 per
annum;
(d)
On
reopening, the cost of overhauling
plant, training and
engagement of new
personnel
would be Rs. 30,000
It
is expected that in about
twelve month's time it may
be possible to work at 80 percent
capacity.
229

Cost
& Management Accounting
(MGT-402)
VU
Differential
Costing for Short-Term Decision
Making
The
role of fixed
costs
If
the decrease or increase in
the level of activity affects
fixed costs then these
costs should be
considered
differential costs. It is generally
accepted that if the plant
has excess capacity then
new
or
additional volume may be accepted if
the selling price ii greater
than variable costs. In such
a
situation,
fixed costs arc not
relevant if they remain fixed at an
increased level of output.
But if
they
are incurred because of the
increased level of activity
then they are certainly
variable. Once
incurred,
if they arc committed fixed
costs, they become a
permanent feature and the
company
may
find (hat it has capacity
far in excess of requirements.
The
following illustration has
been prepared so as to place
particular emphasis on the
role of fixed
costs.
Illustration
Sena
of London operates at 100 percent of
normal capacity. At this
volume it produces
50,000
units
of a product.
Income
statement
Sales
(50,000 units at Rs. 10
each)
Rs.
500,000
Prime
cost (Rs. 5 per
unit)
Rs.
250,000
Rs.
250,000
Variable
production overhead (Rs. 1
per unit)
Rs.
50,000
Rs.
200,000
Fixed
production overhead
Rs.
100,000
Factory
profit
Rs.
100,000
The
marketing director reports that an
overseas customer has offered to
pay Rs. 7.50 per
unit for
an
additional 20,000 units. To produce the
additional order fixed costs
would increase by Rs.
25,000.
Would you advise the
company to accept the
order?
Differential
cost statement-method 1
Present
business
With
Difference
additional
business
Sales
Rs.
500,000
Rs.
650,000
Rs.
150,000
Prime
cost
250,000
350,000
100,000
Variable
production overhead
50,000
70,000
20,000
Fixed
production overhead
100,000
125,000
25,000
Factory
profit
Rs.
100,000
Rs.
105,000
Rs.
5,000
Differential
cost statement method 2
Present
Additional
Total
Sales
Rs.
500,000
Rs.
150,000
Rs.
650,000
Prime
cost
250,000
100,000
350,000
Variable
production overhead
50,000
20,000
70,000
Fixed
production overhead
100,000
25,000
125,000
Factory
profit
100,000
5,000
105,000
230

Cost
& Management Accounting
(MGT-402)
VU
Traditional
statement for additional
business
Sales
(20,000 units at Rs.
7.50)
Rs.
150,000
Prime
cost (20,000 at Rs.
5)
100,000
Variable
production overhead (20,000 at
Rs. 1)
20,000
Joint
fixed production overhead (using
a
predetermined
rate of absorption:
Rs.
100,000/50,000 = Rs. 2 (20,000 at
Rs. 2)
40,000
Separable
fixed costs
25,000
Loss
on additional business
(Rs.
35,000)
The
traditional cost statement for additional
business would cause
management to reject the
offer.
Management
may also not accept
the offer because as
computed under the
traditional method
absorption
costing the price offered
per unit is less than
the total cost per
unit and also because
it
is
less than the current
selling price of Rs. 10 per
unit:
Price
offered per unit
Rs.
7.50
Cost
per unit
Rs.
Prime
cost
5.00
Variable
production overhead
1.00
Joint
fixed costs
2.00
Separable
fixed costs (Rs.
25,000/20,000)
1.25
Loss
per unit
Rs.
(1.75)
In
the differential cost
statements (methods 1 and 2)
the additional business has
been charged with
differential
cost only. It should be
noted that the reason
for the differential profit
is that the regular
sales
were not affected by the
acceptance of additional business. If the
acceptance of additional
business
caused the price to be
reduced to Rs. 7.50 per
unit on all sales then
the result would be a
loss
of Rs. 20,000 for the
company:
Revised
income statement all sales at
7.50
Sales
(70,000 units at Rs.
7.50)
Rs.
525,000
Variable
costs (70,000 at Rs.
6)
420,000
Joint
fixed production
costs
100,000
Separable
fixed production
costs
25,000
Loss
Rs.
(20,000)
The
role of variable costs
In
differential cost studies, if
the plant is not operating at practical
capacity owing to lack of
orders,
variable
costs usually represent the
differential cost whether
they are incremental or
avoidable. The
term
refers to those costs that
will change. It is often
assumed that the variable
cost per unit
will
remain
constant regardless of the
level of activity.
One
may question the validity of
the above assumption. What if
the variable cost per
unit does not
remain
constant at various levels of activity? An
increased level of activity
may cause the
variable
cost
per unit to change for a
variety of reasons.
Examples
are:
(a)
At
a higher level of output material
cost per unit may be
reduced by bulk buying
at
lower
prices;
231

Cost
& Management Accounting
(MGT-402)
VU
(b)
Direct
labour cost per unit
may increase as a result of
overtime working if there is
a
labour
shortage;
(c)
Greater
spoilage and waste with
increase production.
Illustration
that
follows puts particular
emphasis on the role of
variable costs:
The
following are
assumed:
Sena
of London produces 40,000
units operating at 50 per cent
capacity.
Production
fixed costs
Rs.
20,000
Other
fixed costs
Rs.
40,000
Variable
cost per unit:
Direct
material
Rs.
3.00
Direct
labour
2.00
Variable
overhead
1.00
Rs.
6.00
Selling
price per unit: Rs.
10
An
overseas customers offer to buy
increased quantities during the
forthcoming year at
the
following
prices:
10,000
units at Rs. 9
20,000
units at Rs. 8
30,000
units at Rs. 7
40,000
units at Rs. 6
If
the offer is accepted then
the variable cost per
unit is expected to change as
follows:
First
10,000 units
Would
cause a drop in the material
cost per unit due
to
large
scale purchases
Next
10,000 units
A
further reduction in the material
cost per unit but
an
increase
in direct wages
Next
10,000 units
Would
involve some overtime and so
variable overhead
per
unit would increase.
Next
10,000 units
A
further reduction in material cost
per unit, and
increase
labour
cost per unit and
variable cost per
unit.
Summary
of expected changes
Units
1st
10,000
2nd
3rd
10,000
4th
10,000
10,000
Material
per unit
(5%)
(5%)
-
(5%)
Labour
per unit
-
5%
+
-
5%
+
Variable
overhead per unit
-
-
5%
+
5%
+
Variable
cost per unit at various
levels of activity
Normal
Additional
Additional
Additional
Additional
(Rs.)
10,000
20,000
30,000
40,000
Direct
material
3.00
2.85
2.7075
2.7075
2.572
Direct
labour
2.00
2.00
2.1000
2.1000
2.205
Direct
expenses 1.00
1.00
1.0000
1.0500
1.1025
Variable
cost
6.00
5.85
5.8075
5.8575
5.8795
per
unit
232

Cost
& Management Accounting
(MGT-402)
VU
Differential
cost statement
Normal
Additional
Additional
Additional
Additional
40,000
10,000
20,000
30,000
40,000
Sales
value per Rs. 10
Rs.
9.00
Rs.
8.00
Rs.
7.00
Rs.
6.00
unit
Variable
cost per 6
5.85
5.8075
5.8575
5.8795
unit
Contribution
per Rs. 4
Rs.
3.15
Rs.
2.1925
Rs.
1.1425
Rs.
0.1205
unit
Fund
160,000
31,500
43,850
34,275
4,820
233

Cost
& Management Accounting
(MGT-402)
VU
LESSON
# 43
DECISION
MAKING
Relevant
Costs
Relevant
costs are future cash
flows arising as a direct consequence of
a decision.
·
Relevant
costs are future
costs
·
Relevant
costs are cash
flows
·
Relevant
costs are incremental
costs
Decision
making should be based on relevant
costs.
a.
Relevant Costs are future
costs. A decision is about
the future and it cannot
alter what has
been
done already. Costs that
have been incurred in the
past are totally irrelevant
to any
decision
that is being made `now'.
Such costs are past
costs or sunk costs. Costs
that have
been
incurred include not only
costs that have already
been paid, but also
costs that have
been
committed. A committed cost is a
future cash flow that
will be incurred
anyway,
regardless
of the decision taken
now.
b.
Relevant costs are cash
flows. Only cash flow
information is required. This means
that
costs
or charges which do not
reflect additional cash spending (such as
deprecation and
national
costs) should be ignored for
the purpose of decision making.
c.
Relevant costs are incremental
costs. For example, if an
employee is expected to have
no
other
work to do during the next
week, but will be paid his
basic wage (of, say,
Rs. 100 per
week)(
for attending work and
doing nothing, his manager
might decide to give him a
job
which
earns the organization Rs.
40. The net gain is
Rs. 40 and the Rs.
100 is irrelevant to
the
decision because although it is a
future cash flow, it will be
incurred anyway whether
the
employee is given work or
not.
Avoidable
Costs
One
of the situations in which it is
necessary to identify the
avoidable costs is in
deciding
whether
or not to discontinue a product.
The only costs which
would be saved are
the
avoidable
costs which are usually
the variable costs and
sometimes some specific
costs. Costs
which
would be incurred whether or
not he product is discontinued
are known as
unavoidable
costs.
Differential
Costs and Opportunity
Costs
Relevant
costs are also differential
costs and opportunity
costs.
·
Differential
cost is the difference in
total cost between
alternatives.
·
An
opportunity cost is the value of
the benefit sacrificed when
one course of action
is
chosen in preference to an
alternative.
For
example, if decision option A
costs Rs. 300 and
decision option B costs Rs.
360, the
differential
costs is Rs. 60.
Example:
Differential Costs and
Opportunity Costs
Suppose
for example that there
are three options, A, B and
C, only one of which can
be
chosen.
The net profit from
each would be Rs. 80,
Rs. 100 and Rs. 70
respectively.
Since
only one option can be
selected option B would be
chosen because it offers the
biggest
benefit.
234

Cost
& Management Accounting
(MGT-402)
VU
Rs.
Profit
from option B
100
Less
opportunity cost (i.e. the
benefit from the most
profitable alternative, A)
80
Differential
benefit of option B
20
The
decision to choose option B
would not be taken simply
because it offers a profit of
Rs.
100,
but because it offers a
differential profit of Rs. 20 in
excess of the next best
alternative.
Controllable
and Uncontrollable
Costs
We
came across the term
controllable costs at the beginning of
this study text.
Controllable
costs
are items of expenditure
which can be directly
influenced by a given manger within
a
given
time span.
As
a general rule, committed
fixed costs such as those costs
arising form the possession
of
plant,
equipment and buildings
(giving rise to deprecation
and rent) are largely
uncontrollable
in
the short term because
they have been committed by
longer-term decisions.
Discretionary
fixed costs, for example,
advertising and research and
development costs can
be
thought of as being controllable
because they are incurred as
a result of decision made
by
management
and can be raised or lowered at
fairly short notice.
Sunk
Costs
A
sunk cost is a past cost
which is not directly
relevant in decision making. The
principle
underlying
decision accounting is the
management decisions can
only affect the future.
In
decision
making, managers therefore required
information about future
cots and revenues
which
would be affected by the decision
under review. They must
not be misled by
events,
costs
and revenues in the past,
about which they can do
nothing.
Sunk
costs, which have been
charged already as a cost of
sales in a previous
accounting
period
or will be charged in a future
accounting period although the
expenditure had
already
been
incurred, are irrelevant to
decision making.
Example:
Sunk Costs
An
example of a sunk cost is
development costs which have
already been incurred.
Suppose
that
a company has spent Rs.
250,000 in developing a new service
for customers, but
the
marketing
department's most recent findings are
that the service might
not gain customer
acceptance
and could be a commercial failure.
The decision whether or not
to abandon the
development
of the new service would
have to be taken, but the
Rs. 250,000 spent so
far
should
be ignored by the decision makers
because it is a sunk
cost.
Fixed
and Variable
Costs
Unless
you are given an indication to
the contrary, you should
assume the following:
·
Variable
costs will be relevant
costs.
·
Fixed
costs are irrelevant to a
decision.
This
need not be the case,
however, and you should
analyze variable and fixed
cost data
carefully.
Do not forget that `fixed'
costs may only be fixed in
the short term.
Non-Relevant
Variable Costs
There
might be occasions when a
variable cost is in fact a
sunk cost (and therefore a
non-
relevant
variable cost). For example,
suppose that a company has
some units of raw
material
235

Cost
& Management Accounting
(MGT-402)
VU
in
stock. They have been paid
for already, and originally
cost Rs. 2,000. They
are now
obsolete
and are no longer used in
regular production, and they
have no scrap value.
However,
they could be used in a
special job which the
company is trying to decide
whether
to
undertake. The special job is a
`non-off' customer order, and
would use up all
these
materials
in stock.
a.
In deciding whether the job
should be undertaken, the
relevant cost of the
materials
to
the special job is nil.
Their original cost of Rs.
2,000 is a sunk cost, and
should be
ignored
in the decision.
b.
However, if the materials did
have scrap value of, say,
Rs. 300, then their
relevant
cost
to the job would be the
opportunity cost of being unable to
sell them for
scrap,
i.e.
Rs. 300.
Attributable
Fixed Costs
There
might be occasions when a
fixed cost is a relevant
cost, and you must be
aware of the
distinction
`specific' or `directly attributable'
fixed costs, and general
fixed overheads.
Directly
attributable fixed costs are
those costs which, although
fixed within a relevant
range
of
activity level are relevant
to a decision for either of
the following
reasons.
a.
They could increase if certain extra
activities were undertaken. For
example, it may be
necessary
to employ an extra supervisor if a particular
order is accepted. The extra
salary
would
be an attributable fixed
cost.
b.
They would decrease or be eliminated
entirely if a decision were taken
either to reduce
the
scale of operations or shut down
entirely.
General
fixed overheads are those
fixed overheads which will
be unaffected by decisions to
increase
or decreased the scale of operations,
perhaps because they are an
apportioned share
of
the fixed costs of items
which would be completely
unaffected by the decision.
General
fixed
overheads are not relevant
in decision making.
Absorbed
Overhead
Absorbed
overhead is a national accounting
cost and hence should be
ignored for decision
making
purposes. It is overhead incurred
which may be relevant to a
decision.
The
Relevant Cost of Materials
The
relevant cost of raw
materials is generally their current
replacement cost, unless
the
materials
have already been purchased
and would not be replaced
once used. In this case
the
relevant
cost of using them is the
higher of the
following:
·
Their
current resale value
·
The
value they would obtain if
they were put to an alternative
use.
If
the materials have no resale
value and no other possible
use, then the relevant
cost of
using
them for the opportunity
under consideration would be
nil.
236

Cost
& Management Accounting
(MGT-402)
VU
Question
Majeed
Ltd. has been approached by
customer who would like a special
job to be done for
him,
and
who is willing to pay Rs.
22,000 for it. The
job would require the
following materials:
Total
units Units
Book
value
Realizable
Replacement
Material
required
already
in
of units in
value
cost
stock
stock
Rs./unit
Rs./unit
Rs./unit
A
1,000
0
-
-
6
B
1,000
600
2
2.50
5
C
1,000
700
3
2.50
4
D
200
200
4
6.00
9
Material
B is used regularly by Majeed
Ltd, and if units of B are
required for this job, they
would
need
to be replaced to meet other
production demand.
Materials
C and D are in stock as the
result of previous over-buying,
and they have a restricted
use.
No
other use could be found
for material C, but the
units of material D could be used in
another
job
as substitute for 300 units
of material E, which currently costs
Rs. 5 per unit (of
which the
company
has no units in stock at the
moment).
Required:
Calculate
the relevant costs of material
for deciding whether or not
to accept the
contract.
Answer
a.
Material A is not yet owned. It
would have to be bought in
full at the replacement cost
of
Rs.
6 per unit.
b.
Material B is used regularly by the
company. There are existing
stocks (600 units) but
if
these
are used on the contract
under review a further 600
units would be bought
to
replace
them. Relevant costs are
therefore 1,000 units at the
replacement cost of Rs.
5
per
unit.
c.
1,000 units of material C are
needed and 700 are
already in stock. If used for
the contract,
a
further 300 units must be
bought at Rs. 4 each. The
existing stocks of 700 will
not be
replaced.
If they are used for
the contract, they could
not be sold at Rs. 2.50
each. The
realizable
value of these 700 units is an
opportunity cost of sales revenue
forgone.
d.
The required units of material D are
already in stock and will
not be replaced. There is
an
opportunity
cost of using D in the contract
because there are alternative
opportunities
either
to sell the existing stocks
for Rs. 6 per unit
(Rs. 1,200 in total) or avoid
other
purchases
(of material E), which would
cost 300 x Rs. 5 = Rs.
1,500. Since
substitution
for
E is more beneficial, Rs. 1,500 is
the opportunity cost.
e.
Summary of relevant costs:
Rs.
Material
A (1,000 x Rs. 6)
6,000
Material
B (1,000 x Rs. 5)
5,000
Material
C (300 x Rs. 4) plus (700 x
Rs. 2.50)
2,950
Material
D
1,500
Total
15,450
The
Relevant Cost of Labor
The
relevant cost of labor, in
different situation, is best
explained by an example:
237
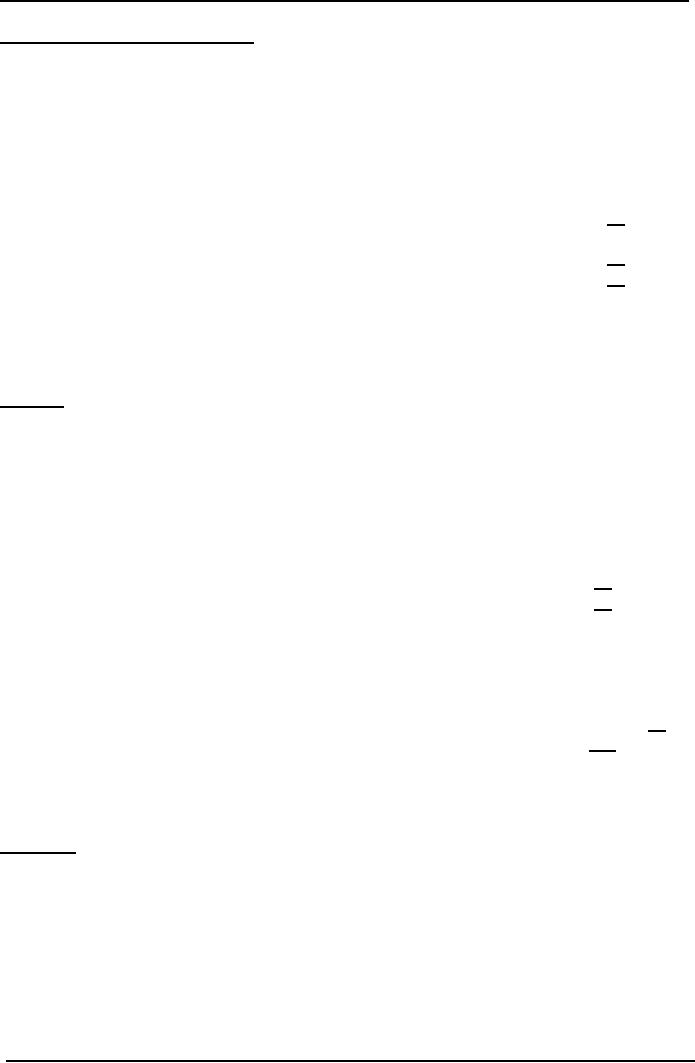
Cost
& Management Accounting
(MGT-402)
VU
Example:
Relevant Cost of Labor
LW
plc is currently deciding
whether to undertake a new contract. 15
hours of labor will
be
required
for the contract. LW plc
currently products product L,
the standard cost details of
which
are
shown below.
STANDARD
COST CARD
PRODUCT
L
Rs./Unit
Direct
Materials (10kg @ Rs. 2)
20
Direct
Labor (5 hrs @ Rs. 6)
30
50
Selling
price
72
Contribution
22
c.
What
is the relevant cost of
labor if the labor must be
hired form outside
the
organization?
d.
What
is the relevant cost of
labor if LW plc expects to
have 5 hours spare
capacity?
e.
What
is the relevant cost of
labor if labor is in short
supply?
Solution
a.
Where
labor must be hired from
outside the organization, the
relevant cost of labor
will
be
the variable costs
incurred.
Relevant
cost of labor on new
contract = 15 hours @ Rs. 6 =
Rs. 90.
b.
It
is assumed that the 5 hours
spare capacity will be paid
anyway, and so if these 5
hours
are
used on another contract,
there is no additional cost to LW
plc.
Rs.
Direct
labor (10 hours @ Rs.
6)
60
Spare
capacity (5 hours @ Rs.
0)
0
60
c.
Contribution
earned per unit of Product L
produced = Rs. 22
If
it requires 5 hours of labor to
make one unit of product L,
the contribution earned per
labor
hour
= Rs. 22/5 = Rs.
4.40.
Rs.
Direct
labor (15 hours @ Rs.
6)
90
Contribution
lost by not making product L
(Rs. 4.40 x 15 hours)
66
156
It
is important that you should
be able to identify the
relevant cost which are
appropriate to a
decision.
In many cases, this is a
fairly straightforward problem,
but there are cases where
great
care
should be taken. Attempt the
following question:
Question:
A
company has been making a machine to
order for a customer, but
the customer has since
gone
into
liquidation, and there is no prospect
that nay money will be obtained
from the winding up
of
the
company. Costs incurred to
date in manufacturing the machine
are Rs. 50,000 and
progress
payments
of Rs. 15,000 had been
received from the customer
prior to the
liquidation.
The
sales department has found
another company willing to
buy the machine for Rs.
34,000 once
it
has been completed.
To
complete the work, the
following costs would be
incurred.
a.
Materials:
These have been bought at a
cost of Rs. 6,000. They
have no other use, and
if
the
machine is not finished, they
would be sold for scrape for
Rs. 2,000.
238
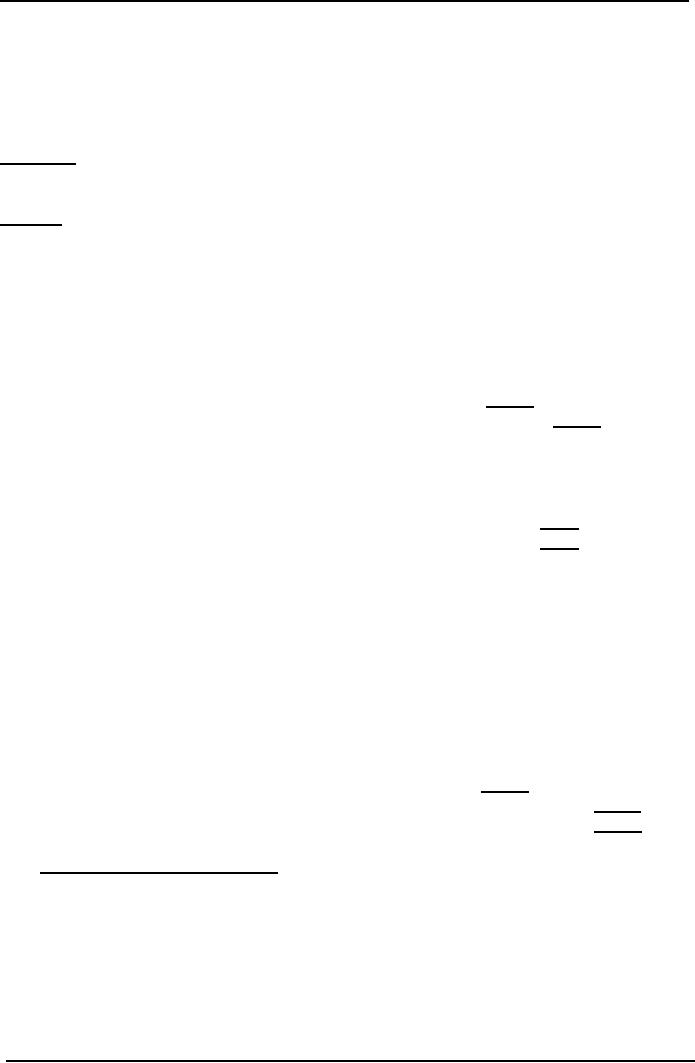
Cost
& Management Accounting
(MGT-402)
VU
b.
Further
labor costs would be Rs.
8,000. Labor is in short
supply, and if the machine
is
not
finished, the work force
would be switched to another job,
which would earn Rs.
30,000 in
revenue,
and incur direct costs of
Rs. 12,000 and absorbed
(fixed) overhead of Rs.
8,000.
c.
Consultancy
fees Rs. 4,000. If the
work is not completed, the
consultant's contract
would
be
cancelled at a cost at Rs.
1,500.
d.
General
overheads of Rs. 8,000 would
be added to the cost of the
additional work.
Required:
Assess
whether the new customer's
offer should be
accepted.
Answer:
a.
Costs
incurred in the past, or revenue
received in the past are
not relevant because
they
cannot
affect a decision about what
is best for the future.
Costs incurred to date of
Rs. 50,000 and
revenue
received of Rs. 15,000 are
`water under the bridge' and
should be ignored.
b.
Similarly,
the price paid in the
past for the materials is
irrelevant. The only
relevant cost
of
materials affecting the
decision is the opportunity
cost of the revenue from
scrap which would
be
forgone Rs.
2,000.
c.
Labor
costs Rs Labor costs required to complete
work 8,000 opportunity
costs:
Contribution
forgone by losing other work
Rs. (30,000
12,000)
18,000
Relevant
cot of labor
26,000
d.
The
incremental cost of consultancy
from completing the work is
Rs. 2,500.
Rs.
Cost
of completing work
4,000
Cost
of canceling contract
1,500
Incremental
cost of completing
work
2,500
e.
Absorbed
overhead is a national accounting
cost and should be ignored.
Actual overhead
incurred
is the only overhead cost to
consider. General overhead costs (and the
absorbed overhead
of
the alternative work for
the labor force) should be
ignored.
f.
Relevant
costs may be summarized as
follows:
Rs.
Rs.
Revenue
from completing work
34,000
Relevant
Costs:
Materials:
Opportunity
cost
2,000
Labor:
Basic
pay
8,000
Opportunity
Cost
18,000
Incremental
cost of consultant
2,500
30,500
Extra
profit to be earned by accepting
the order
3,500
The
Deprival Value of an
Asset
The
deprival value of an asset represents the
amount of money that a
company would have to
receive
if it were deprived of an asset in order
to be no worse off than it
already is.
The
deprival value of an asset is best demonstrated by
means of an example.
239
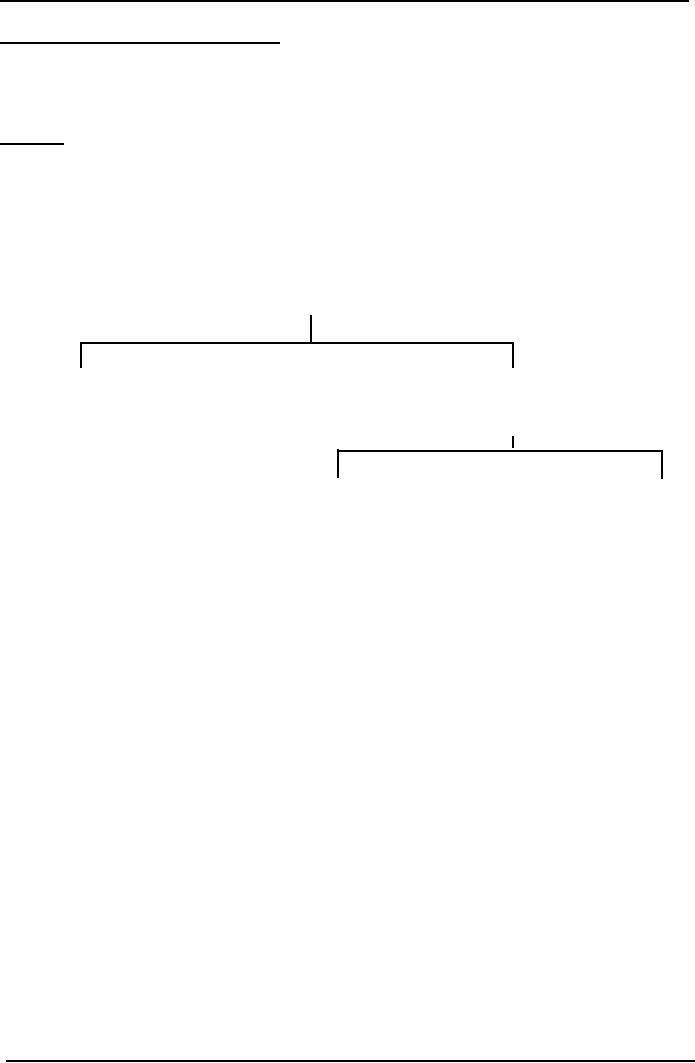
Cost
& Management Accounting
(MGT-402)
VU
Example:
Deprival Value of an
Asset
A
machine cost Rs. 14,000 ten
years ago. It is expected
that the machine will
generate future
revenues
of Rs. 10,000. Alternatively,
the machine could be scrapped
for Rs. 8,000. An
equivalent
machine
in the same condition would
cost Rs. 9,000 to buy
now. What is the deprival value of
the
machine?
Solution
Firstly,
let us think about the
relevance of the costs given to us in
the question.
Cost
of machine = Rs. 14,000 = past/sunk
cost
Future
revenues = Rs. 10,000 = revenue
expected to be generated
Net
realizable value = Rs. 8,000 =
scrap proceeds
Replacement
cost = Rs. 9,000
When
calculating the deprival value of an
asset, use the following
diagram.
Lower
of
Replacement
Revenue
Cost
Expected
(Rs.
9,000)
(Rs.
10,000)
Higher
of
NRV
(Rs.
10,000)
(Rs.
8,000)
Therefore,
the deprival value of the machine is the
lower of the replacement
cost and Rs.
10,000.
The
deprival value is therefore Rs.
9,000.
240

Cost
& Management Accounting
(MGT-402)
VU
LESSON
# 44 & 45
DECISION
MAKING
CHOICE
OF PRODUCT (PRODUCT MIX)
DECISIONS
Introduction
One
of the more common decision-making
problems is a situation where there are
not enough
resources
to meet the potential sales
demand, and so a decision
has to be made about what
mix of
products
to produce, using what resources there
are as effectively as
possible.
A
limiting factor could be
sales if there is a limit to sales
demand but any one of the
organization's
resources
(labor, materials and so on)
may be insufficient to meet
the level of
production
demanded.
It is assumed in limiting factor
accounting that management
wishes to maximize
profit
and
that profit will be maximized
when contribution is maximized (given no
change in fixed cost
expenditure
incurred). In other words, marginal
costing ideas are
applied.
Contribution
will be maximized by earning
the biggest possible
contribution from each unit
of
limiting
factor. For example if grade
A labor is the limiting
factor, contribution will e maximized
by
earning
the biggest contribution
from each hour of grade A
labor worked.
The
limiting factor decision
therefore invoices the determination of
the contribution earned
by
each
different product from each
unit of the limiting
factor.
Example:
Limiting Factor
AB
Ltd makes two products,
the Ay and the Be.
Unit variable costs are as
follows.
Ay
Be
Rs.
Rs.
Direct
Materials
1
3
Direct
Labor (Rs. 3 per
hour)
6
3
1
Variable
Overhead
1
8
7
The
sales price per unit is
Rs. 14 per Ay and Rs. 11
per Be. During July 20X2
the available direct
labor
is limited to 8,000 hours.
Sales demand in July is
expected to be 3,000 units
for Ays and
5,000
units
for Bes.
Required:
Determine
the profit-maximizing production
mix, assuming that monthly
fixed costs are
Rs.
20,000,
and that opening stocks of
finished goods and work in
progress are nil.
Solution:
Step
1.
Confirm that the limiting
factor is something other
than sales demand.
Ays
Bes
Total
Labor
hours per unit
2hrs
1hr
Sales
demand
3,000
units
5,000
units 8,000hrs
Labor
hours needed
6,000
hrs
5,000
hrs
11,000hrs
Labor
hours available
Shortfall
3,000hrs
Labor
is the limiting factor on
production.
Step
2. Identify
the contribution earned by
each product per unit of
limiting factor that
is
per
labor hour worked.
241
Cost
& Management Accounting
(MGT-402)
VU
Ays
Bes
Rs.
Rs.
Sales
price
14
11
Variable
Cost
8
7
Unit
contribution
6
4
Labor
hours per unit
2
hrs
1
hrs
Contribution
per labor hour (=unit of
limiting factor)
Rs.
3
Rs.
4
Although
Ays have a higher unit
contribution than Bes, two
Bes can be made in the
time it takes to
make
one Ay. Because labor is in
short supply it is more
profitable to make Bes than
Ays.
Step
3. Determine
the optimum production plan.
Sufficient Bes will be made
ot meet the full
sales
demand,
and the remaining labor
hours available will then be
used to make Ays.
(a).
Hours
Hours
Priority
of
Product
Demand
required
available
manufacture
1st
Bes
5,000
5,000
5,000
2nd
Ays
3,000
6,000
3,000
(bal)
11,000
8,000
(b).
Hours
Contribution
Product
Units
Total
needed
per
unit
Rs.
Rs.
Bes
5,000
5,000
4
20,000
Ays
1,500
3,000
6
9,000
8,000
29,000
Less
fixed costs
20,000
Profit
9,000
In
conclusion
a.
Unit contribution is not the
correct way to decide priorities.
b.
Labor hours are the
scarce resources, and
therefore contribution per
labor is the correct
way
to decide priorities.
The
Be earns Rs. 4 contribution
per labor hour, and
the Ay earns Rs. 3
contribution per
labor
hour. Bes therefore make
more profitable use of the
scarce resource, and should
be
manufactured
first.
Exam
Focus Point
If
an examination question asks you to
determine the optimum production
plan, follow the
five-step
approach shown below.
Step
1. Identify the limiting
factor.
Step
2. Calculate contribution per
unit for each
product.
Step
3. Calculate contribution per
unit of limiting
factor.
Step
4. Rank products (make product
with highest contribution per
unit of limiting
factor
first).
Step
5. Make products in rank
order until scare resource
is used up (optimal
production
plan).
242
Table of Contents:
- COST CLASSIFICATION AND COST BEHAVIOR INTRODUCTION:COST CLASSIFICATION,
- IMPORTANT TERMINOLOGIES:Cost Center, Profit Centre, Differential Cost or Incremental cost
- FINANCIAL STATEMENTS:Inventory, Direct Material Consumed, Total Factory Cost
- FINANCIAL STATEMENTS:Adjustment in the Entire Production, Adjustment in the Income Statement
- PROBLEMS IN PREPARATION OF FINANCIAL STATEMENTS:Gross Profit Margin Rate, Net Profit Ratio
- MORE ABOUT PREPARATION OF FINANCIAL STATEMENTS:Conversion Cost
- MATERIAL:Inventory, Perpetual Inventory System, Weighted Average Method (W.Avg)
- CONTROL OVER MATERIAL:Order Level, Maximum Stock Level, Danger Level
- ECONOMIC ORDERING QUANTITY:EOQ Graph, PROBLEMS
- ACCOUNTING FOR LOSSES:Spoiled output, Accounting treatment, Inventory Turnover Ratio
- LABOR:Direct Labor Cost, Mechanical Methods, MAKING PAYMENTS TO EMPLOYEES
- PAYROLL AND INCENTIVES:Systems of Wages, Premium Plans
- PIECE RATE BASE PREMIUM PLANS:Suitability of Piece Rate System, GROUP BONUS SYSTEMS
- LABOR TURNOVER AND LABOR EFFICIENCY RATIOS & FACTORY OVERHEAD COST
- ALLOCATION AND APPORTIONMENT OF FOH COST
- FACTORY OVERHEAD COST:Marketing, Research and development
- FACTORY OVERHEAD COST:Spending Variance, Capacity/Volume Variance
- JOB ORDER COSTING SYSTEM:Direct Materials, Direct Labor, Factory Overhead
- PROCESS COSTING SYSTEM:Data Collection, Cost of Completed Output
- PROCESS COSTING SYSTEM:Cost of Production Report, Quantity Schedule
- PROCESS COSTING SYSTEM:Normal Loss at the End of Process
- PROCESS COSTING SYSTEM:PRACTICE QUESTION
- PROCESS COSTING SYSTEM:Partially-processed units, Equivalent units
- PROCESS COSTING SYSTEM:Weighted average method, Cost of Production Report
- COSTING/VALUATION OF JOINT AND BY PRODUCTS:Accounting for joint products
- COSTING/VALUATION OF JOINT AND BY PRODUCTS:Problems of common costs
- MARGINAL AND ABSORPTION COSTING:Contribution Margin, Marginal cost per unit
- MARGINAL AND ABSORPTION COSTING:Contribution and profit
- COST VOLUME PROFIT ANALYSIS:Contribution Margin Approach & CVP Analysis
- COST VOLUME PROFIT ANALYSIS:Target Contribution Margin
- BREAK EVEN ANALYSIS MARGIN OF SAFETY:Margin of Safety (MOS), Using Budget profit
- BREAKEVEN ANALYSIS CHARTS AND GRAPHS:Usefulness of charts
- WHAT IS A BUDGET?:Budgetary control, Making a Forecast, Preparing budgets
- Production & Sales Budget:Rolling budget, Sales budget
- Production & Sales Budget:Illustration 1, Production budget
- FLEXIBLE BUDGET:Capacity and volume, Theoretical Capacity
- FLEXIBLE BUDGET:ANALYSIS OF COST BEHAVIOR, Fixed Expenses
- TYPES OF BUDGET:Format of Cash Budget,
- Complex Cash Budget & Flexible Budget:Comparing actual with original budget
- FLEXIBLE & ZERO BASE BUDGETING:Efficiency Ratio, Performance budgeting
- DECISION MAKING IN MANAGEMENT ACCOUNTING:Spare capacity costs, Sunk cost
- DECISION MAKING:Size of fund, Income statement
- DECISION MAKING:Avoidable Costs, Non-Relevant Variable Costs, Absorbed Overhead
- DECISION MAKING CHOICE OF PRODUCT (PRODUCT MIX) DECISIONS
- DECISION MAKING CHOICE OF PRODUCT (PRODUCT MIX) DECISIONS:MAKE OR BUY DECISIONS