 |

Project
Management MGMT627
VU
LESSON
31
PRICING
AND ESTIMATION
BROAD
CONTENTS
Computerized
Software Packages
Pricing
and Estimating
Global
Pricing Strategies
Types
of Estimates
Pricing
Process
31.1
COMPUTERIZED
SOFTWARE PACKAGES:
It
has been seen that
over the past ten years
there has been an explosion in
project management
software
packages. Small packages may
sell for a few thousand
dollars, whereas the price
for
larger
packages may be
$70,000.
Computerized
project management can
provide answers to such questions
as:
·
How
will the project be affected by
limited resources?
·
How
will the project be affected by a
change in the requirements?
·
What
is the cash flow for the
project (and for each
WBS element)?
·
What
is the impact of overtime?
·
What
additional resources are
needed to meet the constraints of the
project?
·
How
will a change in the priority of a
certain WBS element affect the
total project?
The
more sophisticated packages can provide
answers to schedule and cost
based on:
·
Adverse
weather conditions
·
Weekend
activities
·
Unleveled
manpower requirements
·
Variable
crew size
·
Splitting
of activities
·
Assignment
of unused resources
Regardless
of the sophistication of computer systems,
printers and plotters prefer to
draw
straight
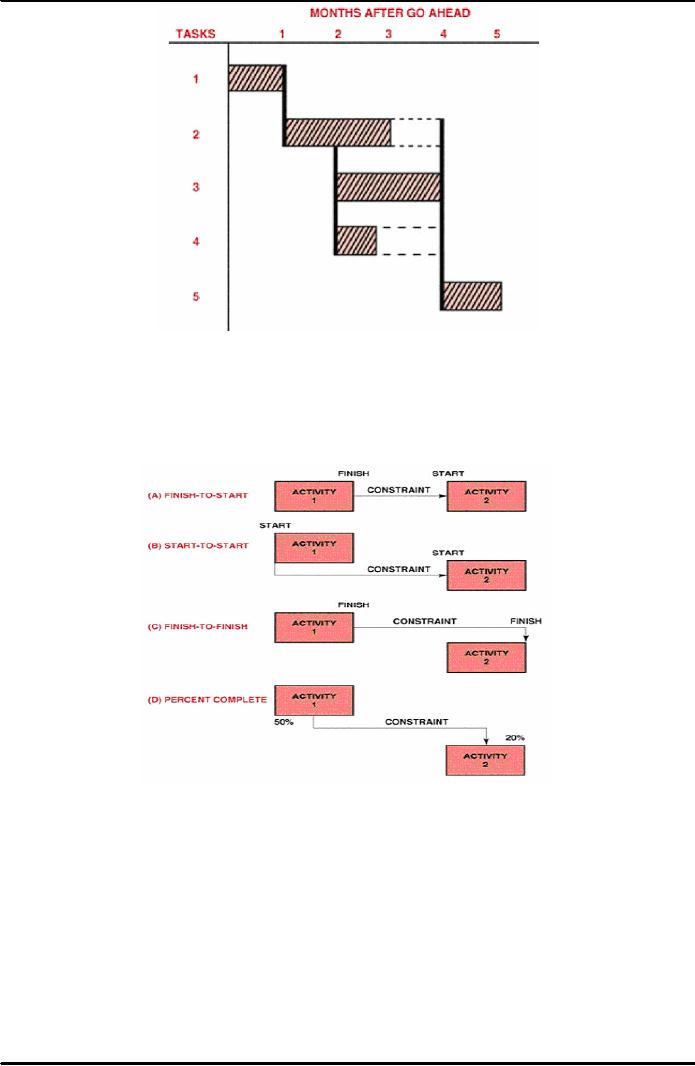
lines rather than circles. Most
software systems today use
precedence networks, as
shown
in Figure 31.1 below, which
attempt to show interrelationships on bar charts. As
shown
in
the figure, task 1 and task 2
are related because of the
solid line between them. Task 3
and
task
4 can begin when task 2 is
half finished. (This cannot be shown
easily on PERT
without
splitting
activities.) The dotted
lines indicate slack. The
critical path can be
identified either by
putting
an asterisk (*) beside the critical
elements, by making the critical
connections in a
different-colored
ink, or by making the critical
path a boldface type.
221
Project
Management MGMT627
VU
Figure
31.1: Precedence
Network
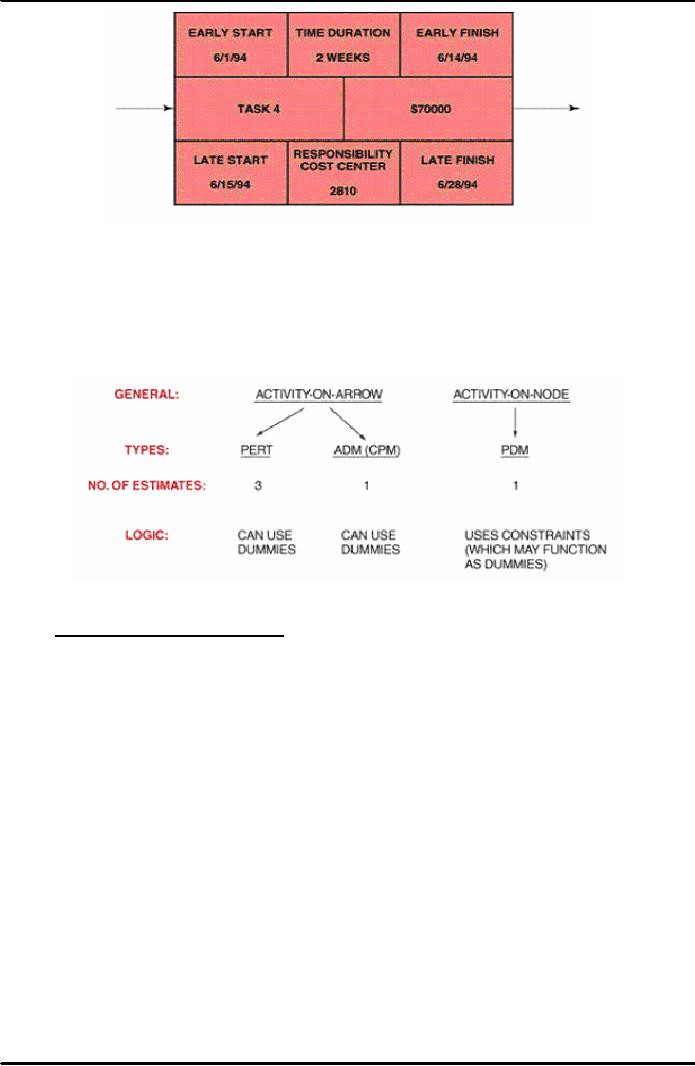
The
more sophisticated software packages
display precedence networks in the
format shown in
Figure
31.2 below. In each of these
figures, work is accomplished during the
activity. This is
sometimes
referred to as the activity-on-node method.
The arrow represents the
relationship or
constraint
between activities.
Figure
31.2: Typical
Precedence Relationships
Figure
above 31.2 (A) illustrates a
finish-to-start constraint. In this
figure, activity 2 can start
no
earlier
than the completion of activity 1.
Figure 31.2 (B) illustrates
a start-to-start constraint.
Activity
2 cannot start prior to the start of
activity 1. Figure 31.2 (C)
illustrates a finish-to-finish
constraint.
In this figure, activity 2 cannot
finish until activity 1
finishes. Lastly, Figure
31.2 (D)
illustrates
a percent-complete constraint. In this
figure, the last 20 percent of activity 2
cannot
be
started until 50 percent of activity 1
has been completed.
222
Project
Management MGMT627
VU
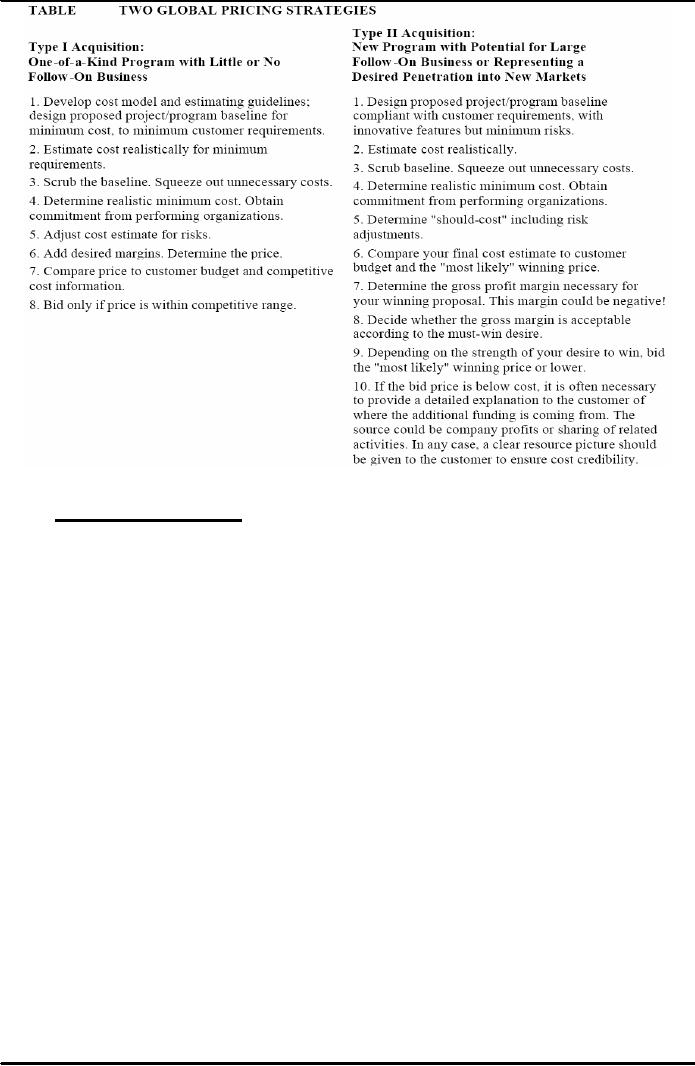
Figure
31.3: Computerized
Information Flow
Figure
31.3 above shows the typical
information that appears in
each of the activity
boxes
shown
in the previous figure. The
box identified as ''responsibility
cost center" could also
have
been
identified as the name, initials, or
badge number of the person responsible
for this activity.
Figure
31.4 below shows the comparison of three
of the different network
techniques.
Figure
31.4: Comparison of
Networks
31.2
PRICING
AND ESTIMATION:
As
we know that with the
complexities involved, it is not
surprising that many
business
managers
consider pricing an art. Having the
right intelligence information on
customer cost
budgets
and competitive pricing would
certainly help. However, the
reality is that
whatever
information
is available to one bidder is generally
available to the others. Even more
important,
intelligence
sources are often
unreliable. The only thing
worse than missing information,
is
wrong
or misleading information.
When
it comes to competitive pricing, the
old saying still applies:
"Those who talk don't
know;
and
those who know don't
talk!" It is true, partially,
that pricing remains an art.
However, a
disciplined
approach certainly helps one to develop
all the input for a rational
pricing
recommendation.
A side benefit of using a
disciplined management process is
that it leads to the
documentation
of the many factors and assumptions
involved at a later point in
time. These can
be
compared and analyzed, contributing to
the learning experiences that
make up the managerial
skills
needed for effective
business decisions.
Estimates
are not
blind
luck. They are
well-thought-out decisions based on the
best available
information,
some type of cost estimating
relationship, or some type of
cost model. Cost
estimating
relationships (CERs) are
generally the output of cost models.
Typical CERs might
be:
·
Mathematical
equations based on regression
analysis
·
Costquantity
relationships such as learning
curves
223

Project
Management MGMT627
VU
·
Costcost
relationships
·
Costnoncost
relationships based on physical
characteristics, technical parameters,
or
performance
characteristics
31.3
GLOBAL
PRICING STRATEGIES:
Specific
pricing strategies must be
developed for each
individual situation.
Frequently,
however,
one of two situations prevails
when one is pursuing project
acquisitions competitively.
First,
the new business opportunity
may be a one-of-a-kind program
with little or no
follow-on
potential;
a situation classified as type I
acquisition.
Second,
the new business opportunity
may be an entry point to a
larger follow-on or
repeat
business,
or may represent a planned
penetration into a new
market. This acquisition
is
classified
as type II.
Clearly,
in each case, we have specific
but different business
objectives. The objective
for type I
acquisition
is to win the program and execute it
profitably and satisfactorily
according to
contractual
agreements. The type II
objective is often to win the
program and perform
well,
thereby
gaining a foothold in a new
market segment or a new
customer community in place of
making
a profit.
Accordingly,
each acquisition type has
its own, unique pricing
strategy, as summarized in
Table
31.1
below.
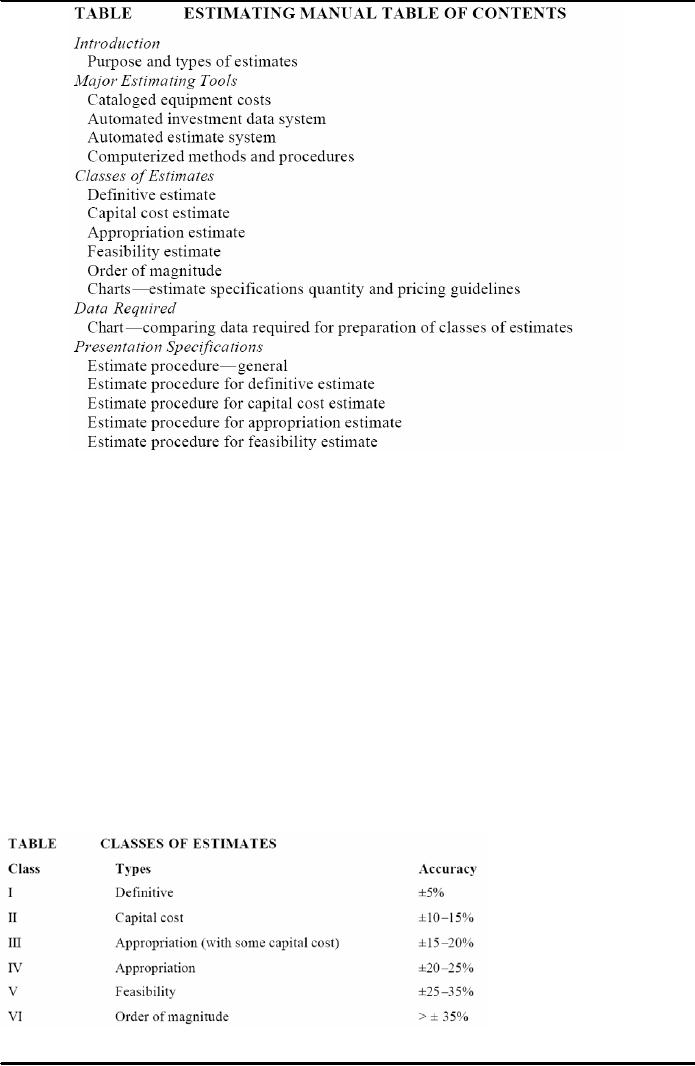
Comparing
the two pricing strategies
for the two global
situations (as shown in Table
below)
reveals
a great deal of similarity for the
first five points. The
fundamental difference is that
for a
profitable
new business acquisition the
bid price is determined
according to actual cost,
whereas
in
a "must win" situation the
price is determined by the market
forces. It should be
emphasized
that
one of the most crucial inputs in the
pricing decision is the cost
estimate of the proposed
baseline.
The design of this baseline to the
minimum requirements should be started
early, in
accordance
with well defined ground
rules, cost models, and established cost
targets. Too often
the
baseline design is performed in parallel
with the proposal development. At the
proposal
stage
it is too late to review and
fine-tune the baseline for minimum
cost. Also, such a late
start
does
not allow much of an option
for a final bid decision.
Even if the price appears
outside the
competitive
range, it makes little sense to
terminate the proposal development. As
all the
resources
have been sent anyway, one
might just as well submit a
bid in spite of the remote
chance
of winning.
Clearly,
effective pricing begins a long
time before proposal
development. It starts
with
preliminary
customer requirements, well-understood
subtasks, and a top-down estimate
with
should-cost
targets.
This
allows the functional organization to
design a baseline to meet the customer
requirements
and
cost targets, and gives
management the time to review and
redirect the design before the
proposal
is submitted. Furthermore, it gives
management an early opportunity to
assess the
chances
of winning during the acquisition
cycle, at a point in time
when additional
resources
can
be allocated or the acquisition effort
can be terminated before too
many resources are
committed
to a hopeless effort.
The
final pricing review session
should be an integration and review of
information already
well
known
in its basic context. The
process and management tools
outlined here should help
to
provide
the framework and discipline for
deriving pricing decisions in an orderly
and effective
way.
224
Project
Management MGMT627
VU
Table
31.1: Two
Global Pricing
Strategies
31.4
TYPES
OF ESTIMATES:
Note
that projects can range from a
feasibility study, through
modification of existing
facilities,
to
complete design, procurement, and construction of a
large complex. Whatever the
project
may
be, whether large or small,
the estimate and type of information
desired may differ
radically.
The
first type of estimate is an
order-of-magnitude
analysis,
which is made without any
detailed
engineering
data. The order-of-magnitude analysis may
have an accuracy of ±35 percent
within
the
scope of the project. This
type of estimate may use
past experience (not necessarily
similar),
scale
factors, parametric curves or capacity
estimates (that is, $/# of
product or $/KW
electricity).
Next,
there is the approximate
estimate (or
top-down estimate), which is also
made without
detailed
engineering data, and may be accurate to
±15 percent. This type of
estimate is prorated
from
previous projects that are
similar in scope and
capacity, and may be titled
as estimating by
analogy,
parametric curves, rule of thumb,
and indexed cost of similar
activities adjusted for
capacity
and technology. In such a case, the
estimator may say that this
activity is 50 percent
more
difficult than a previous
(i.e., reference) activity and requires
50 percent more time, man-
hours,
dollars, materials, and so on.
The
definitive
estimate, or
grassroots buildup estimate, is prepared
from well-defined
engineering
data including (as a
minimum) vendor quotes,
fairly complete plans,
specifications,
unit
prices, and estimate to complete. The
definitive estimate, also
referred to as detailed
estimating,
has an accuracy of ±5 percent.
Another
method for estimating is the use of
learning
curves. Learning
curves are graphical
representations
of repetitive functions in which
continuous operations will lead to a
reduction in
225

Project
Management MGMT627
VU
time,
resources, and money. The
theory behind learning
curves is usually applied
to
manufacturing
operations.
Each
company may have a unique approach to
estimating. However, for
normal project
management
practices, Table 31.2 below
would suffice as a starting
point.
Table
31.2: Standard
Project Estimating
Many
companies try to standardize their
estimating procedures by developing an
estimating
manual.
The
estimating manual is then
used to price out the
effort, perhaps as much as
90
percent.
Estimating manuals usually
give better estimates than
industrial engineering
standards
because
they include groups of tasks and
take into consideration such
items as downtime,
cleanup
time, lunch, and breaks.
Table 31.3 below shows the
table of contents for a
construction
estimating
manual.
Estimating
manuals, as the name implies,
provide estimates. The
question, of course, is
"How
good
are the estimates?" Most
estimating manuals provide
accuracy limitations by defining
the
type
of estimates (shown in Table
31.4 below). Using Table
below, we can create the
next three
tables
which illustrate the use of the
estimating manual.
Not
all companies can use
estimating manuals. Estimating
manuals work best for
repetitive
tasks
or similar tasks that can
use a previous estimate adjusted by a
degree-of-difficulty factor.
Activities
such as Research and
Development do not lend
themselves to the use of
estimating
manuals
other than for benchmark,
repetitive laboratory
tests.
Proposal
managers must carefully consider
whether the estimating manual is a
viable approach.
The
literature abounds with
examples of companies that have
spent millions trying to
develop
estimating
manuals for situations that
just do not lend themselves
to the approach.
226
Project
Management MGMT627
VU
Table
31.3: Estimating
Manual Table of Contents
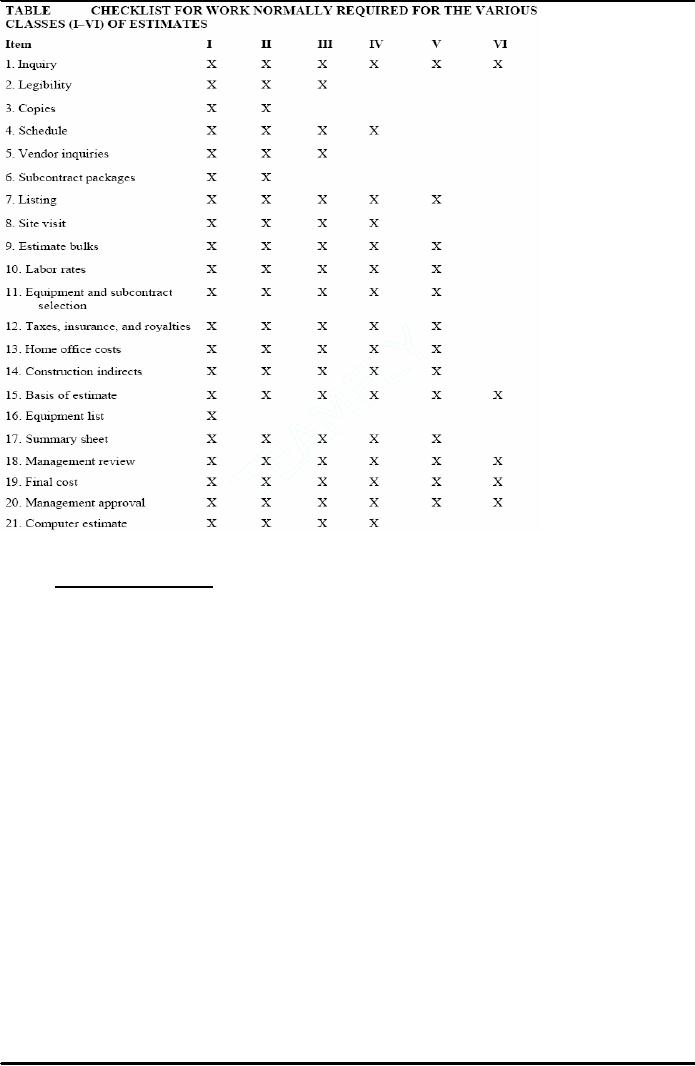
During
competitive bidding, it is important
that the type of estimate be
consistent with the
customer's
requirements. For in-house projects, the
type of estimate can vary
over the life cycle
of
a project:
·
Conceptual
Stage:
Venture
guidance or feasibility studies for the
evaluation of future work.
This estimating is
often
based on minimum-scope
information.
·
Planning
Stage:
Estimating
for authorization of partial or
full funds. These estimates
are based on
preliminary
design and scope.
·
Main
Stage:
Estimating
for detailed work.
·
Termination
Stage:
Re-estimation
for major scope changes or
variances beyond the authorization
range.
Table
31.4: Classes
of Estimates
227
Project
Management MGMT627
VU
Table
31.5: Checklist
for Work Normally Required
for the Various Classes of
Estimates
31.5
PRICING
PROCESS:
This
activity schedules the development of the
Work Breakdown Structure (WBS) and
provides
management
with two of the three operational
tools necessary for the
control of a system or
project.
The development of these two
tools is normally the responsibility of
the program office
with
input from the functional
units.
Note
that the integration of the functional
unit into the project
environment or system
occurs
through
the pricing-out of the work breakdown
structure. The total program
costs obtained by
pricing
out the activities over the
scheduled period of performance provide
management with
the
third tool necessary to successfully
manage the project. During the
pricing activities, the
functional
units have the option of consulting
program management about possible
changes in
the
activity schedules and work
breakdown structure.
228
Project
Management MGMT627
VU
229

Project
Management MGMT627
VU
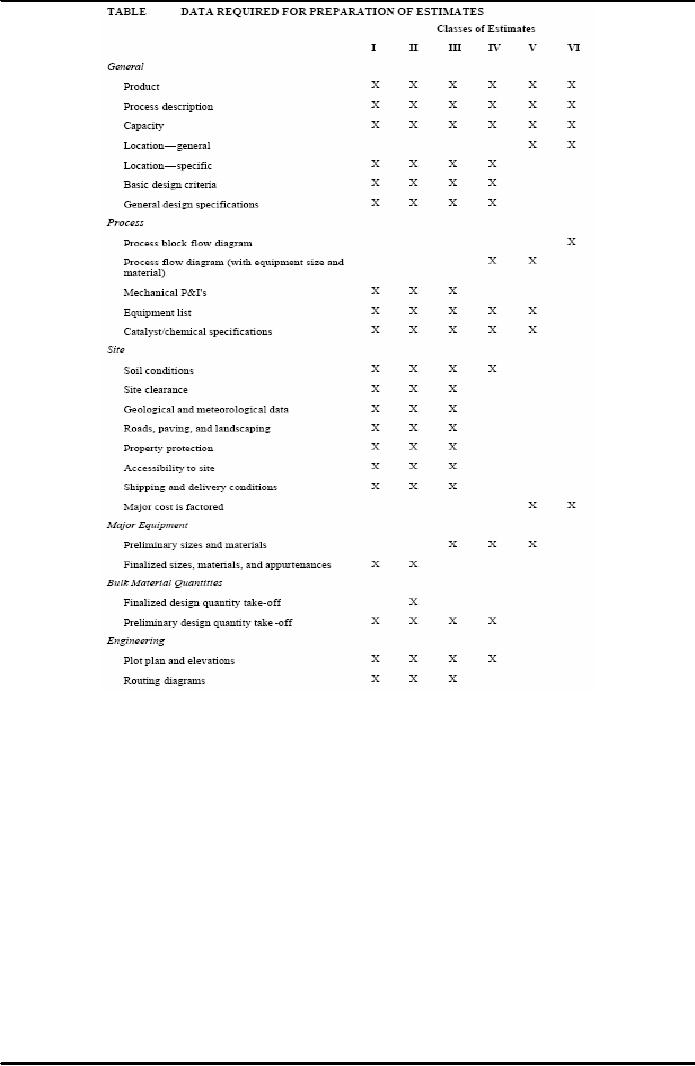
Table
31.6: Data
Required for Preparation of
Estimates
The
Work Breakdown Structure (WBS) and
activity schedules are
priced out through the
lowest
pricing
units of the company. It is the
responsibility of these pricing
units, whether they
are
sections,
departments, or divisions, to provide
accurate and meaningful cost
data (based on
historical
standards, if possible). All information is
priced out at the lowest
level of performance
required,
which, will be the task
level. Costing information is
rolled up to the project level
and
then
one step further to the total
program level.
Under
ideal conditions, the work
required (that is, man-hours) to complete a
given task can be
based
on historical standards. Unfortunately,
for many industries, projects
and programs are so
diversified
that realistic comparison between
previous activities may not
be possible. The
costing
information obtained from
each pricing unit, whether
or not it is based on
historical
standards,
should be regarded only as an estimate.
How can a company predict the
salary
structure
three years from now? What
will be the cost of raw materials
two years from
now?
Will
the business base (and
therefore overhead rates) change
over the duration of the program?
The
final response to these questions
shows that costing data
are explicitly related to
an
environment
that cannot be predicted with
any high degree of
certainty. The systems
approach
to
management, however, provides
for a more rapid response to the
environment than less
structured
approaches permit.
Remember
that once the cost data
are assembled, they must be
analyzed for their
potential
impact
on the company resources of people,
money, equipment, and facilities. It is
only through
a
total program cost analysis
that resource allocations
can be analyzed. The resource
allocation
analysis
is performed at all levels of
management, ranging from the section
supervisor to the
vice
president and general manager. For most programs, the
chief executive must approve
final
cost
data and the allocation of
resources.
Proper
analysis of the total program costs
can provide management (both
program and
corporate)
with a strategic planning model
for integration of the current
program with other
programs
in order to obtain a total corporate
strategy. Meaningful planning and
pricing models
include
analyses for monthly
man-loading schedules per department,
monthly costs per
department,
monthly and yearly total
program costs, monthly
material expenditures, and
total
program
cash-flow and man-hour requirements per
month.
230
Project
Management MGMT627
VU
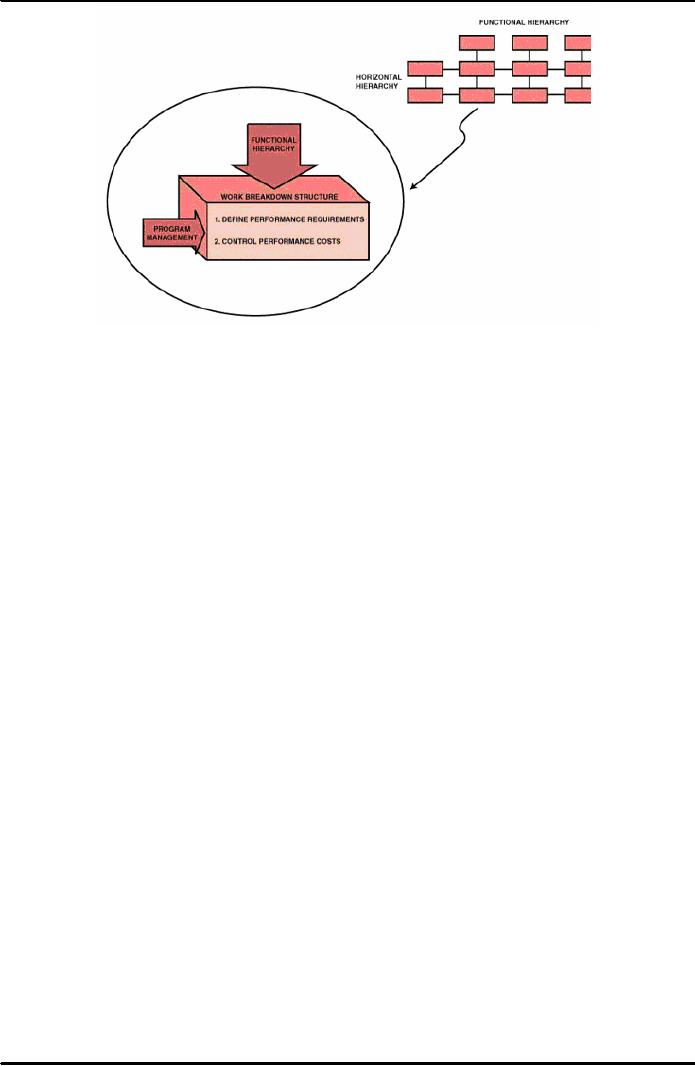
Figure
31.5: The
Vertical Horizontal
Interface
Previously
we identified several of the problems that occur at
the nodes where the horizontal
hierarchy
of program management interfaces with the
vertical hierarchy of
functional
management.
The
pricing-out of the work breakdown
structure provides the basis for
effective and open
communication
between functional and program
management where both parties have one
common
goal.
This is shown in Figure 31.5 above.
After the pricing effort is
completed, and the program is
initiated,
the work breakdown structure still
forms the basis of a communications tool
by documenting
the
performance agreed on in the pricing
effort, as well as establishing the
criteria against which
performance
costs will be
measured.
231
Table of Contents:
- INTRODUCTION TO PROJECT MANAGEMENT:Broad Contents, Functions of Management
- CONCEPTS, DEFINITIONS AND NATURE OF PROJECTS:Why Projects are initiated?, Project Participants
- CONCEPTS OF PROJECT MANAGEMENT:THE PROJECT MANAGEMENT SYSTEM, Managerial Skills
- PROJECT MANAGEMENT METHODOLOGIES AND ORGANIZATIONAL STRUCTURES:Systems, Programs, and Projects
- PROJECT LIFE CYCLES:Conceptual Phase, Implementation Phase, Engineering Project
- THE PROJECT MANAGER:Team Building Skills, Conflict Resolution Skills, Organizing
- THE PROJECT MANAGER (CONTD.):Project Champions, Project Authority Breakdown
- PROJECT CONCEPTION AND PROJECT FEASIBILITY:Feasibility Analysis
- PROJECT FEASIBILITY (CONTD.):Scope of Feasibility Analysis, Project Impacts
- PROJECT FEASIBILITY (CONTD.):Operations and Production, Sales and Marketing
- PROJECT SELECTION:Modeling, The Operating Necessity, The Competitive Necessity
- PROJECT SELECTION (CONTD.):Payback Period, Internal Rate of Return (IRR)
- PROJECT PROPOSAL:Preparation for Future Proposal, Proposal Effort
- PROJECT PROPOSAL (CONTD.):Background on the Opportunity, Costs, Resources Required
- PROJECT PLANNING:Planning of Execution, Operations, Installation and Use
- PROJECT PLANNING (CONTD.):Outside Clients, Quality Control Planning
- PROJECT PLANNING (CONTD.):Elements of a Project Plan, Potential Problems
- PROJECT PLANNING (CONTD.):Sorting Out Project, Project Mission, Categories of Planning
- PROJECT PLANNING (CONTD.):Identifying Strategic Project Variables, Competitive Resources
- PROJECT PLANNING (CONTD.):Responsibilities of Key Players, Line manager will define
- PROJECT PLANNING (CONTD.):The Statement of Work (Sow)
- WORK BREAKDOWN STRUCTURE:Characteristics of Work Package
- WORK BREAKDOWN STRUCTURE:Why Do Plans Fail?
- SCHEDULES AND CHARTS:Master Production Scheduling, Program Plan
- TOTAL PROJECT PLANNING:Management Control, Project Fast-Tracking
- PROJECT SCOPE MANAGEMENT:Why is Scope Important?, Scope Management Plan
- PROJECT SCOPE MANAGEMENT:Project Scope Definition, Scope Change Control
- NETWORK SCHEDULING TECHNIQUES:Historical Evolution of Networks, Dummy Activities
- NETWORK SCHEDULING TECHNIQUES:Slack Time Calculation, Network Re-planning
- NETWORK SCHEDULING TECHNIQUES:Total PERT/CPM Planning, PERT/CPM Problem Areas
- PRICING AND ESTIMATION:GLOBAL PRICING STRATEGIES, TYPES OF ESTIMATES
- PRICING AND ESTIMATION (CONTD.):LABOR DISTRIBUTIONS, OVERHEAD RATES
- PRICING AND ESTIMATION (CONTD.):MATERIALS/SUPPORT COSTS, PRICING OUT THE WORK
- QUALITY IN PROJECT MANAGEMENT:Value-Based Perspective, Customer-Driven Quality
- QUALITY IN PROJECT MANAGEMENT (CONTD.):Total Quality Management
- PRINCIPLES OF TOTAL QUALITY:EMPOWERMENT, COST OF QUALITY
- CUSTOMER FOCUSED PROJECT MANAGEMENT:Threshold Attributes
- QUALITY IMPROVEMENT TOOLS:Data Tables, Identify the problem, Random method
- PROJECT EFFECTIVENESS THROUGH ENHANCED PRODUCTIVITY:Messages of Productivity, Productivity Improvement
- COST MANAGEMENT AND CONTROL IN PROJECTS:Project benefits, Understanding Control
- COST MANAGEMENT AND CONTROL IN PROJECTS:Variance, Depreciation
- PROJECT MANAGEMENT THROUGH LEADERSHIP:The Tasks of Leadership, The Job of a Leader
- COMMUNICATION IN THE PROJECT MANAGEMENT:Cost of Correspondence, CHANNEL
- PROJECT RISK MANAGEMENT:Components of Risk, Categories of Risk, Risk Planning
- PROJECT PROCUREMENT, CONTRACT MANAGEMENT, AND ETHICS IN PROJECT MANAGEMENT:Procurement Cycles