 |

Project
Management MGMT627
VU
LESSON
28
NETWORK
SCHEDULING TECHNIQUES
BROAD
CONTENTS
Introduction
Benefits
and Advantages of Scheduling
Historical
Evolution of Network
Scheduling
Network
Fundamentals and Terminology
Pert/CPM
and their Difference
Graphical
Evaluation and Review Techniques
(GERT)
Dependencies
or Interrelationship
Slack
Time
28.1
Introduction:
In
today's highly competitive
environment, management is continually
seeking new and better
control
techniques to cope with the complexities,
masses of data, and tight deadlines
that are
characteristic
of many industries.
In
addition, management is seeking better
methods for presenting technical and
cost data to
customers.
Since
World War II, scheduling techniques have
taken on paramount importance. The
most
common
of these techniques are shown
below:
·
Gantt
or bar charts
·
Milestone
charts
·
Line
of balance
·
Networks
o
Program
Evaluation and Review Technique
(PERT)
o
Arrow
Diagram Method (ADM) [Sometimes called
the Critical Path Method
(CPM)]
o
Precedence
Diagram Method (PDM)
o
Graphical
Evaluation and Review Technique
(GERT)
28.2
Benefits
and Advantages of Scheduling:
The
Program
Evaluation and Review Technique
(PERT) perhaps
is the best known of all
the
relatively
new techniques. PERT has several
distinguishing characteristics:
·
It
forms the basis for all
planning and predicting and provides
management with the
ability
to
plan.
·
It
enables management for best
possible use of resources to achieve a
given goal within
time
and cost limitations.
·
It
provides visibility and enables
management to control ''one-of-a-kind"
programs as
opposed
to repetitive situations.
·
It
helps management to handle uncertainties
involved by answering the following
questions
that
provides management with a
means for evaluating
alternatives:
a)
How time delays in certain
elements influence program
completion?
b)
Where slack exists between elements?
c)
What elements are crucial to
meet the completion
date?
197

Project
Management MGMT627
VU
·
It
provides a basis for
obtaining the necessary facts
for decision making.
·
It
utilizes a time network analysis as the
basic method to determine manpower,
material,
and
capital requirements as well as providing
a means for checking
progress.
·
It
provides the basic structure for
reporting information.
·
It
reveals interdependencies of activities.
·
It
facilitates "what if"
exercises.
·
It
identifies the longest path or
critical paths.
·
It
allows us to perform scheduling
risk analysis.
The
above-mentioned benefits apply to
all network scheduling techniques,
not just PERT.
28.3
Historical
Evolution of Networks:
Before
going further with the
details, let us have an insight
into the historical evolution
of
networks.
PERT was originally
developed in 1958 and 1959
to meet the needs of the "age
of
massive
engineering" where the techniques of Taylor
and Gantt were inapplicable.
The Special
Projects
Office of the U.S. Navy,
concerned with performance trends on
large military
development
programs, introduced PERT on its Polaris
Weapon System in 1958, after
the
technique
had been developed with the
aid of the management consulting
firm of Booz, Allen,
and
Hamilton. Since that time,
PERT has spread rapidly
throughout almost all industries.
At
about
the same time the Navy was
developing PERT, the DuPont
Company initiated a
similar
technique
known as the Critical
Path Method (CPM),
which also has spread
widely, and is
particularly
concentrated in the construction and process
industries.
The
basic requirements of PERT/time as established by the
Navy, in the early 1960s, were as
follows:
·
All
of the individual tasks to complete a
given program must be
visualized in a manner
clear
enough to be put down in a
network, which comprises
events and activities; that
is,
follow
the work breakdown structure.
·
Events
and activities must be sequenced on the
network under a highly
logical set of ground
rules
that allow the determination of
important critical and sub-critical
paths. Networks can
have
up to one hundred or more events, but
not less than ten or
twenty.
·
Time
estimates must be made for
each activity of the network on a
three-way basis.
Optimistic,
most likely, and pessimistic elapsed-time
figures are estimated by the
person(s)
most
familiar with the activity
involved.
·
Critical
path and slack times are computed.
The critical path is that
sequence of activities
and
events whose accomplishment will
require the greatest expected
time.
28.3.1
Advantages of PERT:
1.
Firstly,
a major advantage of PERT is the kind of
planning required to a
major
network.
Network development and
critical path analysis
reveal
interdependencies
and problem areas that are
neither obvious nor well
defined
by
other planning methods. The
technique therefore determines where
the
greatest
effort should be made for a
project to stay on
schedule.
2.
By
using PERT one can determine the
probability of meeting
specified
deadlines
by development of alternative plans. If the
decision maker is
statistically
sophisticated, he can examine the
standard deviations and the
probability
of accomplishment data. If there exists a minimum of
uncertainty,
one
may use the single-time approach, of
course, while retaining the
advantage
of
network analysis.
3.
A
third advantage is the ability to
evaluate the effect of changes in the
program.
For
example, PERT can evaluate the
effect of a contemplated shift of
resources
198

Project
Management MGMT627
VU
from
the less critical activities to the
activities identified as
probable
bottlenecks.
Other resources and performance
trade-offs may also be
evaluated.
4.
PERT
can also evaluate the effect of a
deviation in the actual time required
for
an
activity from what had been
predicted.
5.
Lastly,
PERT allows a large amount of
sophisticated data to be presented in
a
well-organized
diagram from which both
contractor and customer can
make
joint
decisions.
Unfortunately,
PERT is not without its
disadvantages. The complexity of PERT
adds to
the
implementation problems. There exist more
data requirements for a PERT
-
organized
MCCS reporting system than
for most others. PERT,
therefore, becomes an
item
that is expensive to maintain and is
utilized most often on
large, complex
programs.
Many
companies have taken a hard
look at the usefulness of PERT on
small projects in
recent
years. The literature contains
many diversified approaches
toward applying
PERT
to other than large and
complex programs. The result
has been the PERT/LOB
procedures,
which, when applied
properly, can do the following
job:
·
Cut
project costs and reduce
time scale
·
Coordinate
and expedite planning
·
Eliminate
idle time
·
Provide
better scheduling and control of subcontractor
activities
·
Develop
better troubleshooting
procedures
·
Cut
the time required for
routine decisions, but allow more
time for decision
making
Note
that even with these
advantages, many companies
should ask themselves
whether
they
actually need PERT.
Incorporation of PERT may not be
easy, even if canned
software
packages are available. One
of the biggest problems with
incorporating PERT
occurred
in the 1960s when the Department of
Defense requested that its
customers
adopt
PERT/cost for relating cost
and schedules. This resulted in the
expenditure of
considerable
cost and effort on behalf of the
contractor to overcome the numerous
cost-
accounting
problems. Many contractors eventually
went to two sets of books;
one set
was
for program control (which
was in compliance with
standard company cost
control
procedures),
and a second set was created
for customer reporting.
Therefore, before
accepting
a PERT system, management
must perform a trade-off
study to determine if
the
results are worth the
cost.
28.3.2
Criticism of PERT:
The
criticism that most people
discover when using PERT
includes:
·
Time
and labor intensive effort is
required.
·
Upper-level
management decision-making ability is
reduced.
·
There
exists a lack of functional ownership in
estimates.
·
There
exists a lack of historical data
for timecost
estimates.
·
The
assumption of unlimited resources may be
inappropriate.
·
There
may exist the need for
too much detail.
28.4
Network
Fundamentals and
Terminology:
It
is important to know that the
major discrepancy with Gantt,
milestone, or bubble charts is
the
inability
to show the interdependencies between events and
activities. These
interdependencies
199
Project
Management MGMT627
VU
must
be identified so that a master
plan can be developed that
provides an up-to-date picture
of
operations
at all times and is easily understood by
all.
The
interdependencies are shown through the
construction of networks. Network
analysis can
provide
valuable information for
planning, integration of plans, time
studies, scheduling,
and
resource
management. The primary
purpose of network planning is to
eliminate the need
for
crisis
management by providing a pictorial
representation of the total
program.
The
following management information
can be obtained from such a
representation:
·
Interdependencies
of activities
·
Project
completion time
·
Impact
of late starts
·
Impact
of early starts
·
Trade-offs
between resources and
time
·
"What
if" exercises
·
Cost
of a crash program
·
Slippages
in planning/performance
·
Evaluation
of performance
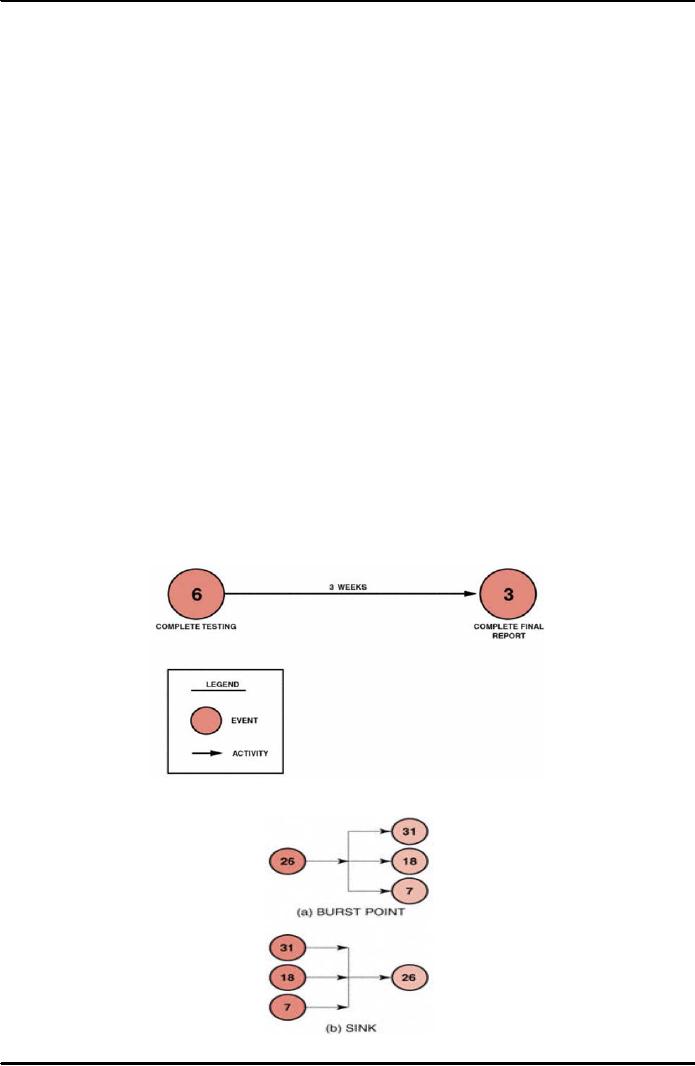
As
we know that networks are
composed of events and activities. An
event is defined as the
starting
or ending point for a group
of activities, and an activity is the
work required to
proceed
from
one event or point in time to
another. Figure 28.1 below
shows the standard nomenclature
for
PERT networks. The circles represent
events, and arrows represent activities.
The numbers
in
the circles signify the specific events
or accomplishments. The number over the
arrow
specifies
the time needed (hours, days, months), to
go from event 6 to event 3.
The events need
not
be numbered in any specific order.
However, event 6 must take
place before event 3 can
be
completed
(or begin).
Figure
28.1: Standard PERT
Nomenclature
Figure
28.2: PERT
Sources (Burst Points) and
Sinks
200
Project
Management MGMT627
VU
As
depicted in Figure 28.2 (a)
above, event 26 must take place
prior to events 7, 18, and
31. In
Figure
28.2 (b), the opposite holds
true, and events 7, 18, and 31
must take place prior to
event
26.
Thus, it is similar to "and gates" used
in logic diagrams.
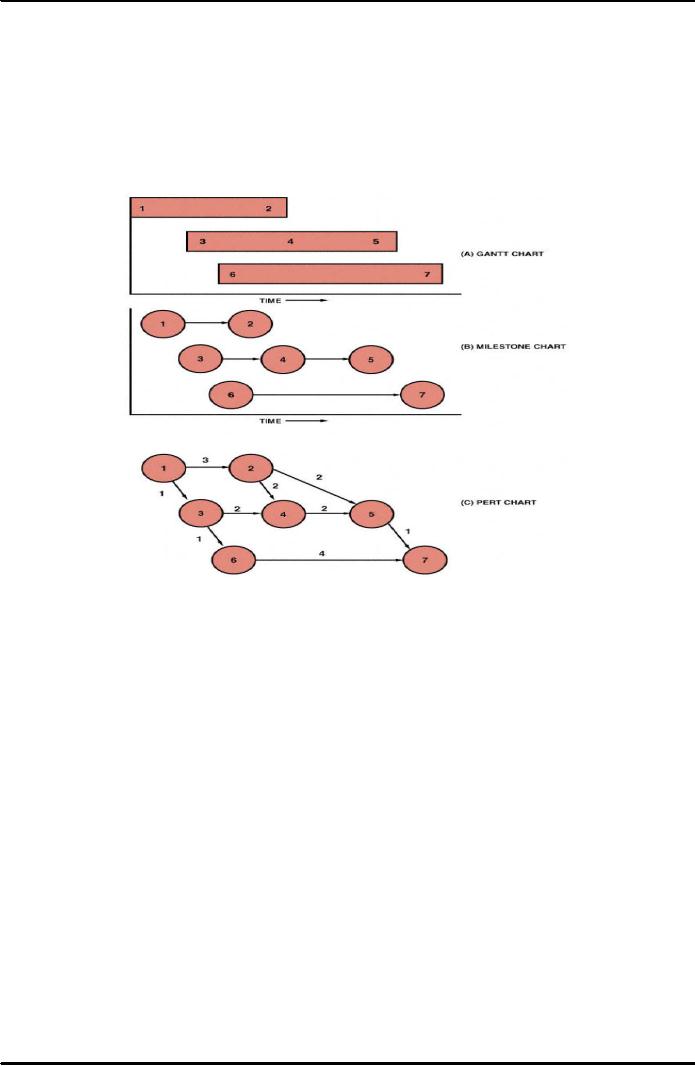
However,
these charts can be used to
develop the PERT network, as shown in
Figure 28.3
below.
The bar chart in Figure (A)
below can be converted to the
milestone chart in Figure
(B)
below.
By then defining the relationship between the
events on different bars in the
milestone
chart,
we can construct the PERT chart in Figure
(C) below.
Figure
28.3: Conversion
from Bar Chart to PERT
Chart
Basically
PERT is a management planning and control
tool. It can be considered as a road
map
for
a particular program or project in
which all of the major
elements (events) have been
completely
identified together with
their corresponding interrelations.
PERT charts are
often
constructed
from back to front because,
for many projects, the end date is
fixed and the
contractor
has front-end
flexibility.
It
is important to note here
that one of the purposes of constructing
the PERT chart is to
determine
how much time is needed to
complete the project. PERT, therefore,
uses time as a
common
denominator to analyze those elements
that directly influence the
success of the
project,
namely, time, cost, and
performance. The construction of the
network requires two
inputs.
First, a selection must be made as to
whether the events represent the
start or the
completion
of an activity. Event completions
are generally
preferred.
201
Project
Management MGMT627
VU
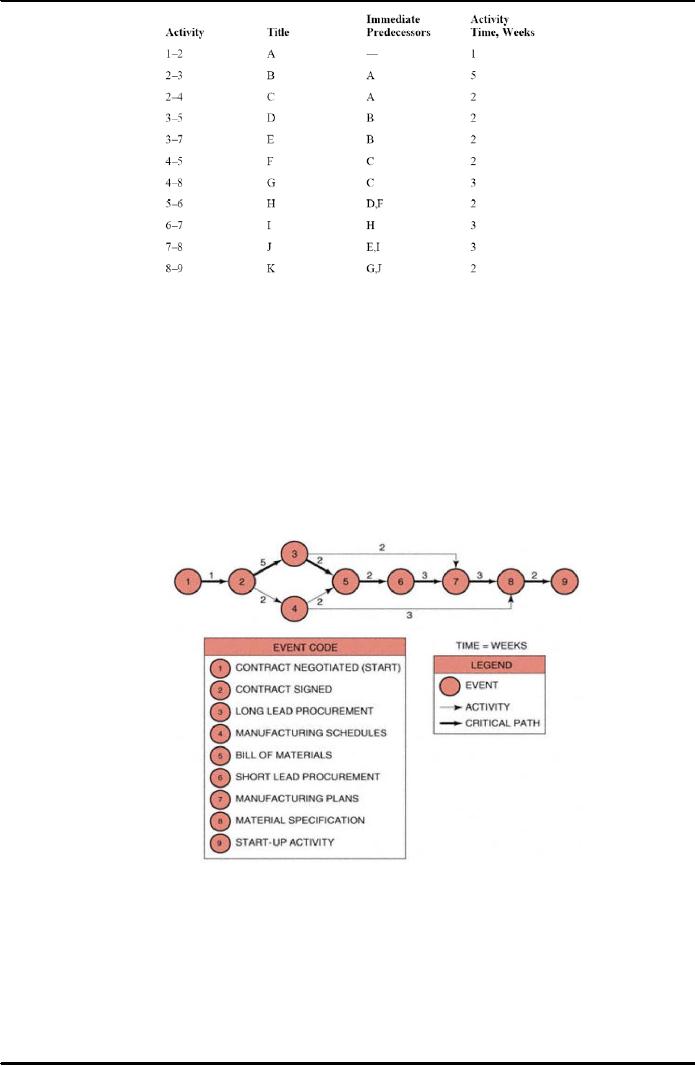
Table
28.1: Sequence
of Events
The
next step is to define the
sequence of events, as shown in Table
28.1 above, which
relates
each
event to its immediate
predecessor. Large projects can
easily be converted into
PERT
networks
once the following questions are
answered:
·
What
job immediately precedes
this job?
·
What
job immediately follows this
job?
·
What
jobs can be run
concurrently?
A
typical PERT network is shown in the
following figure
28.4.
Figure
28.4: Simplified
PERT Network
The
bold line represents the
critical path, which is established by
the longest time span
through
the
total system of events. The
critical path is composed of
events 12356789.
The
critical
path is vital for successful
control of the project because it
tells management two
things:
1.
Because
there is no slack time in any of the
events on this path, any
slippage will cause
a
corresponding slippage in the end date of
the program unless this
slippage can be
recovered
during any of the downstream events
(on the critical
path).
202

Project
Management MGMT627
VU
2.
Because
the events on this path are
the most critical for the
success of the project,
management
must take a hard look at
these events in order to
improve the total
program.
Therefore,
by using PERT we can now
identify the earliest possible dates on
which we can
expect
an event to occur, or an activity to
start or end. There is nothing
overly mysterious about
this
type of calculation, but
without a network analysis the
information might be hard to
obtain.
PERT
charts can be managed from
either the events or the activities.
For levels 13 of the
Work
Breakdown
Structure (WBS), the project manager's
prime concerns are the milestones,
and
therefore,
the events are of prime
importance. For levels
46 of the Work Breakdown
Structure
(WBS),
the project manager's concerns
are the activities.
28.5
Differences
Between PERT and
CPM:
Note
that the principles that we have
discussed so far apply not
only to PERT, but to CPM
as
well.
The nomenclature is the same for
both, and both techniques are
often referred to as
arrow
diagramming
methods, or activity-on-arrow networks.
The differences between PERT and
CPM
are
as follows:
·
PERT
uses three time estimates
(optimistic, most likely,
and pessimistic). From
these
estimates,
an expected time can be derived.
CPM uses one time
estimate that represents
the
normal
time (that is, better
estimate accuracy with
CPM).
·
PERT
is probabilistic in nature, based on a
beta distribution for each
activity time and a
normal
distribution for expected time
duration. This allows us to calculate
the "risk" in
completing
a project. CPM is based on a
single time estimate and is
deterministic in nature.
·
Both
PERT and CPM permit the use
of dummy activities in order to
develop the logic.
·
PERT
is used for Research and
Development projects where the risks in calculating
time
durations
have a high variability. CPM is
used for construction projects
that are resource
dependent
and based on accurate time
estimates.
·
PERT
is used on those projects, such as
Research and Development, where
percent
complete
is almost impossible to determine except at completed
milestones. CPM is used
for
those projects, such as construction,
where percent complete can be determined
with
reasonable
accuracy and customer
billing can be accomplished based on
percent complete.
28.6
Graphical
Evaluation And Review Technique
(GERT):
Graphical
Evaluation and Review Techniques
(GERT) are similar to PERT
but have the distinct
advantages
of allowing for looping,
branching, and multiple project end
results. With PERT
one
cannot
easily show that if a test
fails, we may have to repeat the
test several more times. With
PERT,
we cannot show that, based upon the
results of a test, we can
select one of several
different
branches to continue the project.
These problems are easily overcome
using GERT.
28.7
Dependencies
or Interrelationships:
There
are three basic types of
interrelationships or
dependencies:
1.
Mandatory
Dependencies (i.e., Hard
Logic):
These
are dependencies that cannot
change, such as erecting the
walls of a house
before
putting
up the roof.
2.
Discretionary
Dependencies (i.e., Soft
Logic):
These
are dependencies that may be
at the discretion of the project manager
or may
simply
change from project to
project. As an example, one does
not need to complete
the
entire bill of materials prior to
beginning procurement.
203

Project
Management MGMT627
VU
3.
External
Dependencies:
These
are dependencies that may be
beyond the control of the project
manager such as
having
contractors sit on your critical
path.
28.7.1
Dummy Activities:
It
is sometimes impossible to draw
network dependencies without
including dummy
activities.
Dummy activities are
artificial activities, represented by a
dotted line, and do
not
consume resources or require
time. They are added
into the network simply
to
complete
the logic.
In
the Figure 28.5 below, the
dummy activity is required to show
that D is preceded by
A
and B.
Figure
28.5: Dummy
Activity
28.8
Slack
Time:
It
is essential to know that
since there exists only one path
through the network that is
the
longest,
the other paths must be
either equal in length to or shorter
than that path.
Therefore,
there
must exist events and
activities that can be completed
before the time when they
are
actually
needed. The time
differential between the scheduled
completion date and the
required
date
to meet critical path is
referred to as the slack time. In Figure
28.4, event 4 is not on
the
crucial
path. To go from event 2 to
event 5 on the critical path requires
seven weeks taking
the
route
235. If route 245 is
taken, only four weeks
are required. Therefore,
event 4, which
requires
two weeks for completion,
should begin anywhere from
zero to three weeks after
event
2
is complete. During these three weeks,
management might find another
use for the resources
of
people, money, equipment, and
facilities required to complete event
4.
Therefore,
the critical path is vital
for resource scheduling and
allocation because the
project
manager,
with coordination from the
functional manager, can reschedule
those events not on
the
critical
path for accomplishment during
other time periods when
maximum utilization of
resources
can be achieved, provided that the
critical path time is not
extended. This type of
rescheduling
through the use of slack times provides
for a better balance of
resources
throughout
the company, and may possibly
reduce project costs by
eliminating idle or
waiting
time.
204
Table of Contents:
- INTRODUCTION TO PROJECT MANAGEMENT:Broad Contents, Functions of Management
- CONCEPTS, DEFINITIONS AND NATURE OF PROJECTS:Why Projects are initiated?, Project Participants
- CONCEPTS OF PROJECT MANAGEMENT:THE PROJECT MANAGEMENT SYSTEM, Managerial Skills
- PROJECT MANAGEMENT METHODOLOGIES AND ORGANIZATIONAL STRUCTURES:Systems, Programs, and Projects
- PROJECT LIFE CYCLES:Conceptual Phase, Implementation Phase, Engineering Project
- THE PROJECT MANAGER:Team Building Skills, Conflict Resolution Skills, Organizing
- THE PROJECT MANAGER (CONTD.):Project Champions, Project Authority Breakdown
- PROJECT CONCEPTION AND PROJECT FEASIBILITY:Feasibility Analysis
- PROJECT FEASIBILITY (CONTD.):Scope of Feasibility Analysis, Project Impacts
- PROJECT FEASIBILITY (CONTD.):Operations and Production, Sales and Marketing
- PROJECT SELECTION:Modeling, The Operating Necessity, The Competitive Necessity
- PROJECT SELECTION (CONTD.):Payback Period, Internal Rate of Return (IRR)
- PROJECT PROPOSAL:Preparation for Future Proposal, Proposal Effort
- PROJECT PROPOSAL (CONTD.):Background on the Opportunity, Costs, Resources Required
- PROJECT PLANNING:Planning of Execution, Operations, Installation and Use
- PROJECT PLANNING (CONTD.):Outside Clients, Quality Control Planning
- PROJECT PLANNING (CONTD.):Elements of a Project Plan, Potential Problems
- PROJECT PLANNING (CONTD.):Sorting Out Project, Project Mission, Categories of Planning
- PROJECT PLANNING (CONTD.):Identifying Strategic Project Variables, Competitive Resources
- PROJECT PLANNING (CONTD.):Responsibilities of Key Players, Line manager will define
- PROJECT PLANNING (CONTD.):The Statement of Work (Sow)
- WORK BREAKDOWN STRUCTURE:Characteristics of Work Package
- WORK BREAKDOWN STRUCTURE:Why Do Plans Fail?
- SCHEDULES AND CHARTS:Master Production Scheduling, Program Plan
- TOTAL PROJECT PLANNING:Management Control, Project Fast-Tracking
- PROJECT SCOPE MANAGEMENT:Why is Scope Important?, Scope Management Plan
- PROJECT SCOPE MANAGEMENT:Project Scope Definition, Scope Change Control
- NETWORK SCHEDULING TECHNIQUES:Historical Evolution of Networks, Dummy Activities
- NETWORK SCHEDULING TECHNIQUES:Slack Time Calculation, Network Re-planning
- NETWORK SCHEDULING TECHNIQUES:Total PERT/CPM Planning, PERT/CPM Problem Areas
- PRICING AND ESTIMATION:GLOBAL PRICING STRATEGIES, TYPES OF ESTIMATES
- PRICING AND ESTIMATION (CONTD.):LABOR DISTRIBUTIONS, OVERHEAD RATES
- PRICING AND ESTIMATION (CONTD.):MATERIALS/SUPPORT COSTS, PRICING OUT THE WORK
- QUALITY IN PROJECT MANAGEMENT:Value-Based Perspective, Customer-Driven Quality
- QUALITY IN PROJECT MANAGEMENT (CONTD.):Total Quality Management
- PRINCIPLES OF TOTAL QUALITY:EMPOWERMENT, COST OF QUALITY
- CUSTOMER FOCUSED PROJECT MANAGEMENT:Threshold Attributes
- QUALITY IMPROVEMENT TOOLS:Data Tables, Identify the problem, Random method
- PROJECT EFFECTIVENESS THROUGH ENHANCED PRODUCTIVITY:Messages of Productivity, Productivity Improvement
- COST MANAGEMENT AND CONTROL IN PROJECTS:Project benefits, Understanding Control
- COST MANAGEMENT AND CONTROL IN PROJECTS:Variance, Depreciation
- PROJECT MANAGEMENT THROUGH LEADERSHIP:The Tasks of Leadership, The Job of a Leader
- COMMUNICATION IN THE PROJECT MANAGEMENT:Cost of Correspondence, CHANNEL
- PROJECT RISK MANAGEMENT:Components of Risk, Categories of Risk, Risk Planning
- PROJECT PROCUREMENT, CONTRACT MANAGEMENT, AND ETHICS IN PROJECT MANAGEMENT:Procurement Cycles