 |

Cost
& Management Accounting
(MGT-402)
VU
LESSON#
3
FINANCIAL
STATEMENTS
Purpose
of preparing financial
statements
Financial
statements are prepared to demonstrate
financial results to the users of
financial
information.
These are the reports, which
are prepared by the
accounting department and
are
used
by the different people
inclusive of the
management.
According
to IASB framework:
"Financial
statements exhibit its users
the financial position,
financial performance, and
cash
inflow
and outflow analysis of an
entity."
Components
of Financial Statements
According
to IASB framework there are
five components of financial
statements:
Balance
Sheet:
Statement
of financial position at a given point
in
time.
Income
Statement:
Incomes
minus expenses for a given
time period
ending
at a specified date.
Statement
of changes in Equity:
Also
known as Statement of Retained Earnings
or
Equity
Statement.
Cash
Flows Statement:
Summarizes
inflows and outflows of cash
and cash
equivalents
for a given time period ending at
a
specified
date.
Notes
(to the accounts):
Includes
accounting policies, disclosures
and other
explanatory
information.
It
is not possible for all
the business entities to prepare
all of the components of the
financial
statements,
it depends upon the size,
nature and statutory requirements of
each of the entities
that
whether all components are
to be prepared or not.
For
example a small business entity
(like a washer man) does
not need to prepare statement
of
changes
in equity or notes to the accounts as the
size of information is very
little and not
complex
Financial
statements prepared by the Cost
Accountant
Cost
accounting department prepares
reports that help the
accounting department in preparing
final
accounts, these include;
·
Cost
of goods manufactured statement
·
Cost
of goods sold statement
Both
of the statements represent
production cost function or
the function of expenses
that are
incurred
to make the goods or
services available for sale.
It depends upon the form of
the
business
entity whether what should
be disclosed in these statements
and what should be
the
extent
of the details to be given into
these statements.
Forms
of business entities
Manufacturing
Entities
Manufacturing
entities purchase materials and
components and convert them
into finished
goods.
15
Cost
& Management Accounting
(MGT-402)
VU
Costing
department of these entities works
very much efficiently, a complete
cost accounting
system
is followed in manufacturing concerns in
which procedures of cost
accumulation,
methods
of product costing, process of calculating
per unit cost and
determining the cost
of
inventories
are defined.
Trading
Entities
Trading
entities purchase and then
sell tangible products without changing
their basic form.
Costing
department of these entities is not
involved in that much minute
calculations and
procedures.
It simply has to keep
records of the cost of goods
purchased and cost of
inventory.
Servicing
Entities
Servicing
entities provide services or intangible
products to their customers.
Costing
department of these entities is also
concerned with calculation of the
cost of service
provided.
Inventory of service is also determined
in this type of concerns.
Inventory
It
is the cost held in material &
supplies, work in process
and finished goods that
will provide
economic
benefits in future, it is also known as
stock.
Adjustment
for inventories is pivotal in
calculation of cost of goods sold.
The basic reason
for
its
adjustment is that profit
and loss account is prepared
on the basis of accrual
concept.
Adjustments
of opening and closing inventories in the
cost of production (for
manufacturing
entities),
cost of purchases (for
trading entities) is essential to match
the cost with its
revenue.
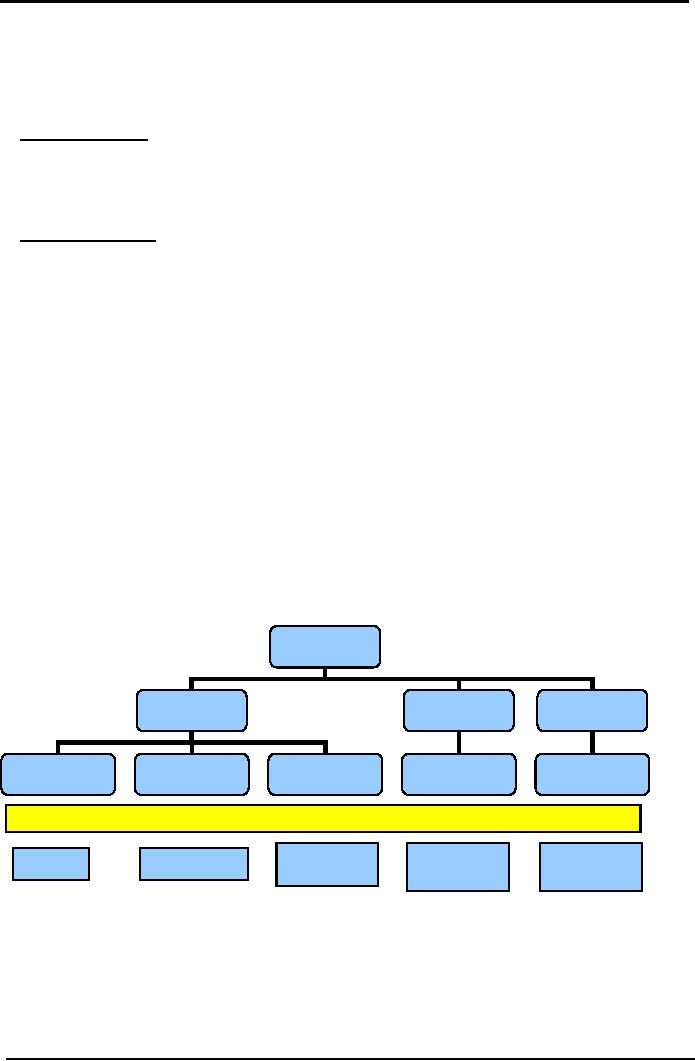
For
manufacturing entities inventories are
classified into three
categories:
1.
Material and supplies
inventory
2.
Work in process
inventory
3.
Finished goods inventory
Following
is a self explanatory chart for
different categories of
inventories.
Inventory
Manufacturing
Trading
Services
Material
& supplies
Work
In Process
Finish
Goods
Purchased
Goods
Work
In Process
Inventory
Inventory
Inventory
Inventory
Inventory
LOCATIONS
Godown/
Showroom/
Workplace/
Store
Work-shop
Warehouse
Godown
Office
16
Cost
& Management Accounting
(MGT-402)
VU
Standard
format of the cost of goods
sold statement:
Entity
Name
Cost
of Goods Sold statement
for
the year ended_______
Rupees
Direct
Material Consumed
Opening
inventory
10,000
Add
Net Purchases
100,000
Material
available for use
110,000
Less
Closing inventory
20,000
Direct
Material used
90,000
Add
Direct labor
60,000
Prime
cost
150,000
Add
Factory overhead Cost
80,000
Total
factory cost
230,000
Add
Opening Work in
process
30,000
Cost
of good to be manufactured
260,000
Less
Closing Work in process
50,000
Cost
of good manufactured
210,000
Add
Opening finish goods
100,000
Cost
of good to be sold
310,000
Less
closing finish goods
10,000
Cost
of good to sold
300,000
(Important
tip for students)
To
prepare cost of goods sold statement,
firstly one needs to collect six
elements. Three of
these
belong
to the cost and three belong
to the inventory.
Six
Elements of Cost of Goods
Manufactured and Sold
Statement
Cost
Inventory
Material
& Supplies
Material
& Supplies
Labor
Work
in Process
FOH
Finished
goods
Following
is the stepwise calculation of
the information that is produced in
the cost of goods
sold
statement:
Material
Consumed
Rupees
Direct
material opening inventory
10,000
Add
Net purchases
100,000
Material
available for use
110,000
Less
raw material closing stock
20,000
90,000
Note:
Amount of net purchases comes up with the help of
following calculation:
Purchases
of direct material
Less
trade discounts and
rebates
Less
purchases returns
Add
carriage inward
17
Cost
& Management Accounting
(MGT-402)
VU
Add
other receiving and handling
cost
Prime
Cost
Direct
material Consumed
90,000
Add
Direct labor
60,000
150,000
Total
Factory Cost
Prime
cost
150,000
Add
Factory Overhead
Indirect
material
30,000
Indirect
labor
20,000
Electricity
bill
15,000
Rent
of factory
10,000
Depreciation
of plant
5,000
80,000
230,000
Note:
Factory overhead cost includes all
production costs except direct material,
direct labor and other
direct costs,
it
is completely indirect production
cost.
PRACTICE
QUESTIONS
Q.
1
Following
data relates to Zain &
Co,
Rupees
Opening
stock of raw material
80,000
Opening
stock of work in process
51,000
Purchases
of raw material
230,000
Direct
labor cost
94,000
Factory
overheads
79,000
Closing
stock of raw material
66,000
Closing
stock of work in process
44,000
Required:
1)
Prime cost
2)
Total Factory
cost
SOLUTION:
1)
Prime cost:
Rupees
Opening
stock of raw material
80,000
Add:
Purchases of raw material
230,000
Less:
Closing stock of raw material
(66,000)
Cost
of raw material consumed
244,000
Add:
Direct labor cost
94,000
Prime
cost/Direct cost
338,000
2)
Total Factory Cost:
Prime
cost
338,000
Add:
Factory overheads
76,000
Total
Manufacturing cost/Factory
cost
407,000
18
Cost
& Management Accounting
(MGT-402)
VU
Q.
2
Usama
manufacturing company submits the
following information on June
30,2005.
Raw
material inventory, July 1,
2004
25,000
Purchases
125,000
Power,
heat and light
3,500
Indirect
material purchased and consumed
5,500
Administrative
expenses
24,000
Depreciation
of plant
18,000
Purchases
returns
7,000
Fuel
expenses
29,000
Depreciation
of building
8000
Carriage
inwards
3,500
Bad
debts
2,500
Indirect
labor
4000
Other
manufacturing expenses
15,000
Raw
materials inventory, June
30,2005
26,000
Required:
1)Cost
of raw material
consumed.
2)
Factory overhead cost
SOLUTION:
1)
Cost
of raw material
consumed:
Raw
materials inventory, July 1
2004
25,000
Add:
purchases of materials
125,000
Less:
purchase returns
(7,000)
118,000
Add:
carriage inwards
3,500
Less:
materials inventory, June
30,2005
(26,000)
Cost
of materials consumed
120,500
3)
Factory
overhead cost:
Power,
heat and light
3,500
Indirect
material purchased and consumed
5,500
Depreciation
of plant
18,000
Indirect
labor
4,000
Fuel
expenses
29,000
Other
manufacturing expenses
15,000
Total
Factory cost
75,000
Q.
3 Following
data relates to Qasim &
Co,
Opening
stock of raw material
52,000
Opening
stock of work in process
46,000
Purchases
of raw material
255,000
Direct
labor cost
85,000
Factory
overheads
76,000
Closing
stock of raw material
61,000
Closing
stock of work in process
36,000
Required:
Prepare
a statement showing total manufacturing
cost.
19

Cost
& Management Accounting
(MGT-402)
VU
SOLUTION:
Qasim
& Co.
Cost
of goods manufactured statement
Opening
stock of raw material
52,000
Add:
Purchases of raw material
255,000
Less:
Closing stock of raw material
(61,000)
Cost
of raw material consumed
246,000
Add:
Direct labor cost
85,000
Prime
cost/Direct cost
331,000
Add:
Factory overheads
76,000
Manufacturing
cost/Factory cost
407,000
Q.
4
FNS
manufacturing company submits the
following information on June
30,2005.
Sales
for the year
450,000
Raw
material inventory, July
1,2004
15,000
Finished
goods inventory, July
1,2004
70,000
Purchases
120,000
Direct
labor
65,000
Power,
heat and light
2,500
Indirect
material purchased and consumed
4,500
Administrative
expenses
21,000
Depreciation
of plant
14,000
Selling
expenses
25,000
Depreciation
of building
7,000
Bad
debts
1,500
Indirect
labor
3,000
Other
manufacturing expenses
10,000
Work
in process, July
1,2004
14,000
Work
in process, June
30,2005
19,000
Raw
materials inventory, June
30,2005
21,000
Finished
goods inventory, June
30,2005
60,000
Required
2)
Calculate
cost of raw-material consumed
3)
Calculate
prime cost
4)
Calculate
total factory cost
20
Cost
& Management Accounting
(MGT-402)
VU
SOLUTION:
FNS
manufacturing company
Cost
of goods manufactured statement
For
the year ended June 30,
2005
Raw
materials inventory, July 1
2004
15,000
Add:
purchases of materials
120,000
Less:
materials inventory, June
30,2005
(21,000)
Cost
of materials consumed
114,000
Add:
direct labor
65,000
Prime
cost/Direct cost
179,000
Factory
overheads:
Power,
heat and light
2,500
Indirect
material purchased and consumed
4,500
Depreciation
of plant
14,000
Depreciation
of plant
3,000
Other
manufacturing expenses
10,000
34,000
Total
Manufacturing cost/Factory
cost
213,000
21
Table of Contents:
- COST CLASSIFICATION AND COST BEHAVIOR INTRODUCTION:COST CLASSIFICATION,
- IMPORTANT TERMINOLOGIES:Cost Center, Profit Centre, Differential Cost or Incremental cost
- FINANCIAL STATEMENTS:Inventory, Direct Material Consumed, Total Factory Cost
- FINANCIAL STATEMENTS:Adjustment in the Entire Production, Adjustment in the Income Statement
- PROBLEMS IN PREPARATION OF FINANCIAL STATEMENTS:Gross Profit Margin Rate, Net Profit Ratio
- MORE ABOUT PREPARATION OF FINANCIAL STATEMENTS:Conversion Cost
- MATERIAL:Inventory, Perpetual Inventory System, Weighted Average Method (W.Avg)
- CONTROL OVER MATERIAL:Order Level, Maximum Stock Level, Danger Level
- ECONOMIC ORDERING QUANTITY:EOQ Graph, PROBLEMS
- ACCOUNTING FOR LOSSES:Spoiled output, Accounting treatment, Inventory Turnover Ratio
- LABOR:Direct Labor Cost, Mechanical Methods, MAKING PAYMENTS TO EMPLOYEES
- PAYROLL AND INCENTIVES:Systems of Wages, Premium Plans
- PIECE RATE BASE PREMIUM PLANS:Suitability of Piece Rate System, GROUP BONUS SYSTEMS
- LABOR TURNOVER AND LABOR EFFICIENCY RATIOS & FACTORY OVERHEAD COST
- ALLOCATION AND APPORTIONMENT OF FOH COST
- FACTORY OVERHEAD COST:Marketing, Research and development
- FACTORY OVERHEAD COST:Spending Variance, Capacity/Volume Variance
- JOB ORDER COSTING SYSTEM:Direct Materials, Direct Labor, Factory Overhead
- PROCESS COSTING SYSTEM:Data Collection, Cost of Completed Output
- PROCESS COSTING SYSTEM:Cost of Production Report, Quantity Schedule
- PROCESS COSTING SYSTEM:Normal Loss at the End of Process
- PROCESS COSTING SYSTEM:PRACTICE QUESTION
- PROCESS COSTING SYSTEM:Partially-processed units, Equivalent units
- PROCESS COSTING SYSTEM:Weighted average method, Cost of Production Report
- COSTING/VALUATION OF JOINT AND BY PRODUCTS:Accounting for joint products
- COSTING/VALUATION OF JOINT AND BY PRODUCTS:Problems of common costs
- MARGINAL AND ABSORPTION COSTING:Contribution Margin, Marginal cost per unit
- MARGINAL AND ABSORPTION COSTING:Contribution and profit
- COST VOLUME PROFIT ANALYSIS:Contribution Margin Approach & CVP Analysis
- COST VOLUME PROFIT ANALYSIS:Target Contribution Margin
- BREAK EVEN ANALYSIS MARGIN OF SAFETY:Margin of Safety (MOS), Using Budget profit
- BREAKEVEN ANALYSIS CHARTS AND GRAPHS:Usefulness of charts
- WHAT IS A BUDGET?:Budgetary control, Making a Forecast, Preparing budgets
- Production & Sales Budget:Rolling budget, Sales budget
- Production & Sales Budget:Illustration 1, Production budget
- FLEXIBLE BUDGET:Capacity and volume, Theoretical Capacity
- FLEXIBLE BUDGET:ANALYSIS OF COST BEHAVIOR, Fixed Expenses
- TYPES OF BUDGET:Format of Cash Budget,
- Complex Cash Budget & Flexible Budget:Comparing actual with original budget
- FLEXIBLE & ZERO BASE BUDGETING:Efficiency Ratio, Performance budgeting
- DECISION MAKING IN MANAGEMENT ACCOUNTING:Spare capacity costs, Sunk cost
- DECISION MAKING:Size of fund, Income statement
- DECISION MAKING:Avoidable Costs, Non-Relevant Variable Costs, Absorbed Overhead
- DECISION MAKING CHOICE OF PRODUCT (PRODUCT MIX) DECISIONS
- DECISION MAKING CHOICE OF PRODUCT (PRODUCT MIX) DECISIONS:MAKE OR BUY DECISIONS