 |

Organization
Development MGMT
628
VU
Lesson
21
Collecting
and Analyzing Diagnostic
information
Table
4: A Comparison of Different Methods of Data
Collection
A
Comparison of Different Methods of Data
Collection
Method
Major
Advantages
Major
Potential Problems
·
Responses
can be quantified ·
non-empathy
Questionnaires
·
Predetermined
and
easily summarized
·
Easy
to use with
large
questions/missing
issues
·
Over-interpretation
of data
samples
·
Relatively
inexpensive
·
Response
bias
·
Can
obtain large volume
of
data
·
adaptive-allows
data
·
Expense
Interviews
collection
on a range of ·
Bias
in interviewer responses
possible
subjects
·
coding
and interpretation
1.
Source
of "rich" data
difficulties
2.
Empathic
·
self-report
bias
3.
Process
of interviewing
can
build rapport
·
collects
data on behavior, ·
coding
and interpretation
Observations
rather
than reports of
difficulties
·
Sampling
inconsistencies
behavior
·
Real
time, not retrospective
·
Observer
bias
and
·
Adaptive
questionable
reliability
·
Expense
·
Non-reactive-
no response ·
Access
Unobtrusive
measures
and
retrieval
bias
difficulties
·
High
face validity
·
Validity
concerns
·
Easily
quantified
·
Coding
and interpretation
difficulties
Sampling:
Before
discussing how to analyze
data, the issue of sampling
needs to he emphasized. Application of
the
different
data-collection techniques invariably
raises the following questions:
"How many people should be
interviewed
and who should they be?"
"What events should be observed
and how many?" "How
many
records
should be inspected and which
ones?"
Sampling
is not an issue in many OD
cases. Because practitioners collect
interview or questionnaire
data
from
all members of the organization or department in
question, they do not have to
worry about whether
the
information
is
representative
of
the
organization
or
unit.
Sampling
becomes an issue in OD, however, when
data are collected from
selected members, behaviors,
or
records.
This is often the case when
diagnosing organization-level issues or
large systems. In these
cases, it
may
be important to ensure that the
sample of people, behaviors, or records
adequately represents the
characteristics
of the total population. For
example, a sample of fifty
employees might be used to
assess the
perceptions
of all three hundred members
of a department. A sample of production
data might be used to
evaluate
the total production of a work group. OD
practitioners often find that it is
more economical and
quicker
to gather a sampling of diagnostic
data than to collect all
possible information. If done
correctly,
the
sample can provide useful
and valid information about
the entire organization or unit.
Sampling
design involves considerable
technical detail, and consultants
may need to become familiar
with
basic
references in this area or to obtain
professional help. The first
issue to address is sample
size, or how
many
people, events, or records are
needed to carry out the
diagnosis or evaluation. This question has
no
simple
answer: the necessary sample
size is a function of population
size, the confidence desired in
the
quality
of the data, and the resources
(money and time) available
for data collection.
First,
the larger the population (for
example, number of organization members or
total number of work
outcomes)
or the more complex the client system
(for example, the number of salary
levels that must he
sampled
or the number of different functions), the more
difficult it is to establish a "right"
sample size. As

Organization
Development MGMT
628
VU
the
population increases in size
and complexity, the less
meaning one can attach to
simple measures, such
as
an overall average score on a
questionnaire item. Because the
population comprises such
different types
of
people or events, more data
are needed to ensure an
accurate representation of the
potentially different
subgroups.
Second, the larger the proportion of the
population that is selected, the
more confidence one
can
have about the quality of the
sample. If the diagnosis concerns an
issue of great importance to the
organization,
then extreme confidence may
be needed, indicative of a very large
sample size. Third,
limited
resources
constrain sample size. If
resources are limited but
the required confidence is high,
then
questionnaires
will be preferred over interviews because
more information can be
collected per member
per
dollar.
The
second issue to address is
sample selection. Probably the most
common approach to sampling
diagnostic
data in OD is a simple random sample, in
which each member, behavior,
or record has an
equal
chance
of being selected. For example,
assume that an OD practitioner
would like to select fifty
people
randomly
out of the three hundred
employees at a manufacturing plant. Using a
complete list of all
three
hundred
employees, the consultant can generate a
random sample in one of two
ways. The first method
is
to
use a random number table printed in the
back of almost any
statistics text; the consultant would
pick
out
the employees corresponding to the first
fifty numbers under three
hundred beginning anywhere in
the
table.
The second method is to pick
every sixth name (300/50 =
6) starting anywhere in the list.
If
the population is complex or many
subgroups need to be represented in the
sample, a stratified sample
may
be more appropriate than a random one. In
a stratified sample, the population of
members, events, or
records
is segregated into a number of mutually
exclusive subpopulations and a random
sample is taken
from
each subpopulation. For example,
members of an organization might be
divided into three
groups
(managers,
white-collar workers, and blue-collar
workers), and a random sample of
members, behaviors, or
records
could be selected from each
grouping to reach diagnostic
conclusions about each of the
groups.
Adequate
sampling is critical to gathering valid
diagnostic data, and the OD literature
has paid little
attention
to this issue. OD practitioners should gain
rudimentary knowledge in this area and
use
professional
help if necessary.
The
Implementation of Data
Collection:
Data
collection begins with a
decision about who to obtain
data from and how
many respondents
there
should
be. The use of interviews
may limit the number of respondents,
whereas the use of a
questionnaire
may
increase the number. Data should be collected
from several levels and
departments in the organization,
but
different questions may be
needed for each of them.
The results of a survey of OD
practitioners about
the
methods they use to gather
data are reported by Burke, Lark,
and Koopman. The one-to-one
interview
is
the most common data-gathering method,
used by 87 percent of the respondents.
Other methods
include
observation (60) percent), group
interviews (52 percent), questionnaires
(45 percent), and
existing
documents
(37 percent).The survey also
shows that practitioners normally rely on
a variety of data-
gathering
methods.
Once
an appropriate technique has been
selected, the actual data-collection program
must be
accomplished.
This includes the operational aspects of
designing, printing, distributing,
and collecting the
data-collection
instrument. Outside data-collection agents are
more effective than internal
personnel. The
use
of outside data-collection agents is
recommended because it apparently makes
respondents feel more
secure
and trusting that candid
answers will not be used
against them. There are
companies that develop
data-collection
instruments, test them and
make them available commercially.
The disadvantage is that
such
instruments
may be too generalized and
not focused enough for a
specific organization to get reliable
and
useful
data.
Once
again, confidentiality of data is a
critical issue. A small pilot
study or beta test of the
data-collection
instrument
is also a good idea. This should include
a practice analysis before the
large-scale data
collection
begins
to ensure that every
possible problem is
corrected.
The
Analysis of Data:
The
techniques for analyzing
data vary from relatively straightforward,
simple methods to
highly
sophisticated
statistical techniques. Several
important questions must be
considered before a data-collecting
method
is selected: How are the
data to be analyzed? Are they to be
analyzed statistically, and if
so, what
type
of analysis is to be used? Will the
data be processed by hand or by computer?
Will they be coded,
and
if
so how? These questions must
be taken into account prior
to data collection so that the
data can be used
to
draw inferences and
conclusions. This is especially true
with large-scale surveys or interviews,
because
the
large amount of data makes
processing a difficult task.
The analysis may include
comparisons of
different
divisions within the organization. Management
levels can also be compared.
To make
comparisons,
however, it is necessary to properly code
the surveys or interviews. "If you can't
measure it,
you
can't control it," says
Meg Whitman, CEO of eBay
Inc.

Organization
Development MGMT
628
VU
Evaluating
the Effectiveness of Data
Collection:
A
systematic data-collection program has to
establish some criteria for
how well the data meet
the
objectives
in terms of quantity and
quality. Obviously, the sample
has to be large enough sample to
enable
generalization
of results. The accuracy of the
data, that is, the degree to
which the data deviate from
the
truth,
is also an important
factor.
A
number of criteria may be used to compare
data-collection techniques. There is necessarily a
trade-off
between
data quantity and accuracy,
on the one hand, and
collection cost and time
spent collecting, on the
other.
Naturally the practitioner wants to
obtain the best available
data that can be generated
within the
given
cost and time constraints.
The following criteria lay
out some guidelines.
The
Validity of the
Data:
Probably
the most important question is:
Are we measuring and collecting
data on the dimensions that
we
intend
to measure? OD programs frequently
have to deal with difficult
subjective parameters such
as
attitudes
and values.
The
Time to Collect
Data:
How
long will it take to gather
the data using any given
technique? How much time is
available? Experience
suggests
that data collection usually
takes longer than planned.
The
Cost of Data Collection:
How
much do the data cost? A
large-scale interviewing program costs a
great deal of time and money.
The
practitioner
and the client must
determine how much money
can be spent in the data-gathering
stage. They
should
also consider the problem of
diminishing returns: What is the
minimum number of interviews
needed
for a reliable measure?
The
Organization Culture and
Norms:
The
practitioner has to decide what
techniques are best suited
to a given organization's culture and
will
yield
the most valid data given
these constraints. For
example: Are people likely to be open
and candid, or
hidden
and resistant? Does the
climate call for open
confrontation and questions or a
more indirect form
of
data gathering?
The
Hawthorne Effect in Data
Collecting:
One
of the most difficult factors to
eliminate is the so-called Hawthorne
effect--the effect the
observer
has
on the subject. The very act of
investigating and observing may influence the
behavior of those being
investigated.
One
characteristic of successful change
programs is that they gather
data about organizational
problems
before
initiating a change effort. An effective
data-collection process enables the
change effort to focus
on
specific
problems rather than rely upon a
generalized program. The data-collection
stage provides managers
and
organization members with hard data
that can he compared with
intuitive, subjective
problem
awareness.
Techniques
for Analyzing
Data:
Data
analysis techniques fall
into two broad classes:
qualitative and quantitative.
Qualitative techniques
generally
are easier to use because
they do not rely on numerical data.
That fact also makes them
easier to
understand
and interpret. Quantitative
techniques, on the other hand,
can provide more accurate
readings
of
the organizational problem.
Qualitative
Tools:
Of
the several methods for
summarizing diagnostic data in
qualitative terms, two of the
most important are
content
analysis and force-field
analysis.
Content
Analysis:
A
popular technique for
assessing qualitative data,
especially interview data, is
content analysis,
which
attempts
to summarize comments into meaningful
categories. When done well, a content
analysis can
reduce
hundreds of interview comments
into a few themes that
effectively summarize the issues
or
attitudes
of a group of respondents. The
process of content analysis can be
quite formal, and
specialized
references
describe this technique in detail. In general,
however, the process can be broken
down into three
major
steps.

Organization
Development MGMT
628
VU
First,
responses to a particular question are
read to gain familiarity
with the range of comments
made and
to
determine whether some answers
are occurring over and over
again.
Second,
based on this sampling of comments,
themes are generated that
capture recurring comments.
Themes
consolidate different responses
that say essentially the
same thing. For example, in
answering the
question
"What do you like most
about your job?" different
respondents might list their
co-workers, their
supervisors,
the new machinery, and a
good supply of tools. The
first two answers concern
the social
aspects
of work, and the second two
address the resources available
for doing the work.
Third,
the respondents' answers to a question
are then placed into
one of the categories. The
categories
with
the most responses represent
those themes that are
most often mentioned.
Force-Field
Analysis:
A
second method for analyzing
qualitative data in OD derives
from Kurt Lewin's three-step model
of
change.
Called force-field analysis, this method
organizes information pertaining to
organizational change
into
two major categories: forces
for change and forces
for maintaining the status quo or
resisting change.
Using
data collected through interviews,
observation, or unobtrusive measures, the
first step in conducting
a
force-field analysis is to develop a list
of all the forces promoting
change and all those
resisting it. Then,
based
either on the OD practitioner's personal belief or
perhaps on input from
several members of the
client
organizations a determination is made of
which of the positive and
which of the negative forces
are
most
powerful. One can either rank the
order or rate the strength of the
different forces.
Figure
27 illustrates a force-field analysis of
the performance of a work group. The
arrows represent the
forces,
and the length of the arrows
corresponds to the strength of the
forces. The information could
have
been
collected in a group interview in
which members were asked to
list those factors
maintaining the
current
level of group performance and
those factors pushing for a
higher level. Members also could
have
been
asked to judge the strength of
each force, with the average judgment
shown by the length of the
arrows.
This
analysis reveals two strong
forces pushing for higher performance:
pressures from the supervisor
of
the
group and competition from
other work groups performing
similar work. These forces
for change are
offset
by two strong forces for
maintaining the status quo: group norms
supporting present levels
of
performance
and well-learned skills that
are resistant to change.
According to Lewin, efforts to
change to a
higher
level of group performance shown by the
darker band in Figure 27 should focus on reducing
the
forces
maintaining the status quo. This might entail
changing the group's performance norms
and helping
members
to learn new skills. The
reduction of forces maintaining the
status quo is likely to
result in
organizational
change with little of the tension or
conflict typically accompanying
change caused by
increasing
the forces for
change.

Organization
Development MGMT
628
VU
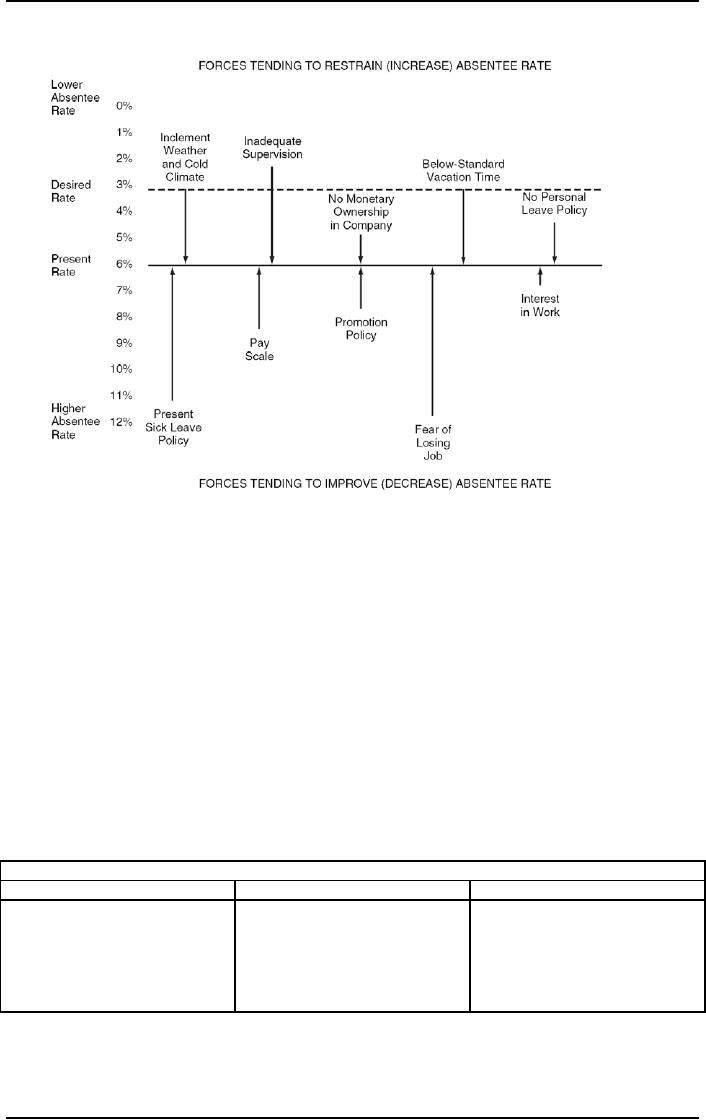
Figure
27: Force-Field Analysis of Work
Group
Performance:
An
example of how force-field
analysis can be used may be
helpful. The general manager
of a hospital
employing
300 workers and her
immediate subordinates identified the 6
percent daily absentee rate as
an
area
of concern. They determined that a 3
percent absentee rate would
be much more acceptable. In
other
words,
they found a "performance gap." After
going over the survey results
with the OD practitioner, it
was
decided to use force-field
analysis to gain an improved
diagnosis of this problem. In a
brainstorming
session,
the work team listed all of the
forces tending to restrain
and increase absenteeism.
(figure28)
The
managers made the length of the
arrows proportionate to the strength of the
forces. They had a
choice
of
several strategies to reduce the
performance gap. They could
decrease the strength of the
restraining
forces;
increase the strength of the driving
forces, or a combination of both.
Generally, if the forces
that
put
pressure on people (such as fear of
losing their job) are
increased, the tension within the system
will
also
increase, possibly bringing about
stronger resistance and unpredictable
behavior, It is often better to
increase
forces that do not put
pressure on people (for instance, a
promotion policy that is
more closely
tied
to an employee's absentee rate), to
reduce restraining forces, or to
add new driving
forces.
Organization
Development MGMT
628
VU
Fig
28: Example of the Use of
Force-Field Analysis
Quantitative
Tools:
Methods
for analyzing quantitative
data range from simple
descriptive statistics of items or
scales from
standard
instruments to more sophisticated,
multivariate analysis of the underlying
instrument properties
and
relationships among measured variables.
The most common quantitative
tools are means,
standard
deviations,
frequency distributions, scattergrams,
correlation coefficients, and difference
tests. These
measures
are routinely produced by most
statistical computer software packages.
Therefore, mathematical
calculations
are not discussed
here.
Means,
Standard Deviations, and Frequency
Distributions:
One
of the most economical and
straightforward ways to summarize
quantitative data is to compute
a
mean
and standard deviation for
each item or variable measured. These
represent the respondents'
average
score
and the spread or variability of the
responses, respectively. These
two numbers easily can
be
compared
across different measures or
subgroups. For example,
Table 5 shows the means and
standard
deviations
for six questions asked of
one hundred employees
concerning the value of different kinds
of
organizational
rewards. Based on the five-point
scale ranging from one (very
low value) to five (very
high
value),
the data suggest that
challenging work and respect
from peers are the two
most highly valued
rewards.
Monetary rewards, such as
pay and fringe benefits,
are not as highly
valued.
Table
5. Descriptive Statistics of Value of
Organizational Rewards.
Descriptive
Statistics of Value of Organizational
Rewards
Organizational
Rewards
Mean
Standard
Deviation
Challenging
work
4.6
0.79
Respect
from peers
4.4
0.81
Pay
4.0
0.71
Praise
from supervisor
4.0
1.55
Promotion
3.3
0.95
Fringe
benefits
2.7
1.14
Number
of respondents = 100
1
= very low value, 5 = very
high value
But
the mean can be a misleading
statistic. It only describes the
average value and thus
provides no
information
on the distribution of the responses.
Different patterns of responses
can produce the same

Organization
Development MGMT
628
VU
mean
score. Therefore, it is important to use
the standard deviation along with the
frequency distribution
to
gain a clearer understanding of the data.
The Frequency distribution is a
graphical method for
displaying
data
that shows the number of times a
particular response was given. For
example, the data in Table
5
suggest
that both pay and
praise from the supervisor
are equally valued with a
mean of 4.0. However,
the
standard
deviations for these two
measures are very different at
0.71 and 1.55, respectively.
Table 6 shows
the
frequency distributions of the responses
to the questions about pay
and praise from the
supervisor.
Employees'
responses to the value of pay
are distributed toward the higher
end of the scale, with no
one
rating
it of low or very low value. In
contrast, responses about the value of
praise from the supervisor
fall
into
two distinct groupings: twenty-five
employees felt that
supervisor praise has a low
or very low value,
whereas
seventy-five people rated it high or very
high. Although both rewards
have the same mean
value,
their
standard deviations and frequency
distributions suggest different
interpretations of the data.
Table
6: Frequency Distribution of Responses to
"Pay" and praise from
Supervisor" items.
Frequency
Distributions of Responses to "Pay"
and "praise from Supervisor" Items
Pay
(Mean = 4.0)
Response
Number
checking each
response
Graph
(1)
Very low vlue
0
(2)
Low value
0
(3)
Moderate value
25
Xxxxx
(4)
High value
50
Xxxxxxxxxx
(5)
Very high value
25
xxxxx
Praise
from Supervisor (Mean =
4.0)
Response
Number
checking each
response
Graph
(1)
Very low value
15
Xxx
(2)
Low value
10
Xx
(3)
Moderate value
0
(4)
High value
10
Xx
(5)
Very high value
65
xxxxxxxxxxxx
In
general, when the standard
deviation for a set of data
is high, there is considerable
disagreement over the
issue
posed by the question if the standard
deviation is small; the data
are similar on a particular
measure.
In
the example described above,
there is disagreement over the
value of supervisory praise
(some people
think
it is important but others do
not), but there is fairly
good agreement that pay is a
reward with high
value.
Scatter
grams and Correlation
Coefficients:
In
addition to describing data,
quantitative techniques also
permit OD consultants to make
inferences
about
the relationships between variables.
Scattergrams and correlation coefficients
are measures of the
strength
of a relationship between two variables.
For example, suppose the
problem being faced by an
organization
is increased conflict between the
manufacturing department and the engineering
design
department.
During the data-collection phase,
information about the number of conflicts
and change
orders
per month over the past
year is collected. The data
are shown in Table 7and
plotted in a
Scattergrams
in Fig 29.

Organization
Development MGMT
628
VU
Table
7: Relationship between Change Orders and
Conflicts
Relationship
Between Change Orders and
Conflicts
Month
Number
of Change Orders
Number
of Conflicts
April
5
5
May
12
4
June
14
3
July
6
2
August
8
3
September
20
5
October
10
2
November
2
1
December
15
4
January
8
3
February
18
4
March
10
5
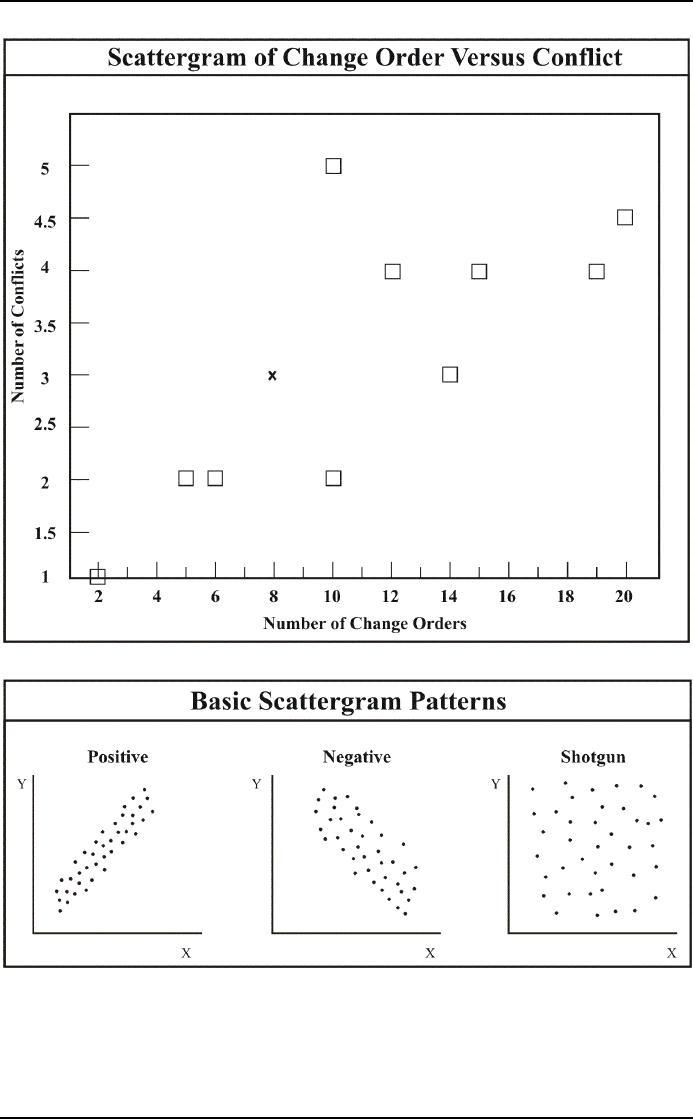
A
Scattergram is a diagram that visually
displays the relationship between two
variables; it is constructed by
locating
each case (person or event)
at the intersection of its value for
each of the two variables
being
compared.
For example, in the month of August,
there were eight change
orders and three conflicts,
whose
intersection
is shown on Figure 29as an X.
Three
basic patterns can emerge
from a Scattergram, as shown in
Fig 30. The first pattern is
called a
positive
relationship because as the values of x
increase, so do the values of y. The
second pattern is called
a
negative relationship because as the
values of x increase, the values of y
decrease. Finally, there is
the
"shotgun"
pattern wherein no relationship between the two
variables is apparent. In the example
shown in
Figure
29, an apparently strong positive relationship
exists between the number of change
orders and the
number
of conflicts between the engineering
design department and the manufacturing department.
This
suggests
that change orders may
contribute to the observed conflict
between the two
departments.
Organization
Development MGMT
628
VU
Figure
29: Scattergram of change
order versus conflict
Figure
30: Basic Scattergram
Patterns
The
correlation coefficient is simply a number
that summarizes data in a
scattergram. Its value
ranges
between
+1.0 and -1.0. A correlation
coefficient of +1.0 means
that there is a perfect, positive
relationship
between
two variables, whereas a
correlation of -1.0 signifies a perfectly
negative relationship. A
correlation
of
0 implies a "shotgun" scattergram
where there is no relationship between
two variables.

Organization
Development MGMT
628
VU
Difference
Tests:
The
final technique for
analyzing quantitative data is the
difference test. It can be used to
compare a sample
group
against some standard or
norm to determine whether the group is
above or below that
standard. It
also
can be used to determine whether
two samples are significantly
different from each other.
In the first
case,
such comparisons provide a broader
context for understanding the
meaning of diagnostic data.
They
serve
as a "basis for determining `how
good is good or how bad is
bad." Many standardized
questionnaires
have
standardized scores based on the
responses of large groups of people. It
is critical, however, to choose
a
comparison group that is
similar to the organization being diagnosed.
For example, if one
hundred
engineers
take a standardized attitude
survey, it makes little
sense to compare their
scores against
standard
scores
representing married males
from across the country. On the
other hand, industry-specific data
are
available;
a comparison of sales per
employee (as a measure of
productivity) against the industry
average
would
be valid and useful.
The
second use of difference tests
involves assessing whether two
(or more) groups differ
from one
another
on a particular variable, such as job
satisfaction or absenteeism. For
example, job
satisfaction
differences
between an accounting department and a
sales department can be determined with
this tool.
Given
that each group took the
same questionnaire, their
means and standard deviations
can be used to
compute
a difference score (t-score or z-score)
indicating whether the two groups
are statistically
different.
The
larger the difference score relative to the
sample size and standard
deviation for each group,
the more
likely
that one group is more
satisfied than the
other.
Difference
tests also can be used to
determine whether a group has
changed its score on job
satisfaction or
some
other variable over time. The
same questionnaire can be given to the
same group at two points
in
time.
Based on the group's means
and standard deviations at each
point in time, a difference score can
be
calculated.
The larger the score, the
more likely that the group
actually changed its job
satisfaction level.
The
calculation of difference scores can be very
helpful for diagnosis but
requires the OD practitioner to
make
certain assumptions about
how the data were collected,
these assumptions are
discussed in most
standard
statistical texts, and OD practitioners
should consult them before calculating difference
scores for
purposes
of diagnosis or evaluation.
Feeding
Back Diagnostic
Information:
Perhaps
the most important step in the
diagnostic process is feeding back
diagnostic information to
the
client
organization. Although the data may
have been collected with the
client's help, the OD practitioner
usually
is responsible for organizing and
presenting them to the client. Properly analyzed
and meaningful
data
can have an impact on organizational
change only if organization members
can use the information
to
devise
appropriate action plans. A key objective of the
feedback process is to be sure
that the client has
ownership
of the data.
As
shown in Figure 31, the success of
data feedback depends
largely on its ability to
arouse organizational
action
and to direct energy toward
organizational problem solving. Whether feedback
helps to energize the
organization
depends on the content of the feedback
data and on the process by
which they are fed back
to
organization
members.
We
now discuss criteria for developing
both the content of feedback
information and the processes
for
feeding
it back. If these criteria are
overlooked, the client is not apt to feel
ownership of the problems
facing
the organization. A flexible and
potentially powerful technique
for data feedback that
has arisen out
of
the wide use of questionnaires in OD work
is known as survey feedback.
Its central role in many
large-
scale
on efforts warrants a special
look.

Organization
Development MGMT
628
VU
Figure
31: Possible Effects of
Feedback
Determining
the Content of the
Feedback:
In
the course of diagnosing the organization, a
large amount of data is collected. In
fact, there is often
more
information
than the client needs or could
interpret in a realistic period of time.
If too many data are
fed
back,
the client may decide that
changing is impossible. Therefore, OD practitioners
need to summarize the
data
in ways that enable clients
to understand the information and
draw action implications from it.
The
techniques
for data analysis described
earlier can inform this
task. Additional criteria for determining
the
content
of diagnostic feedback are
described below.
Several
characteristics of effective feedback
data have been described in
the literature. They include the
following
nine properties:
1.
Relevant. Organization
members are likely to use
feedback data for problem
solving when they
find
the information meaningful. Including
managers and employees in the
initial data-collection
activities
can increase the relevance of the
data.

Organization
Development MGMT
628
VU
2.
Understandable.
Data
must be presented to organization members
in a form that is
readily
interpreted.
Statistical data, for
example, can be made
understandable through the use of
graphs
and
charts.
3.
Descriptive.
Feedback
data need to be linked to
real organizational behaviors if they are
to arouse
and
direct energy. The use of
examples and detailed illustrations
can help employees gain a
better
feel
for the data.
4.
Verifiable.
Feedback
data should be valid and
accurate if they are to guide action.
Thus,
the
information
should allow organization members to
verify whether the
findings
really describe
the
organization. For example, questionnaire
data might include information
about the sample of
respondents
as well as frequency distributions
for each item or measure.
Such information can
help
members
verify whether the feedback data
accurately represent organizational
events or attitudes.
5.
Timely.
Data should be
fed back to members as
quickly as possible after being collected
and
analyzed.
This will help ensure
that the information is still
valid and is linked to
members'
motivation
to examine it.
6.
Limited.
Because
people can easily become overloaded
with too much information,
feedback data
should
be limited to what employees can
realistically process at one
time.
7.
Significant.
Feedback
should be limited to those problems
that organization members can
do
something
about because it will energize them
and help direct their
efforts toward realistic
changes.
8.
Comparative.
Feedback
data can be ambiguous
without some benchmark as a
reference.
Whenever
possible, data from
comparative groups should be provided to
give organization
members
a better idea of how their
group fits into a broader
context.
9.
Un-finalized.
Feedback
is primarily a stimulus for action
and thus should spur further
diagnosis
and
problem solving. Members should be
encouraged, for example, to
use the data as a starting
point
for more in-depth discussion
of organizational issues.
Characteristics
of the Feedback
Process:
In
addition to providing effective feedback
data, it is equally important to attend
to the process by which
that
information is fed back to
people. Typically, data are
provided to organization members in a
meeting
or
series of meetings. Feedback
meetings provide a forum for
discussing the data, drawing
relevant
conclusions,
and devising preliminary action
plans. Because the data
might include sensitive material
and
evaluations
about organization members' behaviors,
people may come to the meeting
with considerable
anxiety
and fear about receiving the
feedback. This anxiety can
result in defensive behaviors
aimed at
denying
the information or providing rationales.
More positively, people can be
stimulated by the feedback
and
the hope that desired changes
will result from the
feedback meeting.
Because
people are likely to come to
feedback meetings with anxiety, fear,
and hope, OD practitioners need
to
manage the feedback process so
that constructive discussion and
problem solving occur. The
most
important
objective of the feedback process is to
ensure that organization members
own the data.
Ownership
is the opposite of resistance to change
and refers to people's
willingness to take responsibility
for
the data, their meaning, and
the consequences of using them to devise
a change strategy. If the
feedback
session
results in organization members rejecting the
data as invalid or useless,
then the motivation to
change
is lost and members will
have difficulty engaging in a meaningful
process of change.
Ownership
of the feedback data is facilitated by the
following five features of
successful feedback
processes:
1.
Motivation
to work with the data. People
need to feel that working
with the feedback
data
will
have beneficial outcomes. This
may require explicit sanction
and support from
powerful
groups
so that people feel free to raise
issues and to identify
concerns during the
feedback
sessions.
If people have little motivation to
work with the data or feel
that there is little
chance
to
use the data for change,
then the information will
not be owned by the client
system.
2.
Structure
for the meeting. Feedback
meetings need some structure
or they may degenerate
into
chaos or aimless discussion. An
agenda or outline and a
discussion leader can
usually
provide
the necessary direction. If the meeting
is not kept on track,
especially when the data
are
negative, ownership can be lost in
conversations that become
too general. When
this
happens,
the energy gained from
dealing directly with the
problem is lost.
Appropriate
attendance. Generally,
people who have common problems
and can benefit
3.
from
working together should be included in the feedback
meeting. This may involve a
fully
intact
work team or groups comprising
members from different
functional areas or
hierarchical
levels. Without proper
representation in the meeting, ownership of the
data is lost
because
participants cannot address the problem(s)
suggested by the feedback.
4.
Appropriate
power. It is
important to clarify the power possessed
by the group. Members
need
to know on which issues they
can make necessary changes,
on which they can
only

Organization
Development MGMT
628
VU
recommend
changes, and over which they
have no control. Unless
there are clear
boundaries,
members
are likely to have some
hesitation about using the feedback data
for generating action
plans.
Moreover, if the group has no power to
make changes, the feedback
meeting will
become
an empty exercise rather than a real
problem-solving session. Without the
power to
address
change, there will be little
ownership of the data.
5.
Process
help. People
in feedback meetings require assistance
in working together as a group.
When
the data are negative, there
is a natural tendency to resist the implications,
deflect the
conversation
onto safer subjects, and the
like. An OD practitioner with
group process skills
can
help members stay focused on
the subject and improve
feedback discussion,
problem
solving,
and ownership.
When
combined with effective feedback data,
these features of successful
feedback meetings
enhance
member
ownership of the data. They help to
ensure that organization members
fully discuss the
implications
of the diagnostic information and
that their conclusions are
directed toward relevant
and
feasible
organizational changes.
Table of Contents:
- The Challenge for Organizations:The Growth and Relevance of OD
- OD: A Unique Change Strategy:OD consultants utilize a behavioral science base
- What an ideal effective, healthy organization would look like?:
- The Evolution of OD:Laboratory Training, Likert Scale, Scoring and analysis,
- The Evolution of OD:Participative Management, Quality of Work Life, Strategic Change
- The Organization Culture:Adjustment to Cultural Norms, Psychological Contracts
- The Nature of Planned Change:Lewins Change Model, Case Example: British Airways
- Action Research Model:Termination of the OD Effort, Phases not Steps
- General Model of Planned Change:Entering and Contracting, Magnitude of Change
- The Organization Development Practitioner:External and Internal Practitioners
- Creating a Climate for Change:The Stabilizer Style, The Analyzer Style
- OD Practitioner Skills and Activities:Consultants Abilities, Marginality
- Professional Values:Professional Ethics, Ethical Dilemmas, Technical Ineptness
- Entering and Contracting:Clarifying the Organizational Issue, Selecting an OD Practitioner
- Diagnosing Organizations:The Process, The Performance Gap, The Interview Data
- Organization as Open Systems:Equifinality, Diagnosing Organizational Systems
- Diagnosing Organizations:Outputs, Alignment, Analysis
- Diagnosing Groups and Jobs:Design Components, Outputs
- Diagnosing Groups and Jobs:Design Components, Fits
- Collecting and Analyzing Diagnostic information:Methods for Collecting Data, Observations
- Collecting and Analyzing Diagnostic information:Sampling, The Analysis of Data
- Designing Interventions:Readiness for Change, Techno-structural Interventions
- Leading and Managing Change:Motivating Change, The Life Cycle of Resistance to Change
- Leading and managing change:Describing the Core Ideology, Commitment Planning
- Evaluating and Institutionalizing Organization Development Interventions:Measurement
- Evaluating and Institutionalizing Organization Development Interventions:Research Design
- Evaluating and Institutionalizing Organization Development Interventions
- Interpersonal and Group Process Approaches:Group Process
- Interpersonal and Group Process Approaches:Leadership and Authority, Group Interventions
- Interpersonal and Group Process Approaches:Third-Party Interventions
- Interpersonal and Group Process Approaches:Team Building, Team Building Process
- Interpersonal and Group Process Approaches:Team Management Styles
- Organization Process Approaches:Application Stages, Microcosm Groups
- Restructuring Organizations:Structural Design, Process-Based Structures
- Restructuring Organizations:Downsizing, Application Stages, Reengineering
- Employee Involvement:Parallel Structures, Multiple-level committees
- Employee Involvement:Quality Circles, Total Quality Management
- Work Design:The Engineering Approach, Individual Differences, Vertical Loading
- Performance Management:Goal Setting, Management by Objectives, Criticism of MBO
- Developing and Assisting Members:Career Stages, Career Planning, Job Pathing
- Developing and Assisting Members:Culture and Values, Employee Assistance Programs
- Organization and Environment Relationships:Environmental Dimensions, Administrative Responses
- Organization Transformation:Sharing the Vision, Three kinds of Interventions
- The Behavioral Approach:The Deep Assumptions Approach
- Seven Practices of Successful Organizations:Training, Sharing Information