 |
BASIC SQC IMPROVEMENT TOOLS:TOTAL QUALITY TOOLS DEFINED |
| << QUALITY FUNCTION DEPLOYMENT (QFD) AND OTHER TOOLS FOR IMPLEMENTATION |
| HOW QUALITY IS IMPLEMENTED? A DIALOGUE WITH A QUALITY MANAGER! >> |

Total
Quality Management
MGT510
VU
Lesson
# 36
BASIC
SQC IMPROVEMENT
TOOLS
Tools
for Continuous Improvement:
Many
tools have been created or
adapted from other
disciplines (such as operations research
and
industrial
engineering) to facilitate the process of
continuous improvement. Here we
learn the most
common
ones used in quality
improvement applications.
One
of the basic tenets of total
quality is management by facts.
Management by facts requires that
each
decision,
each solution to a problem, is
based on relevant data and
appropriate analysis. Problem
solving
and
decision making are
fundamental to total quality. On the one
hand, good decisions will decrease
the
number
of problems that occur. On the other
hand, the workplace will never be
completely problem
free.
Once
we get beyond the very small
business (in which the data
are always resident in the few
heads
involved,
anyway), most decision
points and problems will have many
impacting factors, and the
problem's
root cause or the best-course
decision will remain obscure
until valid data are
studied and
analyzed.
Collecting and analyzing data
can be difficult. The total
quality tools use will
assure better
decision
making, better solutions to problems, and
even Improvement of productivity and products
and
services.
Writing
about the use of statistical
methods in Japan, Dr.
Ishikawa said:
The
so-called seven indispensable tools . . .
that are being used by
everyone: company presidents,
company
directors, middle management, foremen,
and line workers. These
tools are also used in
a
variety
of [departments], not only in the
manufacturing [department] but
also in the [departments] of
planning,
design, marketing, purchasing, and technology."
No matter where you fit
into your
organization
today, you can use
some or all of these tools
to advantage, and they will serve
you well for
your
future prospects.
PROBLEM
SOLVING FOR TOTAL
QUALITY
If
you ask the typical manager
to describe his or her biggest
problem in today's work-place, the
response
will
probably include one or more of the
following:
·
We
spend all our time in
meetings trying to resolve
problems.
·
We
are constantly fighting problems, and
that doesn't leave us time
to do our real jobs, such
as
planning,
leading, and so
forth.
·
As
soon as we "put out one
fire," another pops
up.
·
We've
got more problems than we can
handle, and it bogs us
down.
The
actual words may vary, but the
message is the same. The
workplace can be so burdened
with
problems
that managers and others
spend so much time trying to
fix them that nothing gets done
right.
With
problem solutions leading to
process or products/service
improvement,
·
product
or service quality improves
·
costs
decrease (through less waste
and warranty action)
·
customer
satisfaction improves
·
competitiveness
improves, and
·
the
probability for success
improves
152

Total
Quality Management
MGT510
VU
Clearly
all of these outcomes are
desirable. And they are all
achievable by applying the total
quality
principles
to problem solving.
TOTAL
QUALITY TOOLS
DEFINED
Carpenters
use a kit of tools designed
for very specific functions.
Their hammers, for example,
are used
for
the driving of nails. Their
saws for the cutting of
wood. These and others enable a carpenter
to build
houses.
They are physical tools.
Total quality tools also
enable today's employees, whether engineers,
technologists,
production workers, managers, or
office staff, to do their
jobs. Virtually no one
can
function
in an organization that has
embraced total quality
without some or all of these
tools.
Unlike
those in the carpenter's kit,
these are intellectual
tools: they are not
wood and steel to be
used
with
muscle; they are tools
for collecting and displaying
information in ways to help the human
brain
grasp
thoughts and ideas. When
thoughts and ideas are
applied to physical processes, the
processes yield
better
results. When applied to
problem solving or decision
making, better solutions and decisions
are
developed.
The
seven tools discussed below
represent those generally
accepted as the basic total
quality tools. A
case
can be made that
just-in-time, statistical process
control, and quality
function deployment are
total
quality
tools. But these are more
than tools: they are
complete systems under the total
quality umbrella.
A
tool, like a hammer, exists to help do a
job. If the job includes
continuous improvement,
problem
solving,
or decision making, then
these seven tools fit the
definition. Each of these
tools is some form of
chart
for the collection and display of
specific kinds of data. Through the
collection and display
facility,
the
data become useful
information-information that can be
used to solve problems, enhance
decision
making,
keep track of work being done, even
predict future performance and problems.
The beauty of
the
charts is that they organize
data so that we can
immediately comprehend the message. This
would be
all
but impossible without the
charts, given the mountains of data
flooding today's workplace.
Tools
for Data Collection and
Analysis
Seven
simple statistically based
tools are used extensively
to gather and analyze data.
Unlike
the
seven advanced management and
planning tools, these tools
are visual in nature and
simple
enough
for anyone to understand.
These
seven basic tools of quality
are
1.
Flow-charts,
2.
Check
sheets,
3.
Histograms,
4.
Pareto
diagrams,
5.
Cause-and-Effect
diagrams,
6.
Scatter
diagrams, and
7.
Control
charts
Historically,
these tools preceded the
seven management and planning
tools and often
are
called
the "seven QC (Quality Control)
tools." The seven management
and planning tools
have
been referred to as the "new advanced
seven."
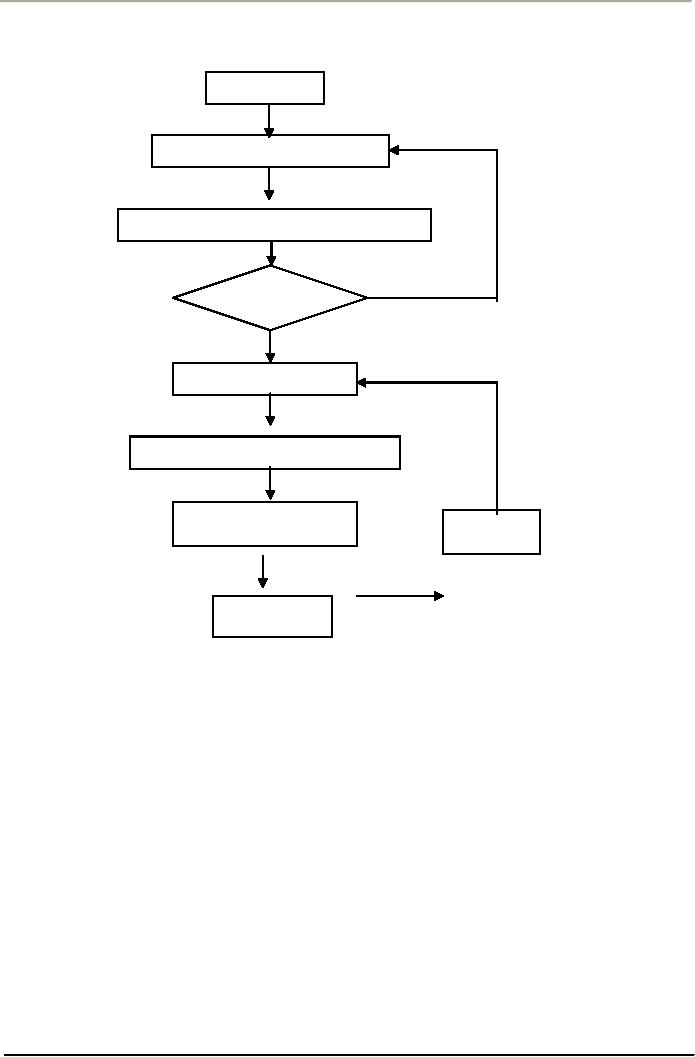
Flowcharts:
A
flowchart is a picture of a process
that shows the sequence of
steps performed. Flowcharts
are best
developed
by the people involved in the processemployees,
supervisors, managers, and customers.
A
facilitator
often is used to provide
objectivity, to ask the right questions,
and to resolve conflicts.
The
facilitator
can guide the discussion
through questions such as "What
happens next?" "Who makes
the
decision
at this point?" and "what
operation is performed
here?"
153
Total
Quality Management
MGT510
VU
Example
of a Flowchart for Training New
Printing Press Operators
Hire
Candidate
Training
with operator checklist
Safety,
quality, and procedures
testing
No
Test
d?
Yes
Four-week
evaluation
Solo
with lead operator
support
90-day
evaluation
Fail
Reevaluate
employee
Pass
Press-certifying
Flowcharts
help the people involved in the
process to understand it better. For
example,
employees
realize how they fit
into a processthat is, who their
suppliers and customers are.
By
helping
to develop a flowchart, workers
begin to feel a sense of
ownership in the process
and
become
more willing to work on improving
it. Using flowcharts to
train employees on standard
procedures
leads to more consistent
performance.
Once
a flowchart is constructed, it can be
used to identify quality problems as
well as areas for
improvement.
Questions such as "How does
this operation affect the customer?"
"Can we
improve
or element this operation?" or "Should we
control a critical quality characteristic
at this
point?"
help to identify such
opportunities. Flowcharts help
people to visualize simple
but
important
changes that could be made
in a process.
Check
Sheets
These
tools aid in data
collection. When designing a
process to collect data, one
must first ask
basic
questions such as:
·
What
question are we trying to
answer?
·
What
type of data will we need to
answer the question?
·
Where
can we find the data?
154
Total
Quality Management
MGT510
VU
·
Who
can provide the data?
·
How
can we collect the data with
minimum effort and minimum
chance of error?
Check
sheets are data collection
forms that facilitate the
interpretation of data.
Quality-related
data
are of two general typesattribute
and variable. Attribute data
are obtained by counting
or
from
some type of visual
inspection: the number of invoices that
contain errors, the number of
parts
that conform to specifications, and the
number of surface defects on an
automobile panel,
for
example. Variable data are
collected by numerical measurement on a
continuous scale.
Dimensional
characteristics such as distance,
weight, volume, and time
are common examples.
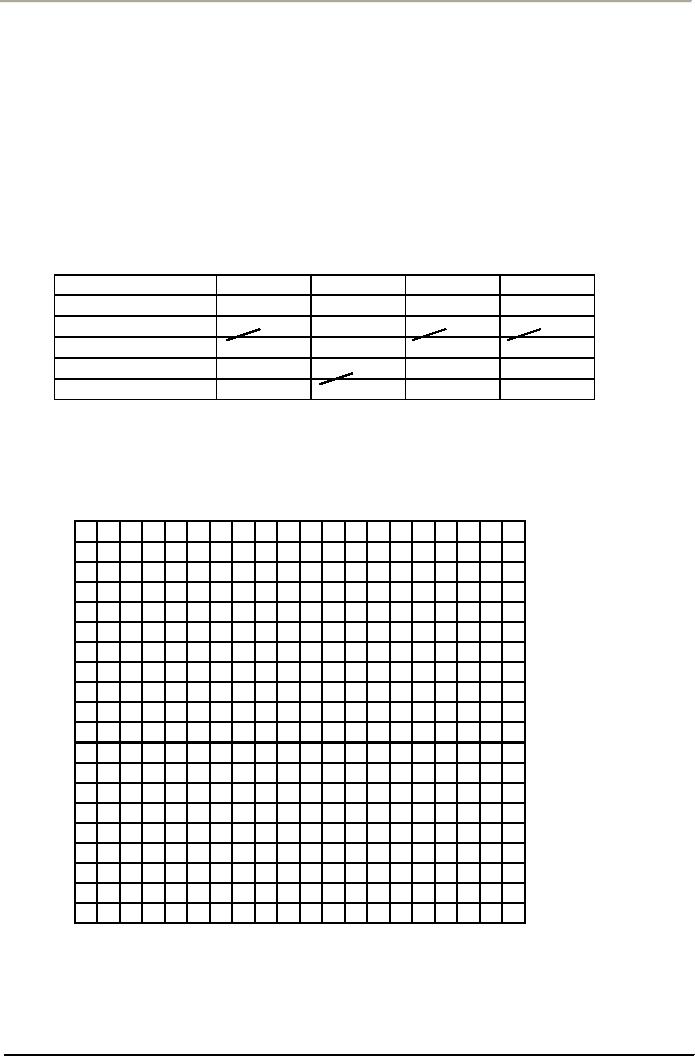
Figure
below is an example of an Attribute
data check sheet, and second
Figure below shows a
Variable
data check sheet.
Example
of a Check Sheet for Attribute
Data: Airline
Complaints
Type
Week
1
Week
2
Week
3
Week
4
⏐
⏐⏐
⏐
Lost
baggage
⏐⏐⏐
⏐
⏐⏐⏐⏐
⏐⏐⏐
⏐⏐⏐
⏐⏐⏐
Baggage
delay
⏐⏐
⏐
⏐⏐⏐
⏐
Missed
connection
⏐⏐⏐
⏐⏐⏐
⏐⏐⏐
⏐⏐⏐
Poor
cabin service
⏐
⏐
Ticketing
error
Example
of a Check Sheet for Variable
Data
Frequency
20
19
18
17
16
15
14
X
13
X
12
X
X
11
X
X
X
10
X
X
X
9
X
X
X
X
8
X
X
X
X
7
X
X
X
X
6
X
X
X
X
X
5
X
X
X
X
X
4
X
X
X
X
X
X
X
3
X
X
X
X
X
X
X
2
X
X
X
X
X
X
X
1
X
X
X
X
X
X
X
X
X
X
123456
7
8
9
10
11
12
13
14 15 16 17 18 19 20
Time
to process loan request
(days)
155
Total
Quality Management
MGT510
VU
Pareto
Diagram
The
Pareto chart is a very useful
tool wherever one needs to
separate the important from the
trivial. The
chart,
first promoted by Dr. Joseph
Juran, is named after Italian
economist/sociologist Vilfredo
Pareto
(1848-1923).
He had the insight to recognize that in the
real world a minority of
causes lead to the
majority
of problems. This is known as the Pareto
principle. Pick a category, and the
Pareto principle
will
usually hold. For example,
in a factory you will find
that of all the kinds of problems
you can name,
only
about 20% of them will produce
80% of the product defects:
80% of the cost associated
with the
defects
will be assignable to only
about 20% of the total number of defect
types occurring. Examining
the
elements of this cost will
reveal that once again
80% of the total defect costs
will spring from
only
about
20% of the cost elements.
Charts have shown that approximately
20% of the pros on the tennis
tour
reap 80% of the prize money
and that 80% of the money
supporting churches in the United
States
comes
from 20% of the church membership.
Pareto
analysis is a technique for prioritizing
types or sources of problems. Pareto analysis
separates the
"vital
few" from the "trivial many"
and provides help in selecting directions
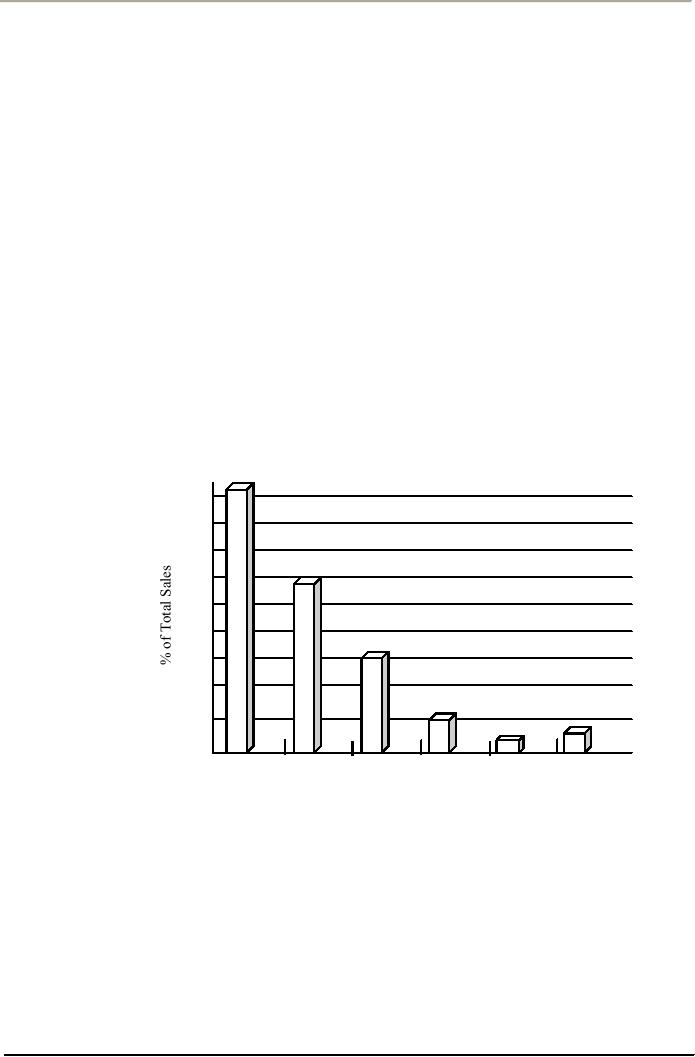
for improvement. The
Pareto
chart below labels a company's customers
A. B. C, D, E. and All Others. The bars
represent the
percentage
of the company's sales going to the
respective customers. Seventy-five
percent of this
company's
sales are the result of just
two customers. If one adds
customer C, 90% of its sales
are
accounted
for. All the other customers' together
account for only 10% of the
company's sales. Bear in
mind
that
"Other"
may include a very large
number of small customers. Which
customers are the ones who
should
be
kept happy? Obviously, A, B, and
perhaps C are the most
critical.
This
would suggest that customers
A, B, and Care the company's
core market and all the
other
customers
represent a marginal business. Decisions
on where to allocate resources should be
made
accordingly.
45
40
35
30
25
20
15
10
5
0
C
D
E
F
A
B
Pareto
Chart: Percentage of Total
Sales by Customer Customers
It
is often used to analyze the attribute
data collected in check
sheets. In a Pareto distribution
the
characteristics
are ordered from largest frequency to
smallest. For example, if the
airline attribute data
in
check
sheet above is placed in order of
decreasing frequency, the result
below is shown as a Pareto in
descending
order to focus on vital few
is
1.
Baggage
delay
2.
Poor
Cabin service
3.
Missed
connection
4.
Lost
baggage
5.
Ticketing
error
156
Total
Quality Management
MGT510
VU
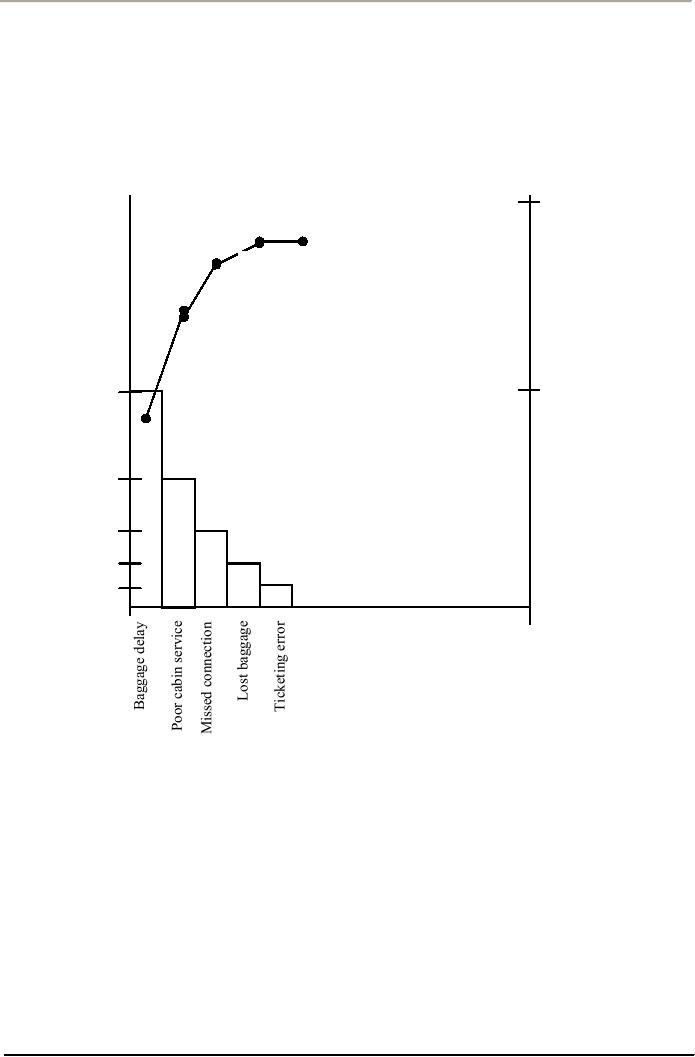
A
Pareto diagram is a histogram of
these data, as shown in above Figure. A
cumulative frequency
curve
is
usually drawn on the histogram, as shown
above. Such pictures clearly show the
relative magnitude of
defects
and can be used to identify the
most promising opportunities
for improvement (the few
faults
which
causing 80% of problems.) They can
also show the results of improvement
projects over time by
drawing
Pareto after every project
is complete.
Example
of a Pareto Diagram
Frequency
Percent
100
Cumulative
Percent
23
50
14
7
4
2
157
Table of Contents:
- OVERVIEW OF QUALITY MANAGEMENT:PROFESSIONAL MANAGERIAL ERA (1950)
- TOTAL QUALITY MANAGEMENT AND TOTAL ORGANIZATION EXCELLENCE:Measurement
- INTEGRATING PEOPLE AND PERFORMANCE THROUGH QUALITY MANAGEMENT
- FUNDAMENTALS OF TOTAL QUALITY AND RATERS VIEW:The Concept of Quality
- TOTAL QUALITY MANAGEMENT AND GLOBAL COMPETITIVE ADVANTAGE:Customer Focus
- TOTAL QUALITY MANAGEMENT AND PLANNING FOR QUALITY AT OFFICE
- LEADERS IN QUALITY REVOLUTION AND DEFINING FOR QUALITY:User-Based
- TAGUCHI LOSS FUNCTION AND QUALITY MANAGEMENT
- WTO, SHIFTING FOCUS OF CORPORATE CULTURE AND ORGANIZATIONAL MODEL OF MANAGEMENT
- HISTORY OF QUALITY MANAGEMENT PARADIGMS
- DEFINING QUALITY, QUALITY MANAGEMENT AND LINKS WITH PROFITABILITY
- LEARNING ABOUT QUALITY AND APPROACHES FROM QUALITY PHILOSOPHIES
- TOTAL QUALITY MANAGEMENT THEORIES EDWARD DEMINGS SYSTEM OF PROFOUND KNOWLEDGE
- DEMINGS PHILOSOPHY AND 14 POINTS FOR MANAGEMENT:The cost of quality
- DEMING CYCLE AND QUALITY TRILOGY:Jurans Three Basic Steps to Progress
- JURAN AND CROSBY ON QUALITY AND QUALITY IS FREE:Quality Planning
- CROSBYS CONCEPT OF COST OF QUALITY:Cost of Quality Attitude
- COSTS OF QUALITY AND RETURN ON QUALITY:Total Quality Costs
- OVERVIEW OF TOTAL QUALITY APPROACHES:The Future of Quality Management
- BUSINESS EXCELLENCE MODELS:Excellence in all functions
- DESIGNING ORGANIZATIONS FOR QUALITY:Customer focus, Leadership
- DEVELOPING ISO QMS FOR CERTIFICATION:Process approach
- ISO 9001(2000) QMS MANAGEMENT RESPONSIBILITY:Issues to be Considered
- ISO 9001(2000) QMS (CLAUSE # 6) RESOURCES MANAGEMENT:Training and Awareness
- ISO 9001(2000) (CLAUSE # 7) PRODUCT REALIZATION AND CUSTOMER RELATED PROCESSES
- ISO 9001(2000) QMS (CLAUSE # 7) CONTROL OF PRODUCTION AND SERVICES
- ISO 9001(2000) QMS (CLAUSE # 8) MEASUREMENT, ANALYSIS, AND IMPROVEMENT
- QUALITY IN SOFTWARE SECTOR AND MATURITY LEVELS:Structure of CMM
- INSTALLING AN ISO -9001 QM SYSTEM:Implementation, Audit and Registration
- CREATING BUSINESS EXCELLENCE:Elements of a Total Quality Culture
- CREATING QUALITY AT STRATEGIC, TACTICAL AND OPERATIONAL LEVEL
- BIG Q AND SMALL q LEADERSHIP FOR QUALITY:The roles of a Quality Leader
- STRATEGIC PLANNING FOR QUALITY AND ADVANCED QUALITY MANAGEMENT TOOLS
- HOSHIN KANRI AND STRATEGIC POLICY DEPLOYMENT:Senior Management
- QUALITY FUNCTION DEPLOYMENT (QFD) AND OTHER TOOLS FOR IMPLEMENTATION
- BASIC SQC IMPROVEMENT TOOLS:TOTAL QUALITY TOOLS DEFINED
- HOW QUALITY IS IMPLEMENTED? A DIALOGUE WITH A QUALITY MANAGER!
- CAUSE AND EFFECT DIAGRAM AND OTHER TOOLS OF QUALITY:Control Charts
- STATISTICAL PROCESS CONTROL (SPC) FOR CONTINUAL QUALITY IMPROVEMENT
- STATISTICAL PROCESS CONTROL .CONTD:Control Charts
- BUILDING QUALITY THROUGH SPC:Types of Data, Defining Process Capability
- AN INTERVIEW SESSION WITH OFFICERS OF A CMMI LEVEL 5 QUALITY IT PAKISTANI COMPANY
- TEAMWORK CULTURE FOR TQM:Steering Committees, Natural Work Teams
- UNDERSTANDING EMPOWERMENT FOR TQ AND CUSTOMER-SUPPLIER RELATIONSHIP
- CSR, INNOVATION, KNOWLEDGE MANAGEMENT AND INTRODUCING LEARNING ORGANIZATION